Full access
Regular Articles
Published Online: 25 September 2015

White Matter Abnormalities in Autism and Unaffected Siblings

Publication: The Journal of Neuropsychiatry and Clinical Neurosciences

Abstract

This study was conducted to identify a potential neuroendophenotype for autism using diffusion tensor imaging. Whole-brain, voxel-based analysis of fractional anisotropy was conducted in 50 children: 19 with autism, 20 unaffected siblings, and 11 controls. Relative to controls, participants with autism exhibited bilateral reductions in fractional anisotropy across association, commissure, and projection fibers. The most severely affected tracts included the uncinate fasciculus, forceps minor, and inferior fronto-occipital fasciculus. Unaffected siblings also exhibited reductions in fractional anisotropy, albeit less severe with fewer affected tracts, sparing the uncinate fasciculus and forceps minor. These results suggest the presence of a neuroendophenotype for autism.
An “endophenotype” can be defined as a hereditary characteristic that is normally associated with a condition but is not a direct symptom of it.1 This term has gained much attention in the past decade, particularly in the context of studying the genetic basis of neuropsychiatric disorders, including autism spectrum disorder (ASD). In part, this trend is driven by the extreme complexities of psychiatric genetics. Multiple genes are thought to underlie most mental illnesses. Moreover, there is a distal and convoluted connection between the genetic code and resulting phenotypes. These challenges motivate researchers to look for phenotypes that are more readily quantified and lie closer to the genetic basis of neuropsychiatric conditions. By examining simpler phenotypes, or endophenotypes, the hope is that susceptibility genes will be identified. Arguably, the endophenotypes of greatest utility are biological measures of neural substrates that are more proximal to susceptibility genes.2
Diffusion tensor imaging (DTI) is a type of structural MRI that enables in vivo assessment of white matter abnormalities by measuring fractional anisotropy (FA), a measure of fiber tract integrity derived from local water diffusion properties. Since the first DTI study was published a decade ago, dozens of studies have followed, which generally found reduced FA in children with ASD; however, only one study to date has reported on unaffected siblings (US) of individuals with ASD.3 This study sought to corroborate their findings that diffusion imaging could identify a neuroendophenotype in US while more strictly excluding the broad autism phenotype in siblings.4 We hypothesized that although the behavioral phenotype is completely absent in US, their brain phenotype is similar to that of children with ASD, albeit with less abnormality. On the basis of our previous work,5 we predicted that ASD and US groups would exhibit greater abnormalities in the forceps minor and inferior fronto-occipital fasciculus compared with typically developing (TD) children.

Methods

Patients

The DTI data collected were part of a larger set for functional MRI studies in our group. No significant between-group differences were found for age, gender, or handedness (p≥0.05; Table 1). The study included a total of 50 participants: 19 with ASD, 20 US, and 11 TD controls. All participants were screened for neurological disease or insult that could be related to abnormal brain development, including seizures and head injury with loss of consciousness.
TABLE 1. Summary and Comparison of Participant Characteristicsa
VariableASD (N=19)US (N=20)TD (N=11)ASD Versus TDUS Versus TDASD Versus US
Nominal variablesb      
 Gender (male/female)15/413/78/30.15, n.s.0.19, n.s.0.94, n.s.
 Handedness (right/left)18/120/010/10.16, n.s.1.9, n.s.1.1, n.s.
Scale variablesc      
 Age (years)11.01 (3.48)10.24 (2.63)12.14 (2.49)0.94, n.s.1.97, n.s.0.79, n.s.
 Intracranial volume (cc)1469 (162)1433 (207)1508 (232)0.68, n.s.–0.10, n.s.–0.97, n.s.
 Differential Ability Scale (GCA)94.5 (23.7)112.2 (17.0)d108.5 (9.2)–1.8, n.s.NAdNAd
 ADOS13.47 (5.15)NANANANANA
 SRS total raw score98.0 (19.7)22.0 (18.3)16.7 (14.6)–11.9, 1.8E–12–0.83, n.s.12.5, 7.7E–15
a
Values are expressed as ratios or means (standard deviations), unless otherwise indicated. ADOS, Autism Diagnostic Observation Schedule; ASD, autism spectrum disorder; GCA, General Conceptual Ability; NA, not applicable; SRS, Social Responsiveness Scale; TD, typically developing; US, unaffected sibling.
b
Gender and handedness group comparisons were calculated using the chi-square test and are expressed as chi-square and p values, respectively.
c
Scale variable group comparisons were calculated using Student’s t test and are expressed as t and p values, respectively.
d
The Wechsler Abbreviated Scale of Intelligence Full-Scale IQ (incomplete data, N=12) was used for evaluation but was not directly compared with the Differential Ability Scale.
For the ASD group, diagnosis was based on parental information, clinical history according to criteria in DSM-IV-TR,6 and evaluation by licensed psychologists with expertise in autism. The evaluation consisted of gold standard assessments, including the Autism Diagnostic Interview–Revised and the Autism Diagnostic Observation Schedule administered by a licensed psychologist who is research reliable on both assessments.7,8 All ASD participants were high functioning, with cognitive abilities group matched to TD participants using the Differential Ability Scale–II.9
For the US group, the ASD diagnosis of a sibling was confirmed using DSM-IV-TR.6 It was not a criterion that the affected sibling participated in this study, although some sibling pairs were used. An important characteristic of this study is that all US participants were screened and excluded for the broad autism phenotype using the Social Responsiveness Scale (<76), and US and TD participants were group matched based on their scale scores.10 In addition, a semistructured clinical interview was conducted with US participants to further confirm the absence of autistic traits and to rule out any history of other neurological or psychiatric conditions. This strict exclusion criterion ensures that any identified differences in white matter structure between US and TD groups are not the result of use-dependent processes and are not reflective of subtle differences in social ability. Most US participants’ cognitive abilities were evaluated using the Wechsler Abbreviated Scale of Intelligence.11
TD participants were screened for the broad autism phenotype with the same semistructured clinical interview and Social Responsiveness Scale cutoff score as US participants. In addition, TD participants were screened for history of ASD in first- or second-degree relatives. All group characteristics along with relevant statistics are summarized in Table 1. The Yale Human Investigation Committee approved this study. Informed consent was obtained from a parent/guardian and each participant provided verbal assent.

Neuroimaging

Three-tesla MRI was performed with the following DTI parameters: directions=30, b0=5, repetition time=6200 ms, echo time=85 ms, field of view=240×240 mm2, thickness=2.5 mm (isotropic), number of slices=55, averages=3, and total scan time=11 minutes. Whole-brain T1-weighted MRI was performed using a sagittal 1-mm3 magnetization-prepared rapid gradient echo sequence. All imaging was performed in the same session after completing mock MRI session(s).

Quality Assurance

The quality of diffusion MRI data was ensured through a multistep procedure that addressed eddy current distortion, head motion, and signal dropout. First, diffusion-weighted images were corrected for eddy current distortion and head motion. Second, all volumes (i.e., diffusion directions) were individually inspected for head motion and signal dropout by an experienced rater (R.J.J.) who performed DTI analyses in previous studies.5,28 Volumes with excessive motion or dropout were spliced out and excluded from the analysis. If more than six volumes required exclusion, then the entire run was dropped from the analysis. Using this method, one participant from the TD group and one participant from the ASD group were excluded from the analysis; no participants were excluded from the US group. Next, multiple runs (per subject) of diffusion-weighted data were averaged to improve the signal-to-noise ratio. FA maps were individually assessed to confirm absence of artifact or distortion.

Data Analysis

All data processing and local diffusion modeling were conducted using the FMRIB Software Library (FSL) (fsl.fmrib.ox.ac.uk/fsl/). The program was used to generate a mask to separate brain areas from nonbrain areas. Using the FMRIB’s Diffusion Toolbox (FDT), a diffusion tensor model was created and FA, axial diffusivity, and radial diffusivity were computed for each voxel.
Three group-wise comparisons were made: 1) ASD versus TD, 2) US versus TD, and 3) ASD versus US. Voxel-wise analysis of multisubject diffusion data was conducted using tract-based spatial statistics (TBSS). The procedure consisted of the following steps: 1) application of nonlinear registration so that all images were in Montreal Neurological Institute space, 2) creation of a mean image, 3) skeletonization of the mean image, 4) projection of all subjects’ diffusion imaging data onto the mean skeleton, and 5) submission of the four-dimensional–projected data for statistical testing. Areas of significant difference were identified (p<0.05 corrected for multiple comparisons across space using threshold-free cluster enhancement or TFCE). Voxels with significant differences in FA values were labeled as “affected voxels,” and only these voxels were used in the comparison of FA, axial diffusivity, and radial diffusivity between groups. Using the T1-weighted MRI data, intracranial volume was calculated using the FreeSurfer image analysis suite (surfer.nmr.mgh.harvard.edu/).
Affected white matter structures (fiber tracts) were identified using the Johns Hopkins University White Matter Tractography Atlas. This atlas was not only useful for identifying potentially affected fiber tracts, but it was also useful for more precise characterization of potential abnormality by quantifying affected voxels based on their tract labels. The Montreal Neurological Institute coordinates of all affected and unaffected voxels were captured and intersected with the aforementioned atlas. These voxels were assigned to atlas labels linking them to their respective association, commissural, or projection tracts. For each participant, affected voxels were grouped by label with their corresponding metrics (FA, axial diffusivity, or radial diffusivity), and counts were generated for each fiber tract. Summary statistics for FA, axial diffusivity, and radial diffusivity were computed for each fiber tract, first by individual and then by group. Percent abnormality was calculated for each tract by dividing the number of affected voxels by the total number of voxels compared. This represents the degree of white matter abnormality by tract.
Post-hoc Pearson's correlation analyses were performed between mean FA within affected fibers and SRS total scores. Where appropriate, Bonferroni correction implemented for multiple comparisons.

Results

ASD Versus TD Groups

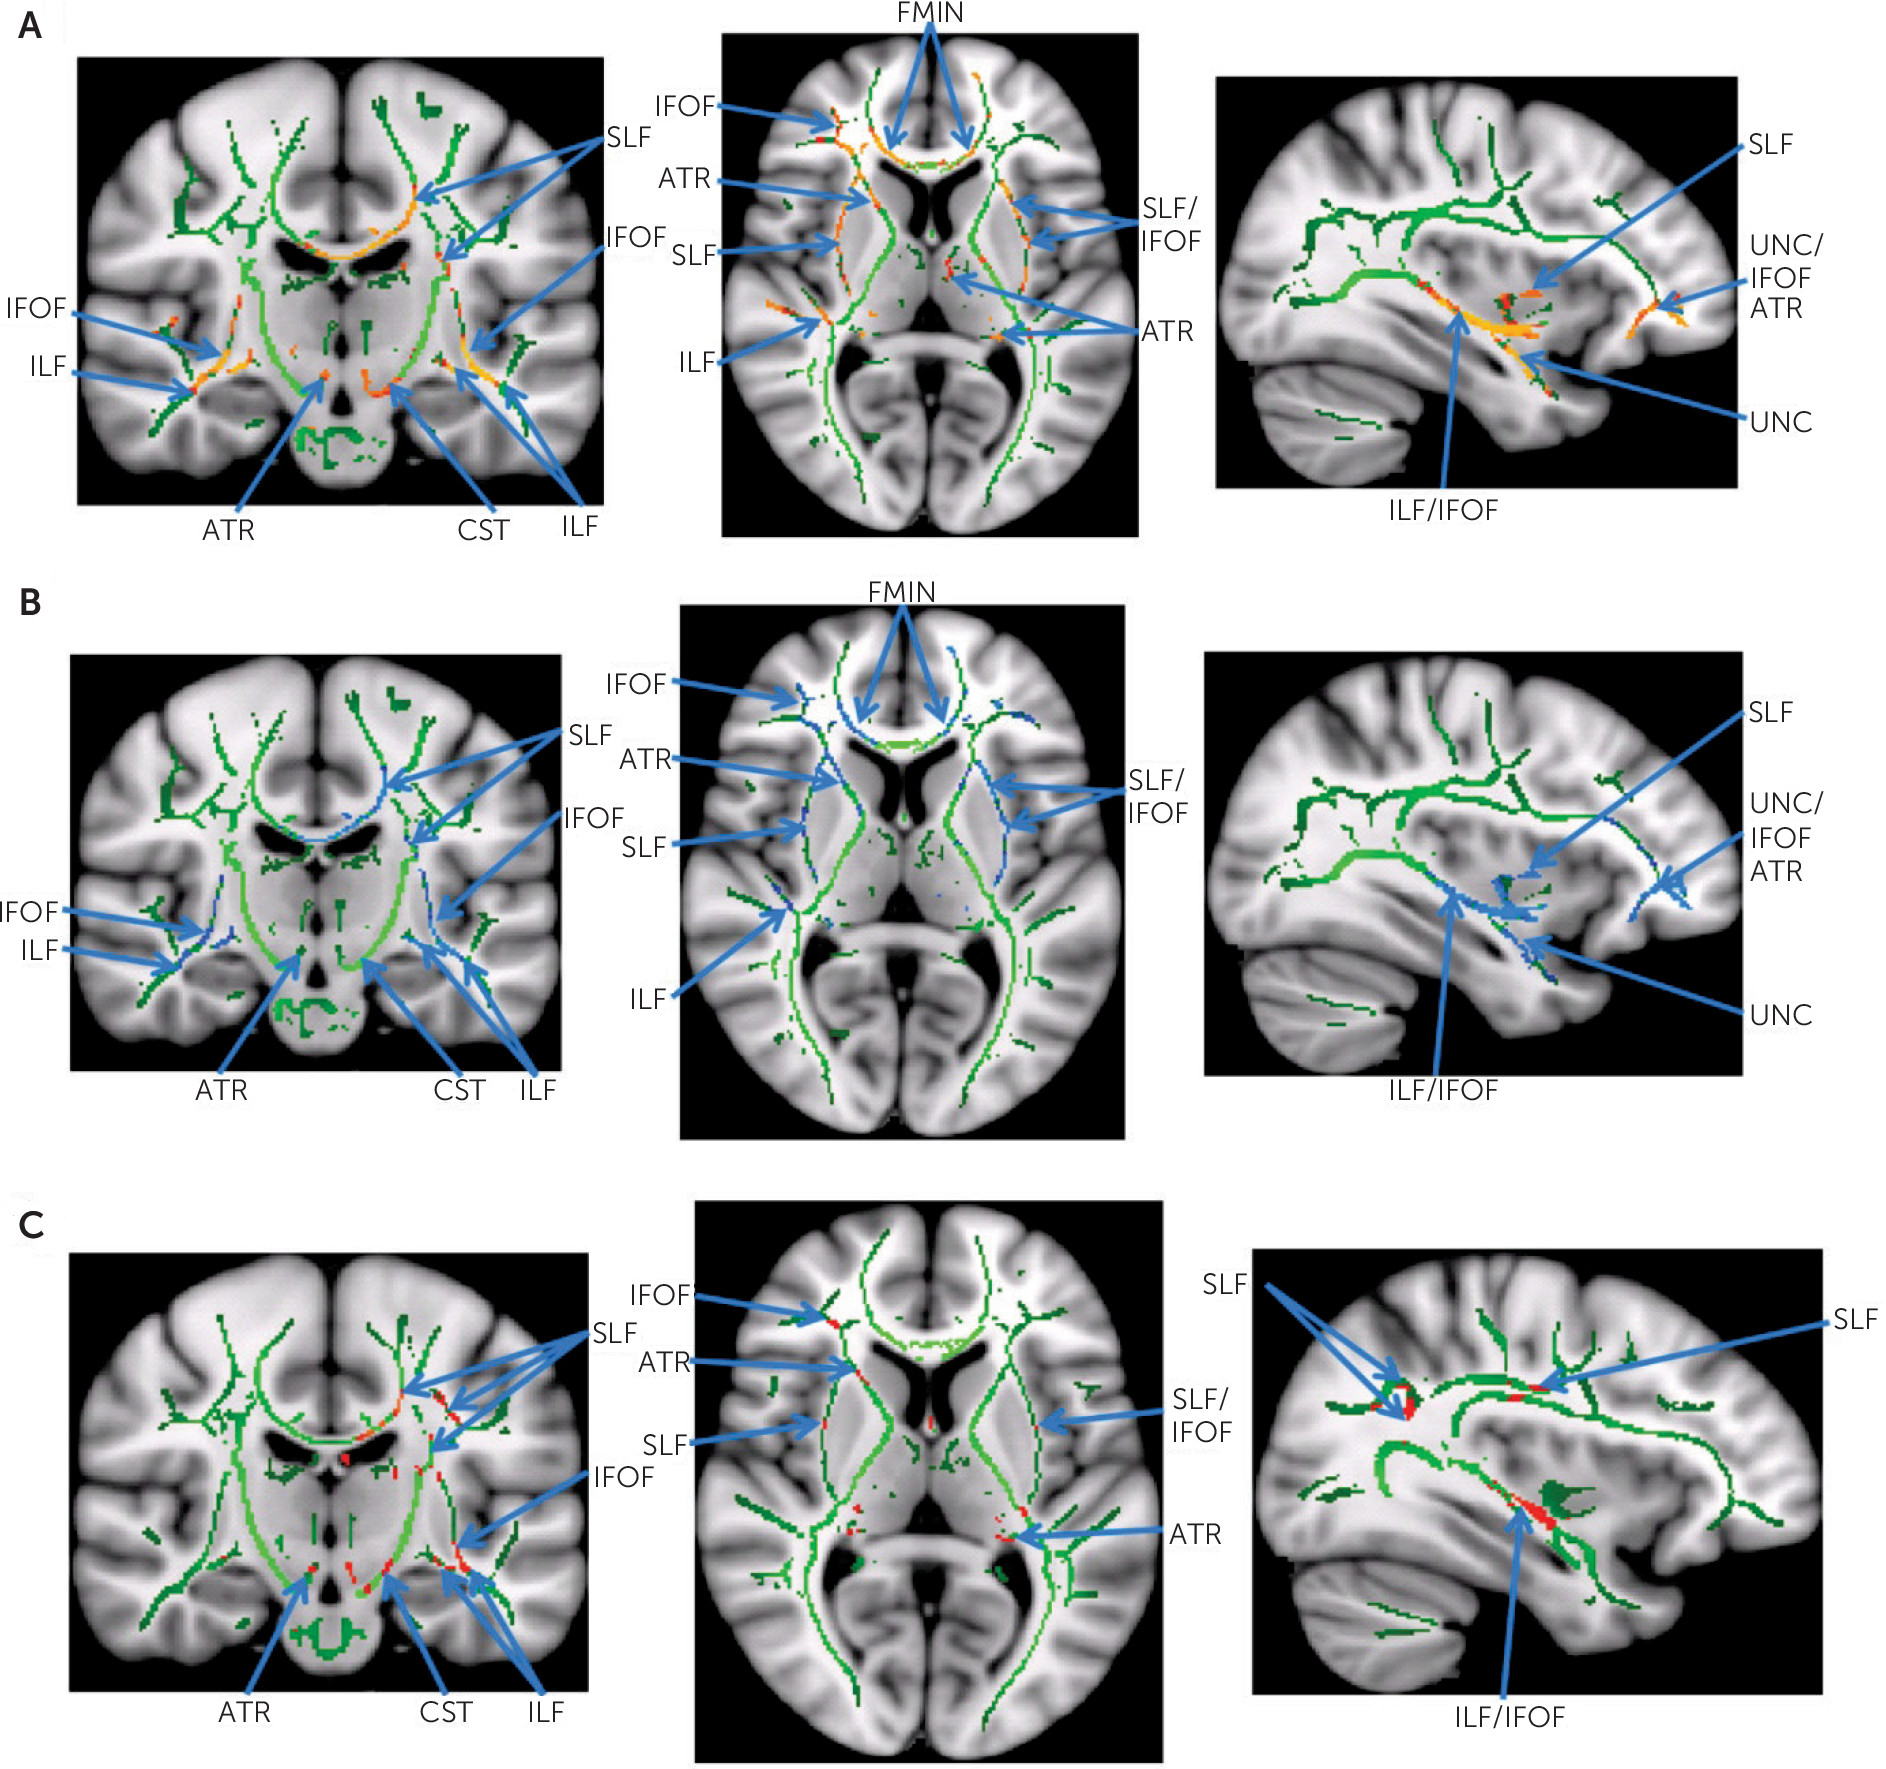
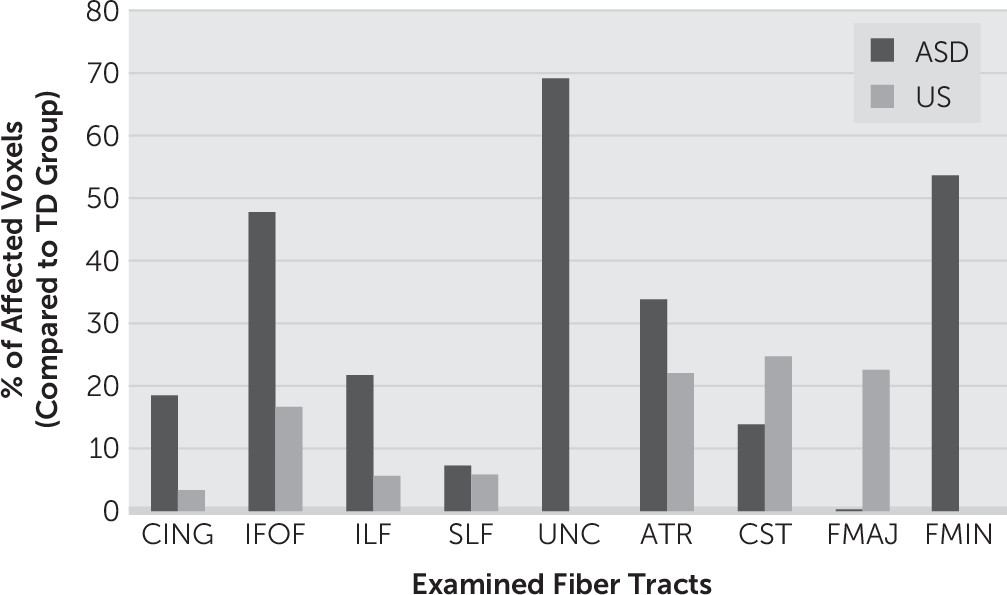
The ASD group exhibited significant bilateral reductions in FA in all examined tracts, including association, commissural, and projection tracts (Figure 1 [A], Table 2). FA abnormalities were widespread; however, not all tracts were equally affected (Figure 2). Tracts with the highest percentage of affected voxels included association and commissure fibers. The most affected structures included the uncinate fasciculus, forceps minor, and inferior fronto-occipital fasciculus. The ASD group had significant bilateral increases in radial diffusivity involving the association, commissural, and projection tracts (Figure 1 [B]). Distribution of these abnormalities was similar to that observed for FA. There were no significant group differences in axial diffusivity. Notably, there were no voxels in which FA was significantly increased or radial diffusivity was significantly decreased in the ASD group. Exploratory Pearson’s correlation analyses did not yield significant relationships between mean FA within affected fibers and Social Responsiveness Scale total scores (Table 2).
FIGURE 1. Statistically Significant Group Differences in Surrogates for White Matter Integritya
a[A] Widespread areas of reduced FA in the autism spectrum group compared with controls. All major fiber tracts were affected, but to different degrees. There were no areas of increased FA in the ASD group. [B] Areas of increased radial diffusivity in the autism spectrum group compared with controls. Abnormalities resemble FA reductions. There were no areas of decreased radial diffusivity in the ASD group. [C] Areas of reduced FA in the unaffected sibling group compared with controls. The degree of diffusion abnormality is less widespread than that seen in the ASD group. There were no areas of increased FA in the unaffected sibling group. The association tracts were as follows: CING, cingulum (not pictured); IFOF, inferior fronto-occipital fasciculus; ILF, inferior longitudinal fasciculus; SLF, superior longitudinal fasciculus; and UNC, uncinate fasciculus. The projection tracts were as follows: ATR, anterior thalamic radiation; and CST, corticospinal tract. The commissural tracts were as follows: FMAJ, forceps major (not pictured); FMIN, forceps minor. ASD, autism spectrum disorder; FA, fractional anisotropy; TD, typically developing.
TABLE 2. ASD Group Versus Controls: Summary of FA for Affected Long-Range Fiber Tracts by Type With Percentage of Voxels Significantly Abnormal and Correlation With Total SRS Scorea
Affected Long-Range Fiber Tracts by Type and Percent AbnormalityAnalysis of FA Using Tract-Based Spatial StatisticsPearson’s r for FA and SRSb
HemisphereASDControlCohen’s dASDControl
Association fiber tracts      
 CingulumLeft0.52 (0.05)0.57 (0.03)1.19–0.05–0.02
  18.6%Right0.46 (0.07)0.51 (0.07)0.70–0.330.53
 Inferior fronto-occipital fasciculusLeft0.43 (0.03)0.47 (0.02)1.67–0.14–0.31
  46.7%Right0.41 (0.03)0.45 (0.02)1.68–0.100.02
 Inferior longitudinal fasciculusLeft0.38 (0.03)0.42 (0.03)1.47–0.16–0.03
  21.7%Right0.36 (0.03)0.41 (0.02)1.76–0.34–0.32
 Superior longitudinal fasciculusLeft0.40 (0.03)0.43 (0.03)1.09–0.43–0.07
  7.3%Right0.38 (0.03)0.43 (0.02)1.56–0.26–0.03
 Uncinate fasciculusLeft0.41 (0.02)0.45 (0.02)1.82–0.260.12
  69.2%Right0.42 (0.03)0.46 (0.02)1.79–0.220.15
Projection fiber tracts      
 Anterior thalamic radiationLeft0.45 (0.03)0.49 (0.02)1.40–0.300.25
  33.8%Right0.45 (0.02)0.49 (0.02)1.73–0.230.04
 Corticospinal tractLeft0.64 (0.03)0.67 (0.02)1.15–0.120.19
  13.9%Right0.52 (0.03)0.55 (0.02)1.22–0.060.10
Commissural fiber tracts      
 Forceps majorNA0.60 (0.04)0.64 (0.05)0.91–0.10–0.04
  0.3%      
 Forceps minorNA0.59 (0.03)0.63 (0.02)1.80–0.11–0.52
  53.6%      
a
Values are presented as means (standard deviations) unless otherwise indicated. ASD, autism spectrum disorder; FA, Fractional Anisotropy; NA, not applicable; SRS, Social Responsiveness Scale.
b
All p values were not significant.
FIGURE 2. Graph Illustrating the Contrast in Severity and Distribution Pattern of Affected Tracts Between ASD and US Groups Compared With TD Controlsa
aSeverity is determined by the percentage of voxels for a given tract, which significantly differ in FA value from the TD group. This supports the possibility of an intermediate or neuroendophenotype in US participants who do not exhibit any autistic traits. The association tracts were as follows: CING, cingulum; IFOF, inferior fronto-occipital fasciculus; ILF, inferior longitudinal fasciculus; SLF, superior longitudinal fasciculus; and UNC, uncinate fasciculus. The projection tracts were as follows: ATR, anterior thalamic radiation; and CST, corticospinal tract. The commissural tracts were as follows: FMAJ, forceps major; and FMIN, forceps minor. ASD, autism spectrum disorder; FA, fractional anisotropy; TD, typically developing; US, unaffected siblings.

US Versus TD Groups

The US group had significant bilateral FA reductions in all but two tracts (uncinate fasciculus and forceps minor), including the association, commissural, and projection tracts (Figure 1 [C], Table 3). Distribution of FA anomalies was widespread; however, not all tracts were equally affected (Figure 2). Those tracts with the highest percentage of affected voxels were different compared with the ASD and TD relationship described earlier. Specifically, abnormalities were skewed more toward projection and away from association fibers. Moreover, the severity by which each was affected was much lower. More severely affected structures for the US group included the corticospinal tract, forceps major, and anterior thalamic radiation. The US group had significant bilateral increases in radial diffusivity involving the association, commissural, and projection tracts. There were some differences in the distribution of these abnormalities compared with that observed for FA. For radial diffusivity, tracts with the highest number of affected voxels included the superior longitudinal fasciculus, forceps major, and inferior fronto-occipital fasciculus. There were no significant group differences in axial diffusivity. Notably, there were no voxels in which FA was significantly increased or radial diffusivity was significantly decreased in the US group. Exploratory Pearson’s correlation analyses did not yield any significant relationships between mean FA within affected fibers and Social Responsiveness Scale total scores after correcting for multiple comparisons (Table 3).
TABLE 3. US Group Versus Controls: Summary of the FA for Affected Long-Range Fiber Tracts by Type With Percentage of Voxels Significantly Abnormal and Correlation With Total SRS Scorea
Affected Long-Range Fiber Tracts by Type and Percent AbnormalityAnalysis of FA Using Tract-Based Spatial StatisticsPearson’s r for FA and SRSb
HemisphereUSControlCohen’s dUSControl
Association fiber tracts      
 CingulumLeft0.53 (0.05)0.58 (0.05)0.950.08–0.33
  3.4%Right0.40 (0.06)0.49 (0.07)1.370.110.06
 Inferior fronto-occipital fasciculusLeft0.49 (0.03)0.53 (0.03)1.400.29–0.64, p=0.04c
  16.7%Right0.39 (0.02)0.43 (0.02)1.92–0.140.17
 Inferior longitudinal fasciculusLeft0.45 (0.02)0.49 (0.03)1.590.41–0.02
  5.7%Right0.44 (0.03)0.48 (0.05)0.810.200.29
 Superior longitudinal fasciculusLeft0.43 (0.02)0.47 (0.03)1.29–0.320.23
  5.9%Right0.39 (0.02)0.44 (0.02)2.68–0.280.07
 Uncinate fasciculusLeftNANANANANA
  0.0%RightNANANANANA
Projection fiber tracts      
 Anterior thalamic radiationLeft0.44 (0.02)0.47 (0.02)1.790.100.32
  22.1%Right0.45 (0.02)0.49 (0.02)1.920.010.16
 Corticospinal tractLeft0.56 (0.02)0.60 (0.02)1.840.310.06
  24.8%Right0.50 (0.02)0.53 (0.02)1.590.29–0.08
Commissural fiber tracts      
 Forceps majorNA0.60 (0.03)0.66 (0.03)1.730.09–0.21
  22.6%      
 Forceps minorNANANANANANA
  0.0%      
a
Values are presented as means (standard deviations) unless otherwise indicated. FA, Fractional Anisotropy; NA, not applicable; SRS, Social Responsiveness Scale; US, unaffected siblings.
b
All p values were not significant, with one exception as noted.
c
This p value was not significant after Bonferroni correction for multiple comparisons.

ASD Versus US Groups

Differences between the ASD and US groups were not statistically significant with respect to FA, radial diffusivity, and axial diffusivity. However, as demonstrated in Figure 2, when each group was compared with the TD group, the degree to which each tract was affected differed between the ASD and US groups.

Discussion

As the term broad autism phenotype implies, the symptoms or behavioral phenotype of ASD lie on a continuum.4 In this study, both US and TD groups lie on the unaffected end of the spectrum, which was ensured by strictly excluding participants with a broad autism phenotype. This study explored whether US, who show no signs of autism, exhibit an intermediate neural phenotype based on their genetic liability for ASD. The primary goal of this study was to detect the presence of this neuroendophenotype in US. Notably, the presence of neural abnormalities in US (matched to TD on behavioral phenotype) would suggest that this is an endophenotype and not a function of experience-dependent processes.
As presented above, there were no significant abnormalities when comparing the ASD group with the US group, suggesting that the neural phenotypes are similar. Interestingly, there are significant differences in multiple diffusion measures when comparing the ASD group with TD participants and the US group with TD participants. The differences are much greater in the former than in the latter; moreover, some of these differences do not overlap. That is, the difference between US and TD groups is not simply a milder version of the difference between ASD and TD participants (Figure 2). These results suggest a neuroendophenotype that superficially resembles probands, although there are key differences in the severity and distribution of these abnormalities.
The apparent sparing of the uncinate fasciculus and forceps minor in the US group is remarkable (Figure 2, Table 3), especially given the observation that these two fiber tracts were the most severely affected in the ASD group. The importance of the uncinate fasciculus, an intrahemispheric association tract of the frontal and temporal lobes, has already been recognized in the pathophysiology of ASD.12 The uncinate plays a role in the mirror neuron system, a complex of neurons repeatedly reported to be aberrant in ASD.1315 The uncinate fasciculus also includes projections into the cortical nuclei of the amygdala, a limbic structure involved in human social interactions, emotion processing, and pathophysiology of ASD.1618 Functional MRI studies in ASD have repeatedly revealed aberrant functional connectivity between the frontal and temporal lobes.19
The prominent abnormalities of diffusion parameters in the forceps minor, part of the anterior aspect of the corpus callosum, are in line with findings from a previous meta-analysis of MRI studies that focused on corpus callosum size and demonstrated a significantly smaller corpus callosum in ASD.20 Disruption of the corpus callosum, a topographically organized interhemispheric structure, may contribute many of the sensory, cognitive, and behavioral symptoms observed in individuals with ASD.21 Individuals with primary agenesis of the corpus callosum consistently exhibit impaired social skills and poor personal insight.22 In one study, 8.5% of individuals with agenesis of the corpus callosum carried an ASD diagnosis.23 In addition, previous functional MRI studies reported interhemispheric disconnectivity, suggesting corpus callosum involvement in ASD.24,25
The qualitative pattern of tract abnormality seen in the US group is congruent with the clinical differences in behavioral phenotype between the ASD and broad autism phenotype–negative US groups. First, the US group displayed a much lower level of tract abnormality in general, with maximum percent abnormality of any tract being 25% and 70% in the US and ASD groups, respectively (Figure 2). Second, those tracts most affected in USs correspond to projection tracts, which have no clear role in social information processing. What the ASD and US groups have in common are abnormal diffusion measurements, which may represent general impairments in white matter integrity. Differences in both the severity and distribution of these abnormalities may account for the difference in behavioral phenotype. However, it is premature to state that the aforementioned tracts differentiate ASD and US neural phenotypes until this can be confirmed in much larger studies.
These findings should be interpreted within the context of important study limitations. Participants were selected from data collected for previous functional MRI studies by our group. Because this was a retrospective analysis, we were not able to precisely match the groups on age and gender. Given the known changes of FA with age, our sample consisted of individuals within a limited age range, well past the age of diagnosis, and during a period of relative trait stability.26,27 Although there were no significant between-group differences, we cannot exclude the possibility of developmental effects on our groups or the potential for gender discrepancies in white matter development. In addition, the majority of the US participants received the Wechsler Abbreviated Scale of Intelligence rather than the Differential Ability Scale, excluding the ability to directly match on cognitive abilities. We do not expect significant effects of IQ given that all group mean scores were within the average range. Findings reported here need replication with a larger population and greater TD sample size. Finally, the functional consequences of white matter abnormalities in US remain unknown without more detailed neuropsychological testing.
Overall, the intermediate neural phenotype in US demonstrates a milder pattern of white matter abnormalities with differences in which specific tracts are affected (Figure 2). In agreement with recently reviewed DTI findings, this study provides further evidence of global abnormalities in long-range connectivity in ASD involving association, commissural, and projection fibers.28 In addition, there is some suggestion of different brain anomalies in ASD involving the uncinate and forceps minor. The presence of significant differences only in the ASD group compared with TD participants and the US group compared with TD participants (and not ASD compared with US) suggests that the US intermediate brain phenotype is likely more similar to ASD, although the US behavioral phenotype is similar to the TD group. The finding that white matter tract abnormalities are present in US participants without the broad autism phenotype suggests that these findings are true endophenotypes and not the product of a use-dependent process.
Acknowledgments

The authors thank the children and families for participating in this study. The authors also thank Ms. Liza Estevez who assisted in the proof-reading of the manuscript.

References

1.
Gottesman II, Gould TD: The endophenotype concept in psychiatry: etymology and strategic intentions. Am J Psychiatry 2003; 160:636–645
2.
Cannon TD, Rosso IM: Levels of analysis in etiological research on schizophrenia. Dev Psychopathol 2002; 14:653–666
3.
Barnea-Goraly N, Lotspeich LJ, Reiss AL: Similar white matter aberrations in children with autism and their unaffected siblings: a diffusion tensor imaging study using tract-based spatial statistics. Arch Gen Psychiatry 2010; 67:1052–1060
4.
Hurley RS, Losh M, Parlier M, et al: The broad autism phenotype questionnaire. J Autism Dev Disord 2007; 37:1679–1690
5.
Jou RJ, Mateljevic N, Kaiser MD, et al: Structural neural phenotype of autism: preliminary evidence from a diffusion tensor imaging study using tract-based spatial statistics. AJNR Am J Neuroradiol 2011; 32:1607–1613
6.
APA: Diagnostic and Statistical Manual of Mental Disorders, 4th ed., Text Revision (DSM-IV-TR). Washington, DC, APA, 2000
7.
Lord C, Rutter M, Le Couteur A: Autism Diagnostic Interview–Revised: a revised version of a diagnostic interview for caregivers of individuals with possible pervasive developmental disorders. J Autism Dev Disord 1994; 24:659–685
8.
Lord C, Rutter M, Goode S, et al: Autism diagnostic observation schedule: a standardized observation of communicative and social behavior. J Autism Dev Disord 1989; 19:185–212
9.
Elliott CD: Differential Ability Scales–Second Edition (DAS-II). San Antonio, TX, Psychological Corp, 2007
10.
Constantino JN: The Social Responsiveness Scale. Los Angeles, Western Psychological Services, 2002
11.
Wechsler D: Wechsler Abbreviated Scale of Intelligence (WASI). San Antonio, TX, Psychological Corp, 1999
12.
Vissers ME, Cohen MX, Geurts HM: Brain connectivity and high functioning autism: a promising path of research that needs refined models, methodological convergence, and stronger behavioral links. Neurosci Biobehav Rev 2012; 36:604–625
13.
Bastiaansen JA, Thioux M, Nanetti L, et al: Age-related increase in inferior frontal gyrus activity and social functioning in autism spectrum disorder. Biol Psychiatry 2011; 69:832–838
14.
Enticott PG, Kennedy HA, Rinehart NJ, et al: Mirror neuron activity associated with social impairments but not age in autism spectrum disorder. Biol Psychiatry 2012; 71:427–433
15.
Yamasaki S, Yamasue H, Abe O, et al: Reduced gray matter volume of pars opercularis is associated with impaired social communication in high-functioning autism spectrum disorders. Biol Psychiatry 2010; 68:1141–1147
16.
Ebeling U, von Cramon D: Topography of the uncinate fascicle and adjacent temporal fiber tracts. Acta Neurochir (Wien) 1992; 115:143–148
17.
Hasan KM, Iftikhar A, Kamali A, et al: Development and aging of the healthy human brain uncinate fasciculus across the lifespan using diffusion tensor tractography. Brain Res 2009; 1276:67–76
18.
Schultz RT: Developmental deficits in social perception in autism: the role of the amygdala and fusiform face area. Int J Dev Neurosci 2005; 23:125–141
19.
Lai G, Pantazatos SP, Schneider H, et al: Neural systems for speech and song in autism. Brain 2012; 135:961–975
20.
Frazier TW, Hardan AY: A meta-analysis of the corpus callosum in autism. Biol Psychiatry 2009; 66:935–941
21.
Lazarev VV, Pontes A, Mitrofanov AA, et al: Interhemispheric asymmetry in EEG photic driving coherence in childhood autism. Clin Neurophysiol 2010; 121:145–152
22.
Paul LK, Brown WS, Adolphs R, et al: Agenesis of the corpus callosum: genetic, developmental and functional aspects of connectivity. Nat Rev Neurosci 2007; 8:287–299
23.
Doherty D, Tu S, Schilmoeller K, et al: Health-related issues in individuals with agenesis of the corpus callosum. Child Care Health Dev 2006; 32:333–342
24.
Anderson JS, Druzgal TJ, Froehlich A, et al: Decreased interhemispheric functional connectivity in autism. Cereb Cortex 2011; 21:1134–1146
25.
Dinstein I, Pierce K, Eyler L, et al: Disrupted neural synchronization in toddlers with autism. Neuron 2011; 70:1218–1225
26.
Holmboe K, Rijsdijk FV, Hallett V, et al: Strong genetic influences on the stability of autistic traits in childhood. J Am Acad Child Adolesc Psychiatry 2014; 53:221–230
27.
Constantino JN, Abbacchi AM, Lavesser PD, et al: Developmental course of autistic social impairment in males. Dev Psychopathol 2009; 21:127–138
28.
Jou RJ, Staib LH: Diffusion tensor magnetic resonance imaging, in Encyclopedia of Autism Spectrum Disorders. Edited by Volkmar FR. New York, Springer-Verlag, 2013, pp 966–975

Information & Authors

Information

Published In

Go to The Journal of Neuropsychiatry and Clinical Neurosciences
The Journal of Neuropsychiatry and Clinical Neurosciences
Pages: 49 - 55
PubMed: 26404174

History

Received: 13 May 2015
Revision received: 29 June 2015
Accepted: 8 July 2015
Published online: 25 September 2015
Published in print: Winter 2016

Authors

Details

Roger J. Jou, M.D., Ph.D.
From the Center for Translational Developmental Neuroscience (CTDN), Yale Child Study Center, New Haven, CT.
Hannah E. Reed, M.D.
From the Center for Translational Developmental Neuroscience (CTDN), Yale Child Study Center, New Haven, CT.
Martha D. Kaiser, Ph.D.
From the Center for Translational Developmental Neuroscience (CTDN), Yale Child Study Center, New Haven, CT.
Avery C. Voos, B.A.
From the Center for Translational Developmental Neuroscience (CTDN), Yale Child Study Center, New Haven, CT.
Fred R. Volkmar, M.D.
From the Center for Translational Developmental Neuroscience (CTDN), Yale Child Study Center, New Haven, CT.
Kevin A. Pelphrey, Ph.D.
From the Center for Translational Developmental Neuroscience (CTDN), Yale Child Study Center, New Haven, CT.

Notes

Send correspondence to Dr. Jou; e-mail: [email protected]

Competing Interests

The authors report no financial relationships with commercial interests.

Funding Information

Simons Foundation10.13039/100000893: SFARI 95489
National Institute of Mental Health10.13039/100000025: R01 MH084080
NARSAD Brain & Behavior Research Fund Young Investigator Award Foster Bam Investigator: 17555
ANA/Pfizer Fellowships in Clinical Practice from Pfizer's Medical and Academic Partnership program: 2241
Hilibrand Foundation Autism Fellowship in Adolescence and Adulthood: Yale 1066062
Autism Speaks10.13039/100000073: 1344
This work was supported by grants from NIMH (R01-MH084080), Autism Speaks (1344), and the Simons Foundation (SFARI-95489). This research was also made possible through the Hilibrand Foundation Autism Fellowship in Adolescence and Adulthood (Yale 1066062), NARSAD Brain & Behavior Research Fund Young Investigator Award Foster Bam Investigator (17555), and ANA/Pfizer Fellowships in Clinical Practice from Pfizer’s Medical and Academic Partnership program (2241).

Metrics & Citations

Metrics

Citations

Export Citations

If you have the appropriate software installed, you can download article citation data to the citation manager of your choice. Simply select your manager software from the list below and click Download.

For more information or tips please see 'Downloading to a citation manager' in the Help menu.

Format
Citation style
Style
Copy to clipboard

View Options

View options

PDF/EPUB

View PDF/EPUB

Login options

Already a subscriber? Access your subscription through your login credentials or your institution for full access to this article.

Personal login Institutional Login Open Athens login
Purchase Options

Purchase this article to access the full text.

PPV Articles - Journal of Neuropsychiatry and Clinical Neurosciences

PPV Articles - Journal of Neuropsychiatry and Clinical Neurosciences

Not a subscriber?

Subscribe Now / Learn More

PsychiatryOnline subscription options offer access to the DSM-5-TR® library, books, journals, CME, and patient resources. This all-in-one virtual library provides psychiatrists and mental health professionals with key resources for diagnosis, treatment, research, and professional development.

Need more help? PsychiatryOnline Customer Service may be reached by emailing [email protected] or by calling 800-368-5777 (in the U.S.) or 703-907-7322 (outside the U.S.).

Media

Figures

Other

Tables

Share

Share

Share article link

Share