Full access
Regular Articles
Published Online: 25 January 2017

Focal Changes to Human Electrocorticography With Drowsiness: A Novel Measure of Local Sleep

Publication: The Journal of Neuropsychiatry and Clinical Neurosciences

Abstract

Drowsiness may be defined as the progressive loss of cortical processing efficiency that occurs with time passing while awake. This loss of cortical processing efficiency is reflected in focal changes to the electroencephalogram, including islands of increased delta power concurrent with drop-offs in neuronal activity (i.e., focal cortical inactivity). The authors hypothesized that these focal changes are evidenced at individual electrodes by combination of increased instantaneous amplitude in delta band and decreased instantaneous frequency in theta-alpha band, permitting their categorization as “active” and “inactive.” An analysis of records from six patients with refractory epilepsy undergoing video-electrocorticographic monitoring was conducted. Feature extraction and state classification on multiple recordings revealed focal changes consistent with the hypothesis, as well as progressively increased numbers of inactive electrodes with time awake. The implications of these findings on the study of sleep, and particularly local sleep, are discussed.
Drowsiness has been defined as the progressive loss of cortical processing efficiency that occurs with time passing while awake.1 The onset and progression of drowsiness is associated with a broad range of cognitive disturbances: slowed reaction times, reduced vigilance, and deficits in information processing including difficulties in integrating information and decreased accuracy of short-term memory.24 Behavioral changes in attention and short-term memory are accompanied by alterations in brain activation as detected on functional magnetic resonance imaging.57 A given cognitive function may decline, then return to baseline, then later decline again; the overall pattern remains one of widespread and progressive dysfunction. The precise mechanism(s) by which these cognitive declines take place has not been fully elucidated. However, part of the answer may lie in the realization that sleep is a much more intricate process than previously believed. Sleep-like states occur within cortical columns, and the likelihood that a given column will enter such a state is related to prior activity.810 Local sleep states can arise in larger areas or regions of cortex, or even involve one hemisphere at a time.11,12 The appearance is patchwork; localized wake-like states can be observed during whole-animal sleep8 and localized sleep-like states occur at times during whole-animal waking.13,14 The accumulation of sleep-regulatory substances, produced as a consequence of the normal metabolic activity of neural networks, appears to trigger the entry of cortical columns into local sleep.15 In the rat, this is reflected in islands of increased delta power on EEG appearing during wakefulness, concurrent with sharp drop-offs in multiunit activity.16
Studies examining drowsiness and sleep have generally focused on spectral power within a given frequency band rather than on correlations related to a specific frequency. In humans subjected to prolonged wakefulness, changes to scalp EEG in the form of increased theta power (5–7 Hz) have been seen, as well as increased spectral power in the delta band (0.5–4 Hz) during subsequent sleep.17,18 Scalp EEG analysis of the full sleep-wake cycle has demonstrated a negative correlation between theta power and self-rated alertness.18 The posterior dominant alpha frequency changes its morphology, spatial distribution, and frequency with varying levels of alertness.19 Clinical observation reveals a pattern of slowing of the alpha frequency with the onset of drowsiness, accompanied by an increase in amplitude.20 While much of the published work to date has focused on alpha oscillations having a negative correlation with local cortical excitability, the alpha phase and frequency appear to have a role in synchronization of cortical regions, particularly those involved in attention and executive processing.21,22 Regarding the assessment of local sleep while awake in humans, high-density scalp EEG recordings have shown localized experience-dependent increases in theta power regionally at roughly the lobar level.23 Studies using stereoelectroencephalography have revealed evidence of arousal-like activity in the hippocampus during non-REM sleep, the detection of hippocampal sleep spindles prior to their neocortical appearance, and islands of wake-like activity in primary motor cortex during sleep,2426 but to date, human evidence of local sleep while awake at the level of the local field potential using electrocorticography (ECoG) has not been demonstrated.
Given the visible slowing of the scalp-recorded alpha frequency with drowsiness,20 the postulated role of alpha frequency in governing attention and the hypothesis that drowsiness is the clinical manifestation of progressively increasing local sleep while awake, we hypothesized that combining features of focal regions with increased delta power and decreased alpha frequency might create a way to define areas of relative localized inactivity, as a surrogate marker for local sleep, during the wake state. More simply, the combination of the power within one frequency band and the specific frequency within another band might serve as a better descriptor of the cortical state than either alone. Given that the classic “Berger” bands are average ranges derived from decades of clinical experience, and using alpha as an example, the actual frequency in question commonly slows to less than 8 Hz during periods of drowsiness, we additionally examined (along with the classically defined separate beta, alpha, theta and delta bands) three combination bands of beta/alpha, alpha/theta and theta/delta. We further hypothesized that applying the Hilbert-Huang transform27 to the bandpass filtered signals (in order to derive both instantaneous amplitude and frequency) would enhance temporal resolution. We tested all band combinations of amplitude and frequency with a clustering algorithm comparing a period of clear sleep to one of clear wakefulness for the purpose of identifying the combination of the ECoG signals that provided the greatest separation between the two states, with the goal of creating a reliable signature of the active versus inactive state locally for each electrode.

Methods

Subjects

This study conformed to the Declaration of Helsinki. The protocol was approved by the institutional research board of the University of Texas Health Science Center at Houston (Institutional Review Board number, HSC-MS-15–0432). Recordings were obtained from adult (age >17 years old) patients suffering from medically refractory epilepsy undergoing intracranial monitoring prior to resective epilepsy surgery. All listed testing was completed within 6 months prior to the surgery, with the exception of the diseased hemisphere identity confirmed at the time of surgery. Subject characteristics are presented in Table 1.
TABLE 1. Descriptive Statistics for Study Participantsa
IDAgeGenderHandednessDis. Hemis.WadaPre NΨVIQPIQFSIQ
C45346MaleRightLeftNoYes9497N/A
C55321MaleRightLeftYesYes10696101
C54451MaleRightRightYesYes110116111
C53626FemaleRightLeftYesYes707270
C53938MaleRightRightNoYes105100103
C54126MaleRightLeftYesYes8510795
a
Abbreviations: Dis. Hemisphere: hemisphere identified as containing the seizure-onset zone; FSIQ: full-scale IQ; Pre NΨ: preresection neuropsychological testing; PIQ: performance IQ; VIQ: verbal IQ; Wada: intra-arterial amobarbital testing completed (yes/no).

ECoG Recording

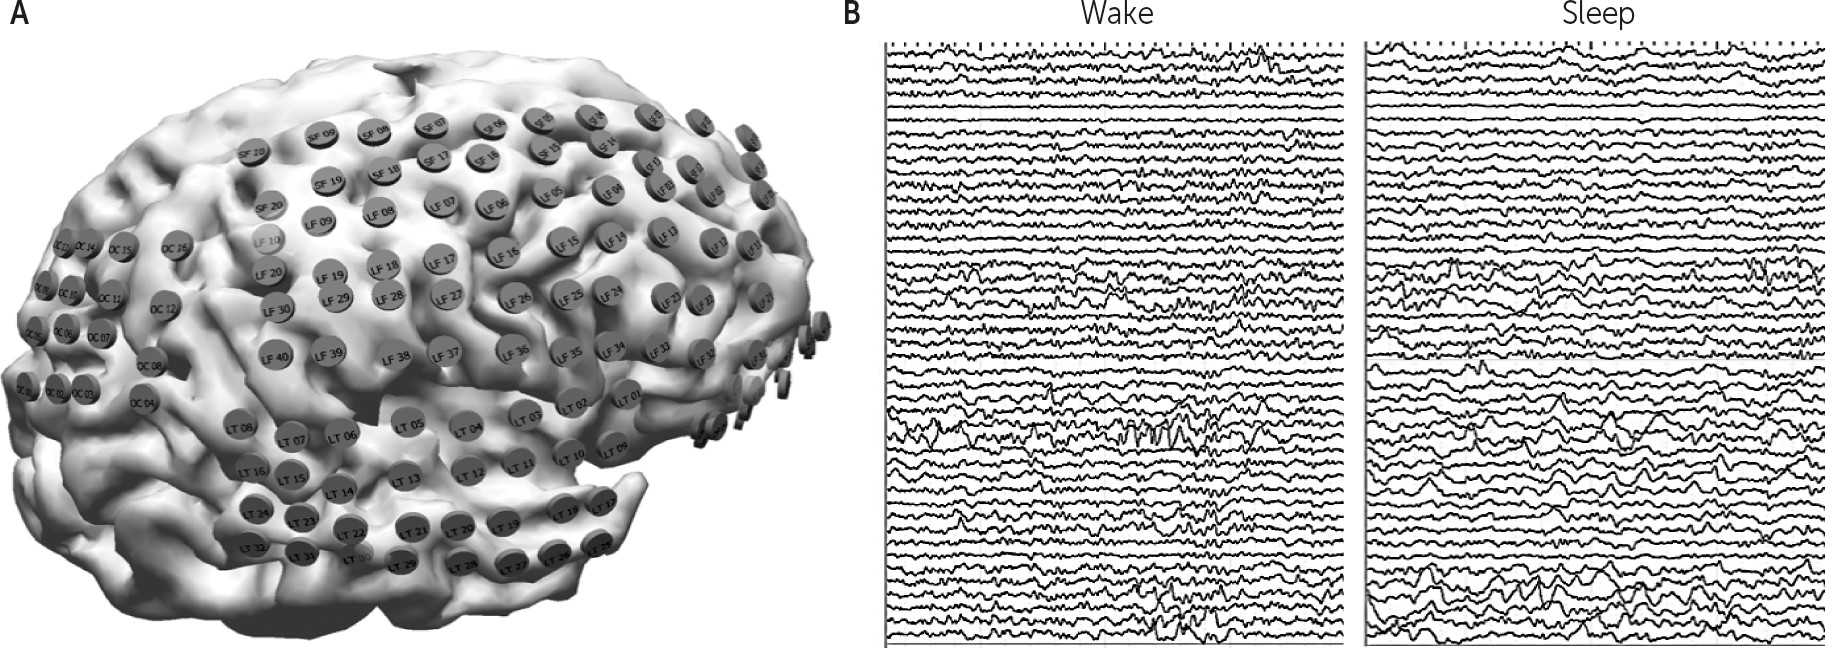
We searched for evidence of local sleep using human ECoG recordings, allowing the capture of neural activity from multiple human cortical areas simultaneously. We measured the activity as changes in local field potentials (LFPs) in six human patients. The study was performed as a retrospective analysis of ECoG data from epilepsy surgery patients at the Texas Comprehensive Epilepsy Program. Cortical coverage included lateral, frontal, orbito-frontal, lateral temporal, basal and mesial temporal regions (Figure 1A). The patients underwent semichronic implantation with arrays of subdural platinum-iridium electrodes (PMT Corp., Chanhassen, Minn.) with a top-hat design (4.5-mm diameter, 3-mm diameter contact with cortex) embedded in silastic sheets (10-mm center-to-center spacing) using standard neurosurgical techniques. Sets of electrodes forming rectilinear grids or strips were placed subdurally during craniotomy. Electrodes were placed as dictated by the clinical needs of the patient after an in-depth review of each patient’s case at a multidisciplinary epilepsy surgery patient management conference. Data were recorded using a reference electrode placed in an area remote to that of the suspected seizure onset zone. Patients subsequently underwent several days of continuous video-ECoG monitoring (Nihon Kohden, Inc., Foothills Ranch, Calif.; raw signal was prefiltered in the passband 0.3–300 Hz and sampled at 1,000 Hz for ECoG recording) with their antiepileptic medications reduced to enable recording of habitual seizures. After recordings were completed, the analyses were performed using an average reference. To assess the impact of the choice of reference, the analyses were also performed using a single reference electrode selected to be remote from the seizure onset zone; this resulted in only minimal changes to the classifications. The raw ECoG data (Figure 1B) were analyzed at the single electrode level. We used 12 short recordings (1 hour–1.5 hours) from six subjects, with six recordings having only the wake state and six recordings having both the wake and sleep states. Additionally, we used six long recordings of 24 hours from four subjects. Electrodes with active interictal spiking were excluded from analysis (ranging from 6 to 10 electrodes per patient). Recording days during which seizures occurred were excluded from analysis. A human observer reviewed the video portion of each sample to identify a 1-hour section during the day when the patient was behaviorally clearly awake (morning circadian peak) and 1 hour at night after sleep onset when the patient clearly was and remained asleep. The sleep samples were chosen at time points prior to 80 minutes after sleep onset to attempt to limit the recordings to periods of non-REM sleep. When available, concurrent scalp EEG recordings were also reviewed for consistency with non-REM sleep. These 1-hour samples served as the baseline exemplar recordings (individual to each patient), from which the salient features associated with sleep and wake were derived. Except where otherwise specified, the data from each subject were analyzed independently of the other subjects. As this was a retrospective analysis, scalp recorded EEG and EMG data were not available so that formal sleep staging could not be performed. Due to fall precautions, patients undergoing invasive monitoring prior to surgical resection spent the majority of time sitting or lying down, and the videos with these recordings were reviewed to document significant changes in the behavioral state over time.
FIGURE 1. Electrocorticography Acquisitiona
a The images show (A) display of reconstructed subdural grid electrode locations over the right hemisphere cortical surface and (B) samples of raw wake and sleep ECoG data (4 seconds in each data window).

Studying the Change of Instantaneous Amplitude and Frequency With Wake and Sleep States

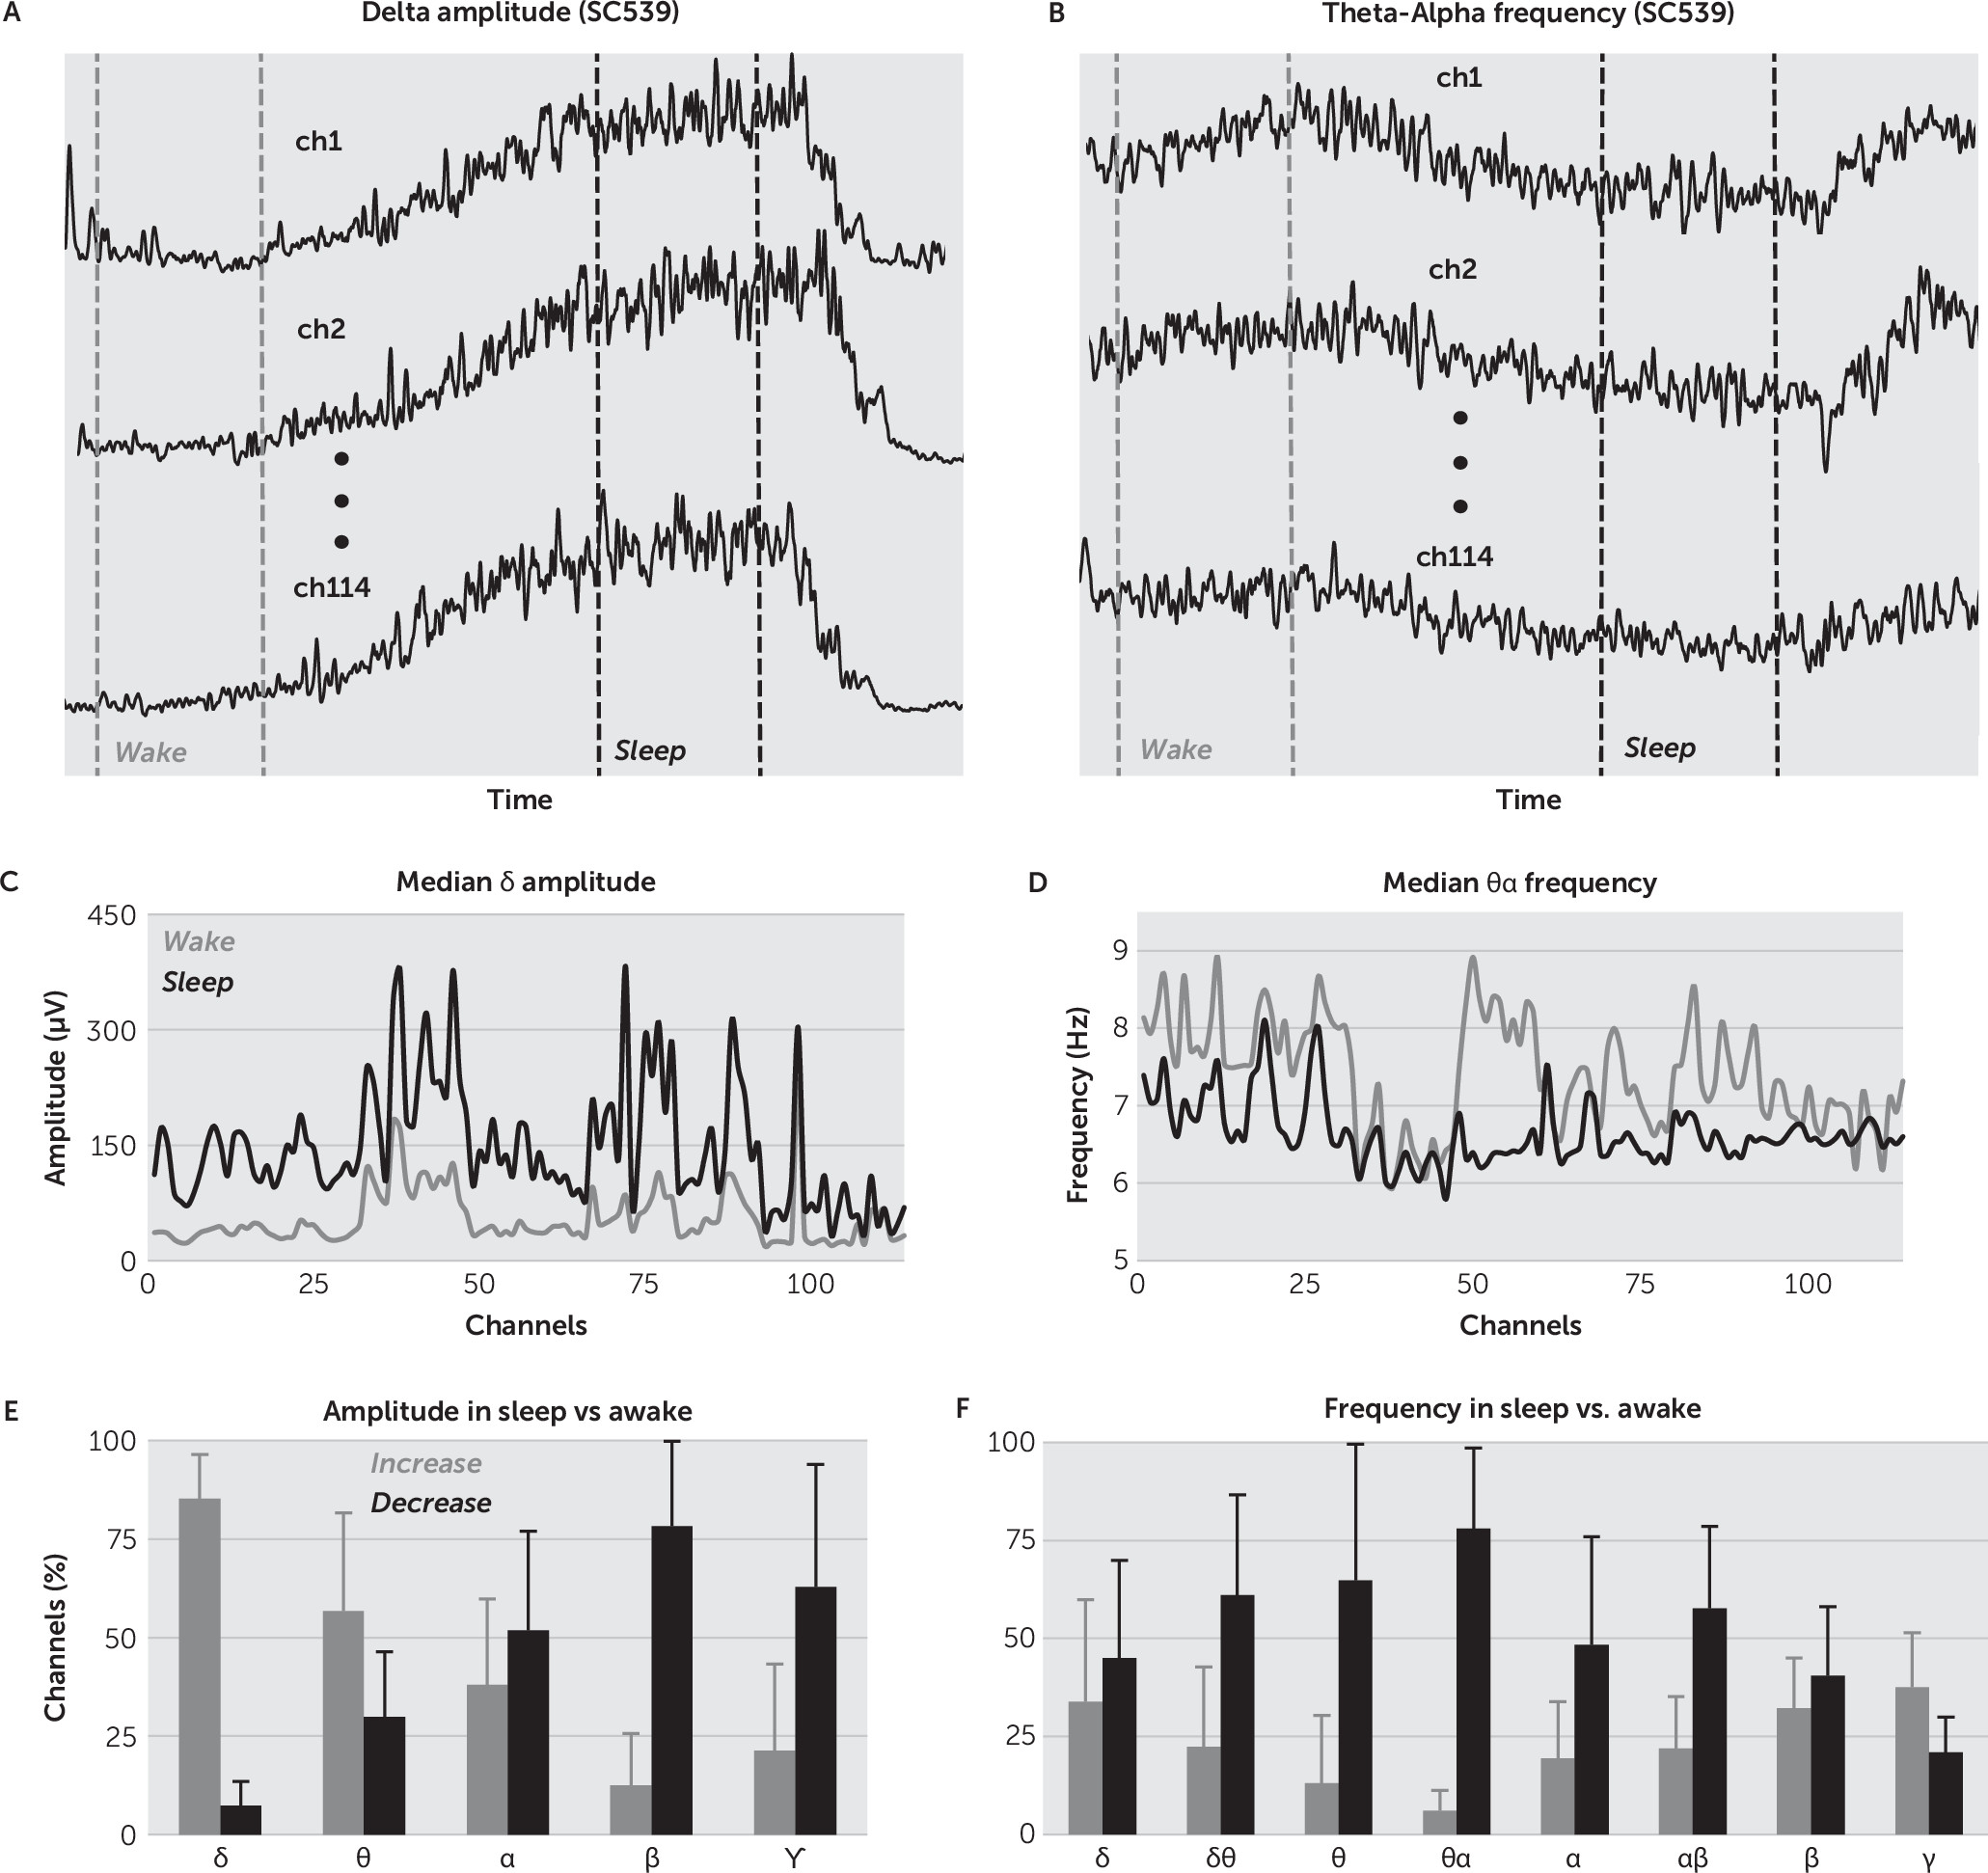
The instantaneous amplitude (IA) of a signal x(n) is the modulus of the corresponding analytical signal z(n)=x(n)+jHT[x(n)], where HT is the Hilbert transform.28 IA is the positive envelope of the signal. The instantaneous frequency (IF) is the time derivative of the phase of analytical signal z(n), and it approximates the change with time of the signal x(n) frequency (for a short introduction of the IA and IF computation based on Hilbert transform, see the data supplement accompanying the online version of this article). We examined the change in IA and IF during wake and sleep states across EEG frequency bands defined as: δ: 0–4; δθ: 0–8; θ: 4–8; α: 8–14; θα: 4–14; β: 14–30; θβ:8–30; ϒ: 30–80, and βϒ:14–80 Hz. We used short records from six subjects containing both wake and non-REM sleep intervals. For each record, we selected 10 pairs of wake and sleep intervals of 500 seconds each. For each pair of wake and sleep intervals, we filtered the recorded ECoG signal into EEG bands with digital recursive elliptical filters28 (see the online data supplement for the filters’ design). Next, for all EEG bands and channels, we computed IA and IF of the filtered signals (Figure 2A2B). Finally, for each pair of wake and sleep intervals, and for each band, we made comparisons for all channels with rank-sum tests between the IA in wake and the IA in sleep, as well as between the IF in wake and the IF in sleep.29 Then, for each band, we used a Holm-Bonferroni correction30 to determine the threshold of significance for the results of the multiple rank-sum tests and computed the percentage of electrodes showing a significant increase/decrease in IA and IF in sleep versus wake state in that frequency band. The mean of the percentage changes in IA and IF, respectively, for 60 wake and sleep intervals selected from six subjects is shown in Figure 2. The IA in δ band (δIA) showed the highest increase from wake to sleep, while the IF in θα band (θαIF) showed the highest decrease from wake to sleep. These two features (δIA and θαIF) were subsequently used for determining the active/inactive state at the channel level.
FIGURE 2. Instantaneous Amplitude and Frequency in Wake and Sleepa
a (A) Comparison of δ instantaneous amplitude (δIA) and (B) comparison of instantaneous theta-alpha frequency (θαIF) in wake (light gray) and sleep (black) intervals, for the channels of subject C539. δIA increased, while θαIF decreased in sleep versus wake. Median of δIA (C) and the median of θαIF (D), on all channels of subject C539, computed during a wake (light gray) and a sleep (black) interval. (E) Mean percentage of channels showing significant increase (light gray) and decrease (black) of their IA in sleep versus wake intervals. For all subjects, we found the highest percentage of channels showing increased amplitude during sleep in δ band (0–4 Hz). (F) For all subjects, the percentage of channels showing significant decrease in the median IF during sleep was highest in the θα band (4–14 Hz). Error bars are standard deviations.

Discriminating Active and Inactive State of Channels

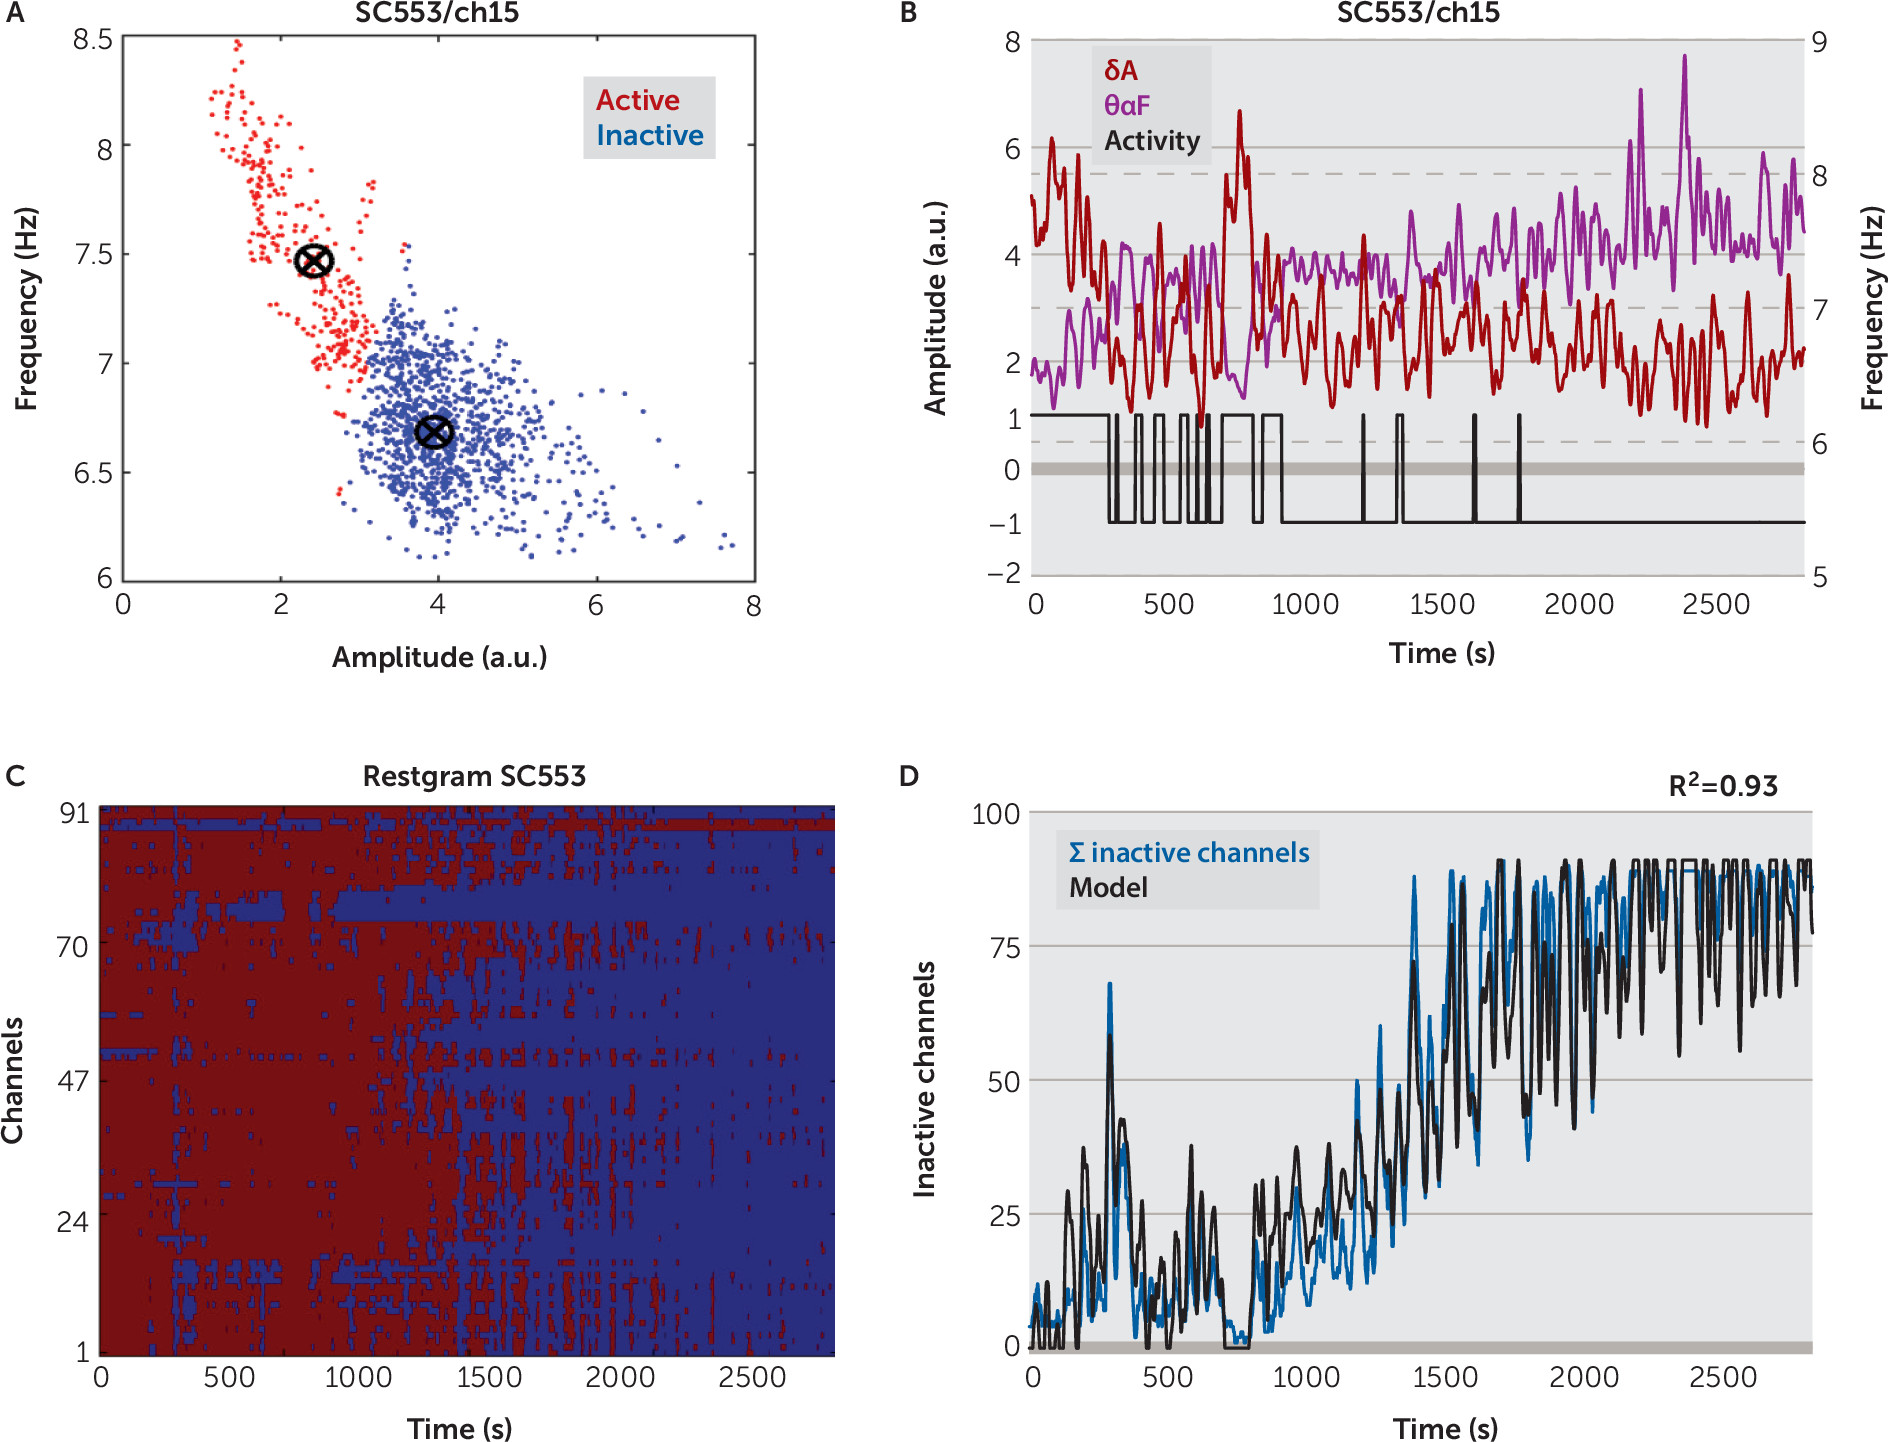
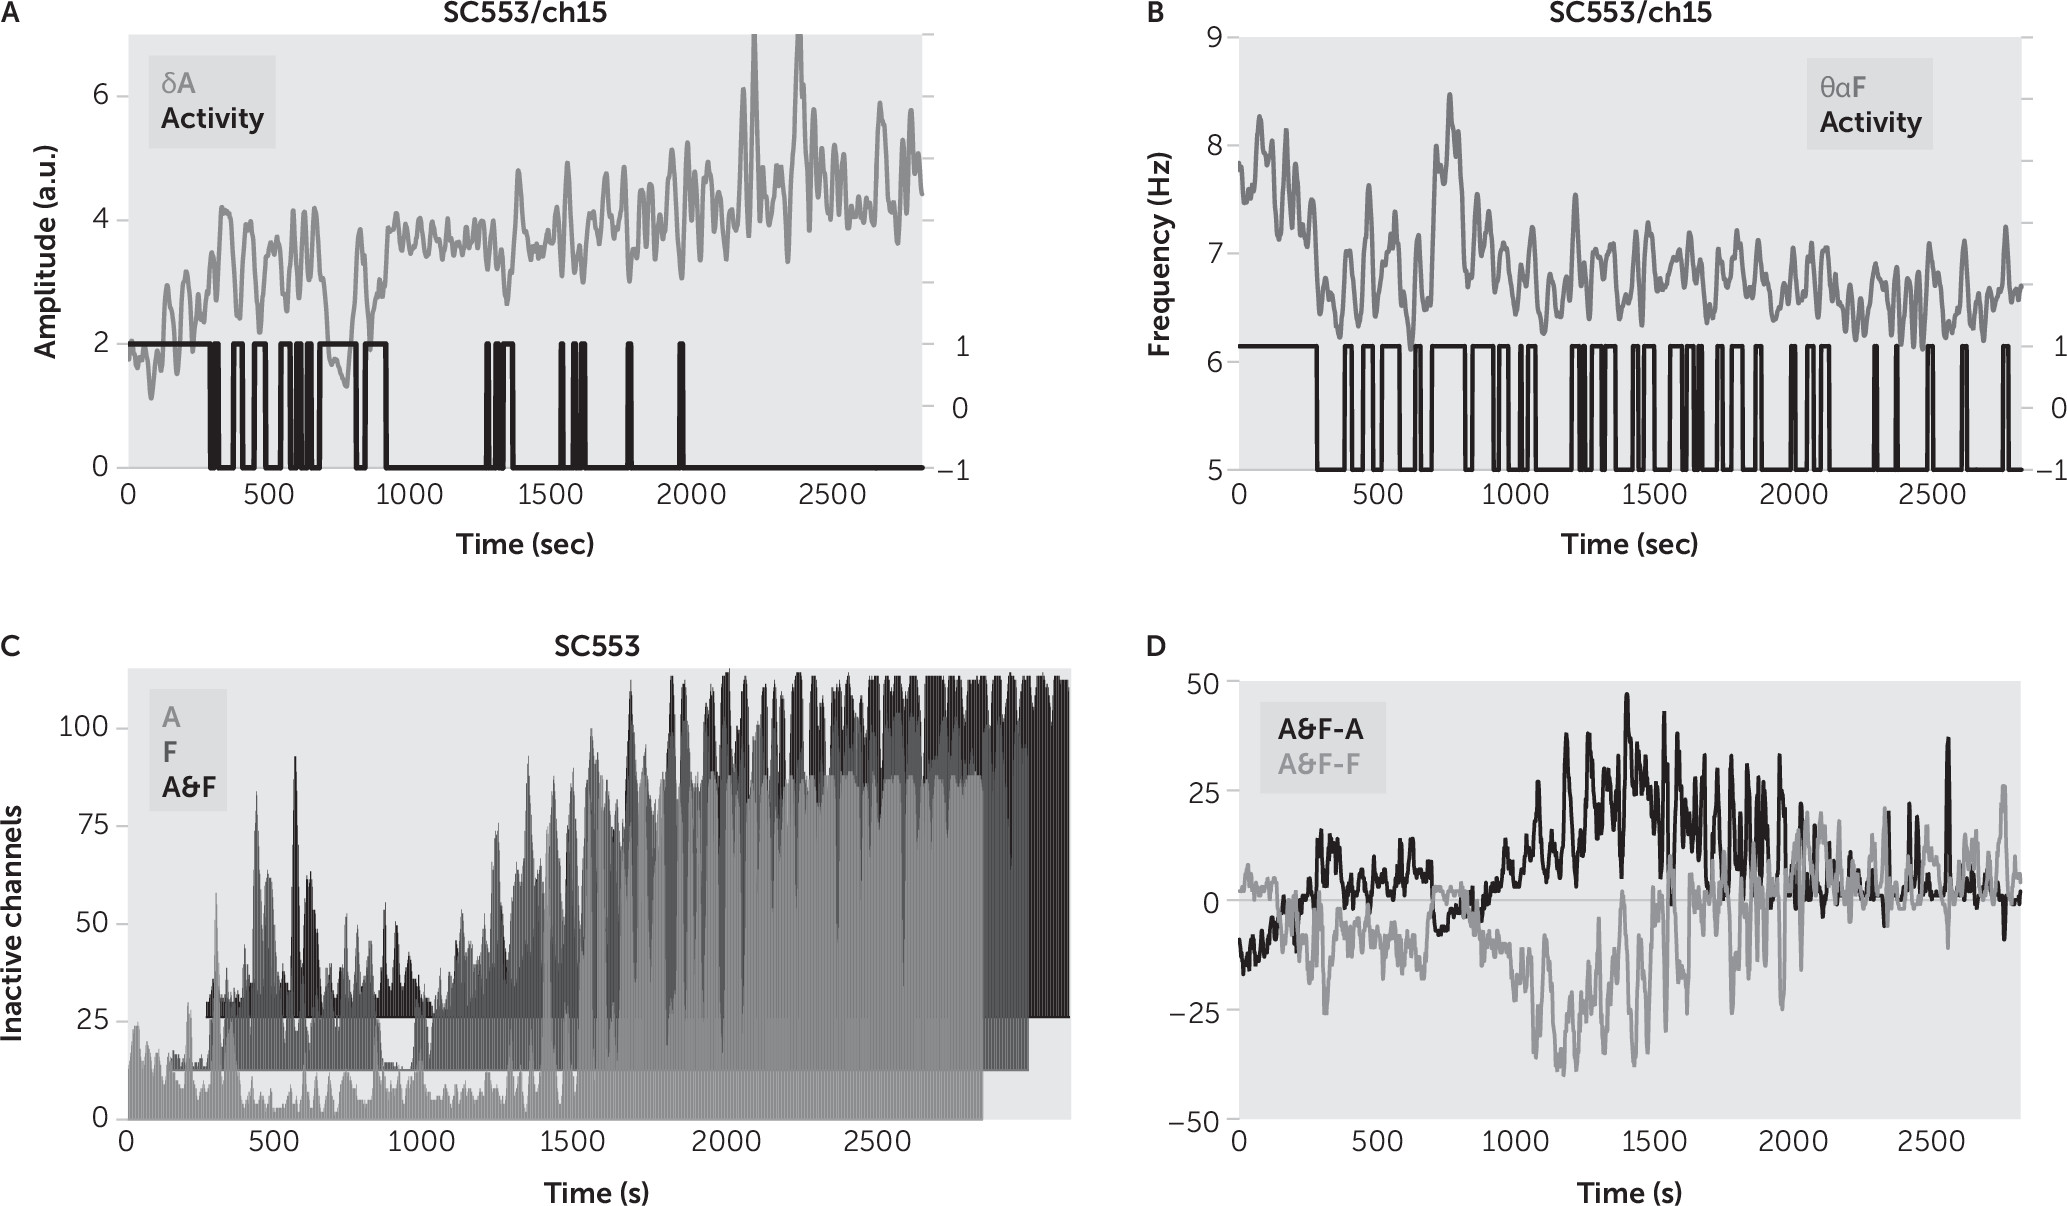
We determined the active (wake) and inactive (sleep) state of channels (electrodes) by using a clustering procedure based on the k-means algorithm (Lloyd’s algorithm). The k-means clustering aims to partition N observations into K clusters in which each observation belongs to the cluster with the nearest mean. In our case, the observations represented all the pairs of smoothed, normalized IA in δ band (0–4Hz), denoted with δA, and smoothed IF in θα band (4–14 Hz), denoted by θαF, computed from the whole channel record (see the online data supplement for details about the computation of δA and θαF). Thus, for each channel we clustered, with k-means, N observations (δA(n), θαF(n)), N=1,2,.,N, computed from the channel record, into two clusters (K=2) for both the active and inactive states (Figure 3A). Lower amplitudes and higher frequencies characterized the active cluster. The cluster containing higher amplitudes and lower frequencies corresponded to inactive state. After clustering, we determined the state of the channel for every time moment as being inactive or active depending on the belonging of corresponding (amplitude, frequency) pair to the inactive or active cluster (binary wake sequence in Figure 3B, 1 for active, –1 for inactive). We also discriminated the active/inactive channel state by using one-dimensional k-means clustering for amplitude (Figure 4A) and for frequency (Figure 4B). We denoted by ΣIC(n) the sum (count) of inactive channels at the moment n (ΣIC(n) ≤M, M number of channels), obtained after the k-means clustering of channels based on δA and θαF (see Figure 3, Figure 5). The ΣIC was computed as often as δA and θαF: every 2 seconds for short records (around 1–2 hours long) and every 10 seconds for 24-hour long records.
FIGURE 3. Detection of Inactive Channelsa
a (A) Distribution of the sorted pairs (δA, θαF) for the channel 48 of subject C553. The pairs were clustered with k-means in two states active (red) and inactive (blue). Active states were characterized by low amplitudes and high frequencies, while the inactive states were characterized by high amplitudes and low frequencies. (B) Every 2 seconds, the state of activity (black line; active=1, inactive=−1, plotted on the amplitude axis) was judged by computing the distance of the corresponding pair (δA [purple], θαF [dark red]) to the active/inactive centroids in (A). For high δA and low θαF, the channel was in inactive state. (C) Restgram of subject C553: the two-state sequences of all channels are grouped together in one matrix. Each column represents the state, active (red) or inactive (blue), of all the channels at a certain time moment. (D) A high percentage of the variability of the sum of inactive channels (blue) can be explained by using a regression model (black) based on the average amplitude and frequency on all channels.
FIGURE 4. Channel Sleep Detection Based on Instantaneous Amplitude or Instantaneous Frequencya
a (A) Sleep detection, in channel 48, subject C553, based on k-means clustering of smoothed, normalized IA in δ band (δA, light gray line). For low δA, the channel is in the active state, while for high δA, the channel is in the inactive state (activity, black line, active=1; inactive=−1, plotted on secondary vertical axis in both [A] and [B]). (B) Sleep detection in the same channel based on k-means clustering of smoothed IF in θα band (θαF, dark gray line). For high θαF, the channel is in the active state, while for low θαF, the channel is in the inactive state. (C) Sum of inactive channels for subject #10 computed with channel sleep detection based on δA (A, light gray line), on θαF (F, dark gray line), and on both amplitude and frequency (A&F, black line). (D) In active state, the sum of inactive channels was underestimated for amplitude sleep detection, A<A&F (A&F–A, black line), and overestimated for frequency sleep detection, F>A&F (A&F–F, gray line).
FIGURE 5. Detection of Inactive Channels for 24-Hour Long Recordsa
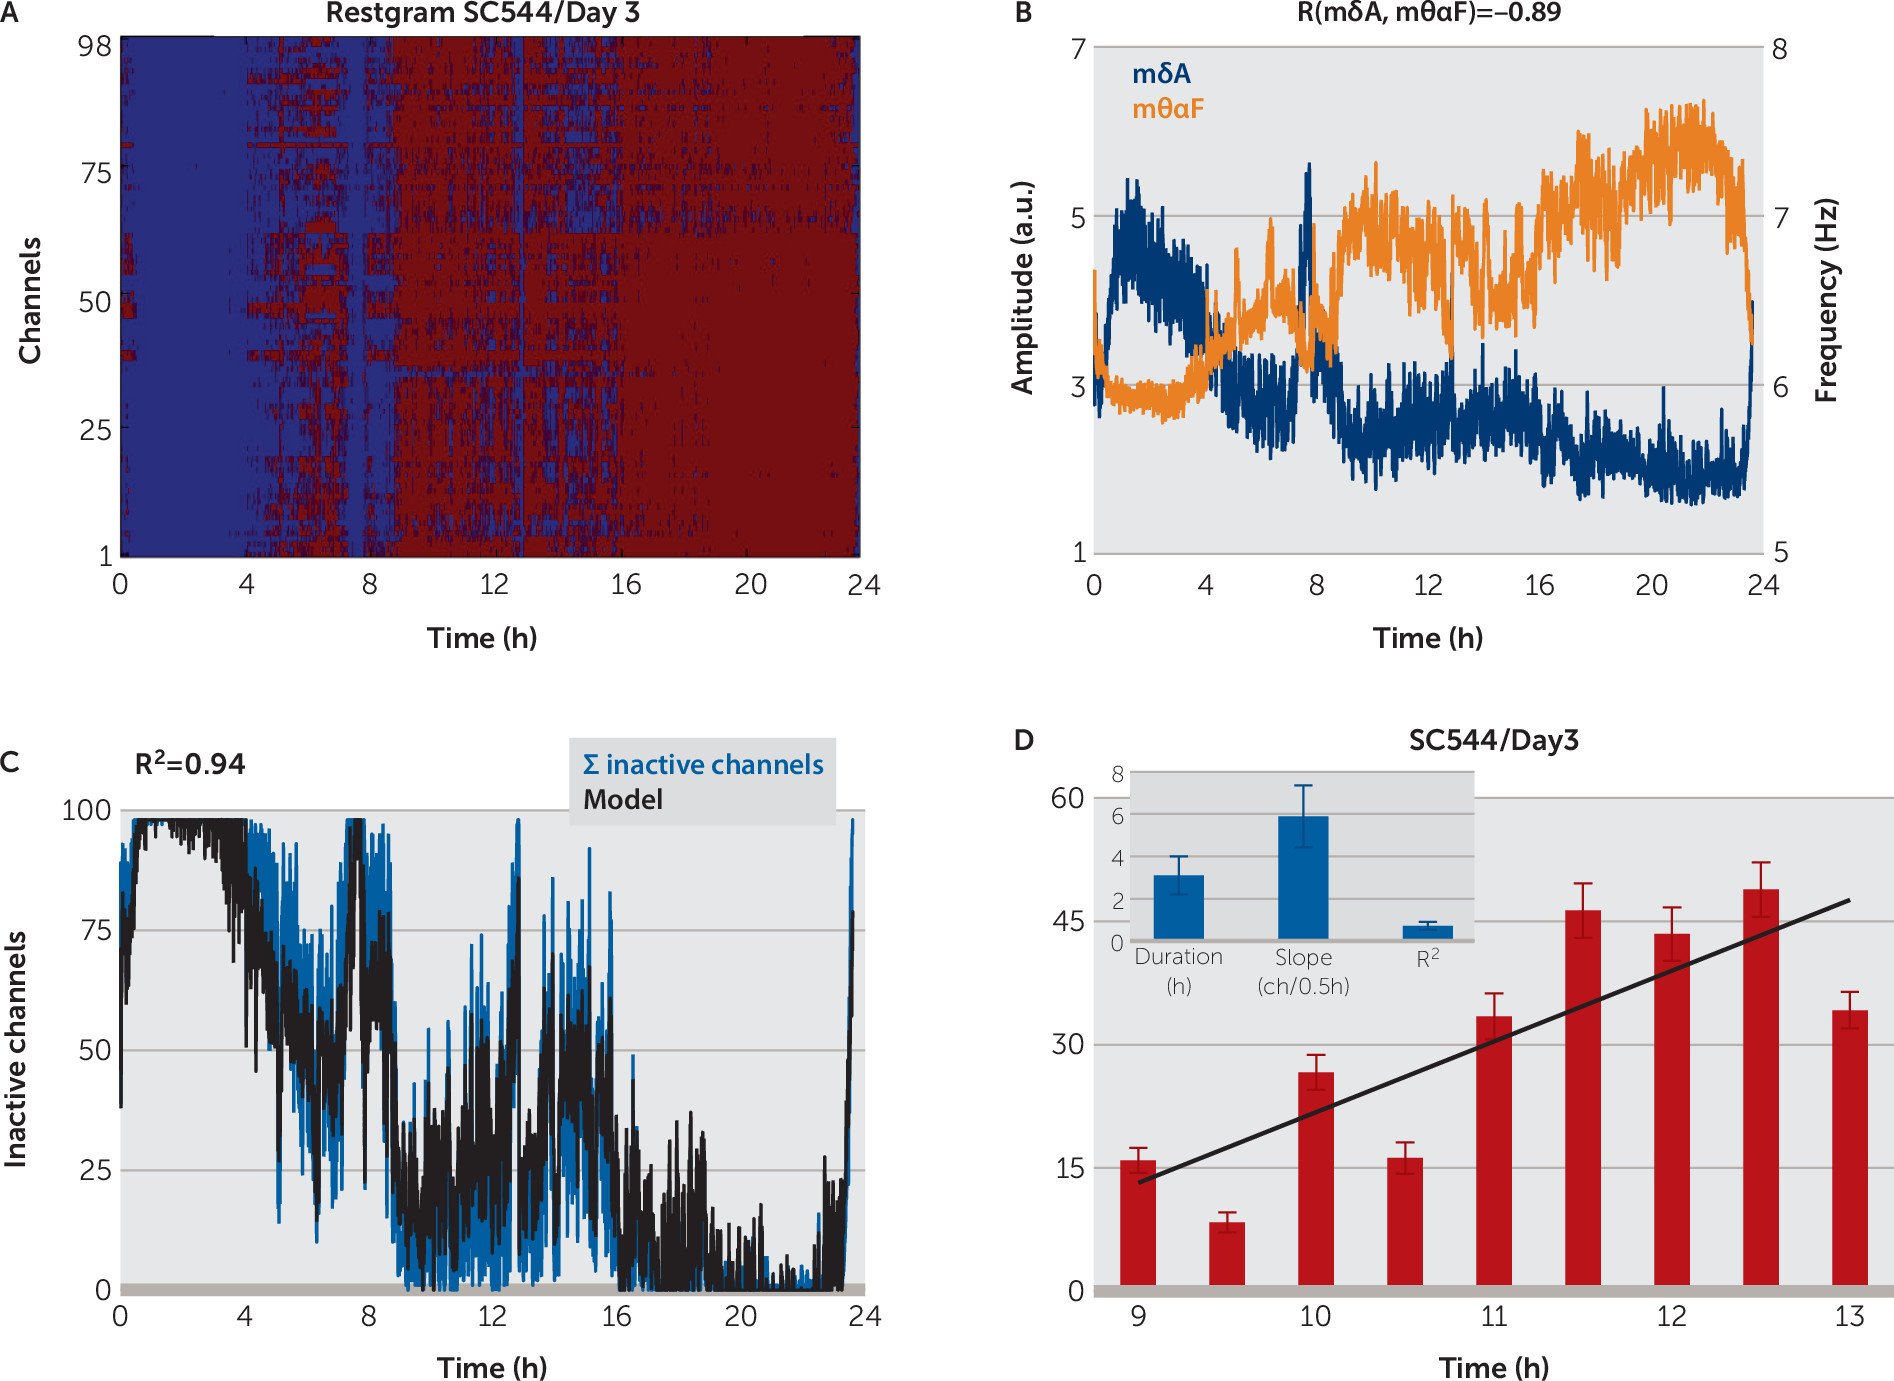
a (A) Restgram of subject C544 in day 3. Every column shows the states of all the subject channels, active (red) or inactive (blue), computed for every 10 seconds. (B) The average across channels of normalized, smoothed amplitude (mδA, dark blue) and frequency (mθαF, dark orange) are strongly negatively correlated: when the amplitude increases, the frequency decreases (during sleep), and when the amplitude decreases, the frequency increases (during wake). (C) A regression model (black line), based on mδA and mθαF, explains a high percentage of the variability of the sum of inactive channels (ΣIC, blue line) (e.g., shortly before midnight, when the subject fell asleep, the ΣIC increased abruptly followed by the model output) (D) For long periods of wake, we observed a steady increase in the number of inactive channels with time. (D inset) Mean duration of wake intervals, mean slope of the linear regression model of ΣIC variation with time and mean R2 of the model. Error bars are SEM.

Modeling the Number of Inactive Channels With Linear Regression

We used the average across channels of normalized, smoothed IA in δ band, δA, as well as the average across channels of smoothed IF in θα band, θαF, to predict the number of inactive channels with a regression model. We denoted by mδA the average of δA across channels and with mθαF as the average of θαF across channels (Figure 5 [also see equations 9 and 10 in the online data supplement]). For each subject, we predicted the sum of inactive channels ΣIC as a function of averages across channels mδA and mθαF with a linear regression function:
where SRC(n) was the approximation of ΣIC at the moment n and bi (i=0,1,2,3) represented the linear regression coefficients, computed such that the mean square error between the SRC and ΣIC was minimized (Figure 3, Figure 5 [also see Figure S4C–S4D in the online data supplement]. We also predicted ΣIC by using only δA or only θαF. For these cases, ΣIC was the sum of inactive channels obtained after the k-means clustering of δA or θαF, respectively (Figure 4C).

Correlations Between Amplitude, Frequency, and Sum of Inactive Channels

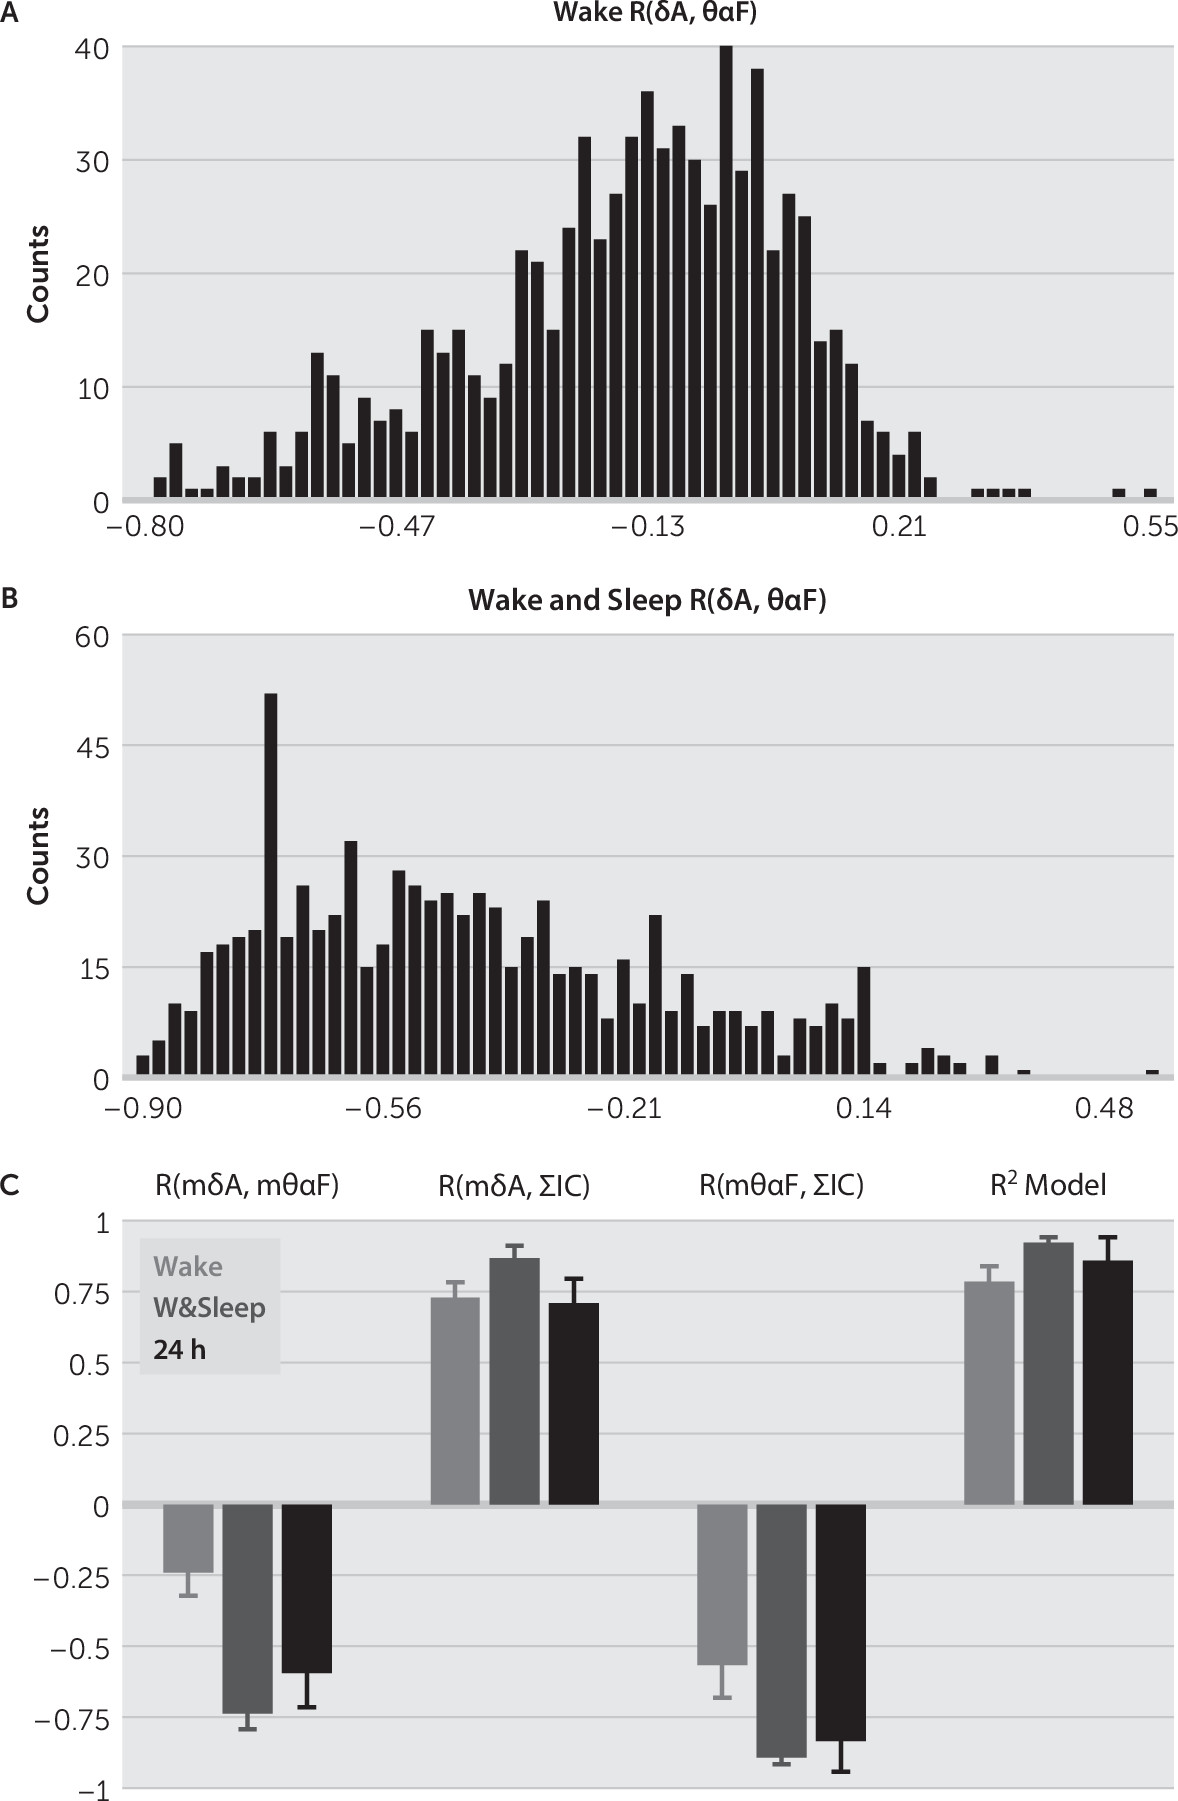
We studied the relationship between δA and θαF, as well as the relationship between the sum of the inactive channels ΣIC, mδA, and mθαF by using the Pearson correlation (also see the online data supplement). First, we computed the histograms of the Pearson correlations between the channels’ δA and θαF for records having only the wake state (Figure 6A), as well as for records having both wake and sleep states (Figure 6B). The wake and sleep intervals were selected from the short records of all the subjects by inspecting the video records. Then, for each subject we computed the Pearson correlation between the averages across channels mδA and mθαF, R(mδA,mθαF), between mδA and ΣIC, R(mδA,ΣIC), and between mθαF and ΣIC, R(mθαF,ΣIC) (Figure 6C).
FIGURE 6. Pearson Correlation Between δ Amplitude, θα Frequency, and Sum of Inactive Channelsa
a (A and B) Histogram of correlations in all recorded channels between δA and θαF for all records having only the wake state (A) and for all the records having both wake and sleep states (B). (C) Correlation between mδA and mθαF, R(mδA,mθαF), between mδA and sum of inactive channels ΣIC, R(mδA,ΣIC), and between mθαF and ΣIC, R(mθαF,ΣIC), for short records (order of hours) having only wake states (red), sleep and wake intervals (blue), and for 24-hour long records (black). R2 Model denotes the % of variability explained by modeling ΣIC with a regression model (see the article text). Error bars represent SEM.

Results

Instantaneous Amplitude in δ Band and Instantaneous Frequency in θα Band are the Most Salient Features for Active Versus Inactive State Determination

We used short records from six subjects containing wake and non-REM sleep intervals. Only one of the four patients had an additional limited montage of scalp electrodes placed. Review of the scalp electrode recordings confirmed sleep and wakefulness during the sections of the recording used as baseline wake and sleep. The presence or absence of REM sleep could not be assessed, but all the baseline sleep recordings were obtained within the first hour after clinical (video) sleep onset so that entry into REM sleep was unlikely. For each record, we selected 10 wake and 10 sleep intervals of 500 seconds each (Figure 2A2B) and compared the medians of corresponding IA and IF in all channels and EEG bands. Figure 2C2D illustrate the comparison in δ band for IA and θα band for IF, respectively. For each EEG band, and for each pair of wake and sleep intervals, we compared the IA in wake and IA in sleep, as well as the IF in wake and IF in sleep, in all channels by using rank-sum tests. We corrected the results of the multiple rank-sum tests with the Holm-Bonferroni method,30 and then we computed for each subject the percentage of electrodes (channels) showing a significant increase/decrease in IA and IF in sleep versus wake state, in each frequency band. In Figure 2E2F, we show the mean percentages for 60 pairs of wake and sleep intervals, selected from six subjects. We found the highest percentage of channels showing a significant increase of IA, sleep versus wake, in δ band (0–4 Hz) (Figure 2E). At the same time, we found the maximum percentage of channels showing a significant decrease of IF, sleep versus wake, in θα band (4–14 Hz) (Figure 2F). We concluded that the most salient features for inactive state determination were IA in δ band and IF in θα band.
It is widely accepted that the signal power in δ band can be related to the sleep state, and thus it could be used in sleep-state detection.17,18 Our analysis adds a new salient feature for the sleep detection: the IF in θα band. The normalized, smoothed IA in δ band, denoted with δA, and the smoothed IF in θα band, denoted with θαF, were negatively correlated during the sleep state (see Figure 6B [also see the Methods section]). Thus, during sleep, the increase in δA is accompanied by a decrease in θαF. Based on this observation, we developed a detection scheme for the sleep state (termed “inactive” when applied to an individual channel) that simultaneously uses δA and θαF.

Channel Classification for the Active Versus Inactive State

We estimated the active or inactive state of each channel (ECoG electrode) by clustering the δA and the θαF in two clusters corresponding to active and inactive states, respectively (see the Methods section). We used a k-means clustering algorithm having as inputs (δA(n), θαF(n)), computed for every 2 seconds, and in each subject separately identified two centroids corresponding to the active state (low amplitude, high frequency) and to the inactive state (high amplitude, low frequency), respectively. We assigned the state of the channel at the moment n as active or inactive depending on the shortest distance of the point (δA(n), θαF(n)) to the active or inactive centroids in the feature space (Figure 3A). Thus, for every 2 seconds, the classification determined the active or inactive state of each of the channels throughout the record (Figure 3B).
The sum of the inactive channels, denoted by ΣIC in the following, was interpreted as a measure of percentage of cortex in local sleep: during wake, ΣIC was significantly smaller than the number of recorded channels, while during sleep, ΣIC was close to the total number of channels. It is also possible to use only one feature like δA (Figure 4A), or θαF (Figure 4B), followed by one-dimensional k-means clustering to determine the state of the channel. However, we found that using only δA or only θαF led to a large underestimation or overestimation of ΣIC in comparison to using both δA and θαF (Figure 4D).

Restgrams

We included all of the active/inactive states in each of the channels in a restgram, defined as the matrix containing the variation of the subject channel states over time. The restgrams revealed evidence of inactive channels during wakefulness, consistent with the presence of local sleep. As an example, the restgram of subject C553 (Figure 3C) reveals local sleep: during wake period the majority of channels are active, but some are inactive. During sleep, the majority of channels are inactive, but some are active. Local sleep is also evident in the sum of inactive channels (ΣIC, blue line in Figure 3D). During wake (0–1,500 seconds), ΣIC had small positive values, showing that some channels are inactive. During sleep (t >1,500), ΣIC had higher values, but in most cases ΣIC < number of recorded channels, meaning that even in sleep some channels remained active.

Number of Inactive Channels Can be Predicted From the Average of δ Amplitude and θα Frequency Across Channels

As ΣIC might be a potentially important indicator of the global state of the brain, we approximated ΣIC with a linear regression function that used, as predictors, the average overall recorded channels of the δA and θαF denoted by mδA and mθαF, respectively (see equations 9 and 10 in the online data supplement). First, we determined the equation of the model by checking the interaction of mδA and mθαF with ΣIC, as well as the interaction between mδA and mθαF, in wake and sleep state (see Figure 6C). We found, in both wake and sleep, a high Pearson correlation between mδA and ΣIC, and between mθαF and ΣIC, (R(mδA,ΣIC) and R(mδA,ΣIC), respectively [Figure 6C]). We also found high negative correlations between mδA and mθαF (mean R(mδA,mθαF)=−0.74 [Figure 6C]) for the records having both wake and sleep states. This showed a clear interaction, at the level of the whole brain, between the IA in δ band and IF in θαF band: during sleep mδA increases while mθαF decreases. Given these high interactions, the regression model used as predictors mδA, mθαF, and their product mδA*mθαF (see equation 1 in the Methods section). For short records containing both wake and sleep states, the model (Figure 3D) explained a high percentage of the variability in ΣIC (R2=0.89 in Figure 3D, mean R2=0.92 in Figure 6C).

Number of Inactive Channels Increases During Long Wake Periods

We used 24-hour records from four subjects to study the variation of instantaneous amplitude and frequency for periods of prolonged wakefulness during the entire day. The δA and θαF were computed for every 10 seconds (see the Methods section) to detect the wake/sleep state of each channel through the same classification scheme, applied to the entire 24-hour record. The restgram from Figure 4A shows evidence of local sleep that coincided with the wake periods of the subject, extracted from video record examination. For all subjects, we found strong correlation between mδA, mθαF, and ΣIC (mean R(mδA,ΣIC)=0.7, mean R(mθαF,ΣIC)=–0.83 in Figure 6C), as well as between mδA and mθαF (R(mδA, mθαF)=−0.89 in Figure 5, mean R(mδA,mθαF)=−0.59 in Figure 7). Therefore, we approximated the sum of inactive channels with a regression model similar to the one used for short records (see equation 1 in the Methods section). The regression model for 24-hour records explained a high percentage of ΣIC variability (R2=0.89 in Figure 5, mean R2=0.86 in Figure 6C).
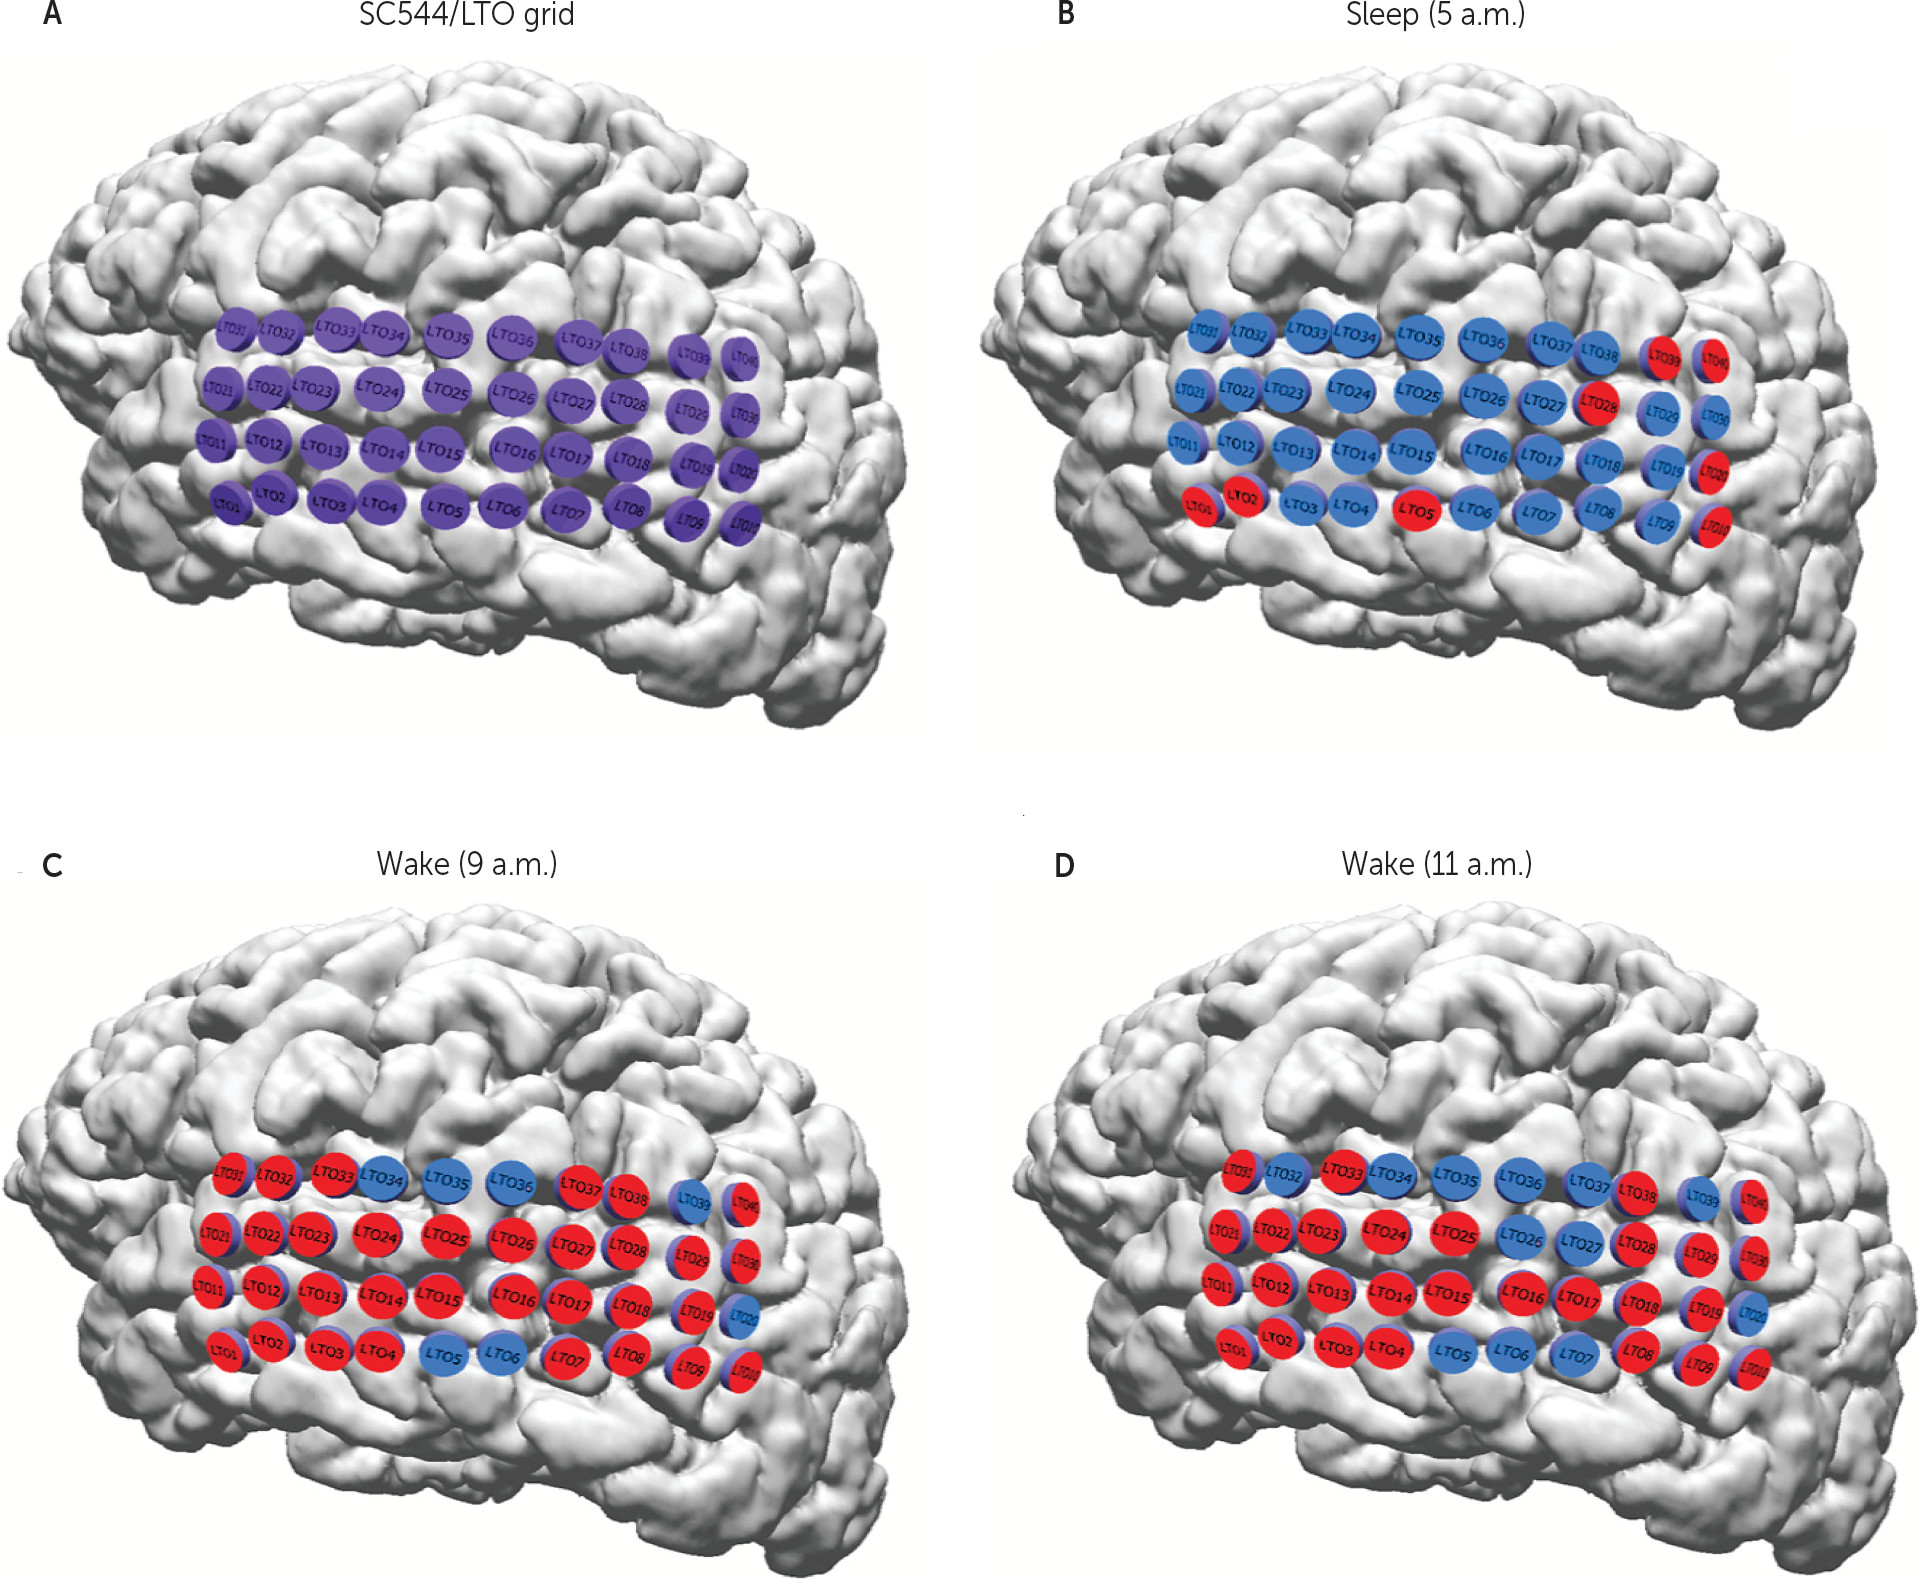
FIGURE 7. Example of Local Sleep in the LTO Grid of Subject C544a
a (A) LTO grid with 40 electrodes (magenta) (for the electrode localization, see Table S1 in the online data supplement). (B) At 5.00 a.m., when the subject was at sleep (according to the video recording), almost all of the channels (electrodes) were in inactive state (blue), but eight electrodes were in active state (red). (C) At 9:00 a.m., when the subject was awake having breakfast, most of the electrodes were active, but seven electrodes were inactive. (D) At 11:00 a.m., 2 hours later, the subject was still in the wake state, watching TV. The number of inactive electrodes increased to 12 (also see Figure 4D).
As we used only video inspection and not a polysomnographic system, for the majority of the patients, our sleep-state analysis served only for a crude determination of the wake/sleep state (e.g., we considered the subject at sleep when the video inspection showed the subject laid in bed with eyes closed) so that changes to the ECog metrics over the course of a night’s sleep could not be meaningfully interpreted. However, the video inspection allowed us to select, with acceptable approximation, long periods of time when the subjects were awake during the 24-hour record (e.g., mean duration 3.1 hours [Figure 5]). We observed a clear increase in ΣIC during these wake periods. Figure 5 shows the increase in ΣIC for subject 1 in day 3, between 9:00 a.m. and 1:00 p.m. By approximating the change in ΣIC with a regression model (ΣIC(t)≈a+b*t, mean R2=0.7 [Figure 5]), we found a consistent increase with time (b>0). By averaging the slopes b on all the selected wake intervals, we found an increase of eleven inactive channels per hour for wake intervals of approximately 3 hours long (Figure 5).
We illustrate the ΣIC increase with time in the wake state in Figure 7, where the activity of the lateral temporal occipital (LTO) grid of subject C544 (Figure 7A; also see Table S1 in the online data supplement) is shown at different time moments. When the subject was at sleep at 5:00 a.m., almost all the electrodes (channels) were inactive (Figure 7B). In a wake state, at 9:00 a.m., almost all of the channels were active, with only a few inactive channels (Figure 7B), while at 11:00 a.m., the number of inactive channels increased considerably (from 7 to 12 channels).

Discussion

The functional deficits that appear with prolonged wakefulness fluctuate in severity over time,6 and the effect on cognitive function is not uniform with respect to the type of function.31 Isolated areas of cortex episodically entering an inactive state during the overall awake state of the brain provide an explanation for this variability. To our knowledge, this is the first ECoG study in humans demonstrating evidence of local sleep-like changes during the wake state. Consistent with what has been demonstrated in animal models, we show a dynamic pattern of transitory focal resting states at the level of the local field potential.
It is widely accepted that a robust signature of the sleep state is the increase in δ band spectral power.17,18 In this study, we propose a broader set of signatures to track changes to ECoG with time awake (as a surrogate marker for drowsiness): the instantaneous amplitude in δ band and the instantaneous frequency in θα band. These features were selected after a thorough statistical analysis of the change in IA and IF in all the EEG bands. We found that the maximum percentage of channel increase in amplitude in sleep versus awake was in the δ band, and the maximum percentage of channel decrease in frequency was in the θα band (Figure 2E2F).
We used the normalized, smoothed δ band IA, δA, together with the smoothed IF in θα band, θαF, to classify the state of each channel as being active or inactive (Figure 3A3B). We assembled the results of all channels’ state classification in a matrix form, called restgram, which shows evidence of local sleep: during the wake intervals, established independently by analyzing the video records, the number of inactive channels was significantly smaller than during the sleep intervals, while during sleep most of the channels were inactive (Figure 3C, Figure 4A, also see Figure S4B in the online data supplement).
Sleep-state classification at the channel level allowed us to define a novel measure of local sleep: the sum (count) of the inactive channel, ΣIC, computed for every 2 seconds (or 10 seconds for 24-hour records). Correlation analysis revealed that ΣIC, the average across channels of normalized, smoothed IA in δ band (mδA), and the average across channels of smoothed IF in θα band (mθαF), were pairwise strongly correlated (Figure 6C). Due to these correlations, we were able to approximate ΣIC with high accuracy by using only the global variables mδA and mθαF (Figure 3D, Figure 5, [also see Figure S4C–S4D in the online data supplement). After the model parameters were correctly determined in a session that includes a wake and a sleep interval, one could estimate the percentage of the cortex in a sleep state, at any given time, by using only two global variables, mδA and mθαF. Therefore, we have established a reliable metric corresponding to the percentage of channels in an inactive state. Whether this metric has a direct correspondence to the progressive performance degradations associated with drowsiness is the subject of ongoing study, but it cannot be concluded from the current work.
As an inspection, the analysis was rerun with a single feature like δA (Figure 4A), or θαF (Figure 4B), followed by one-dimensional k-means clustering, to determine the wake state of channels. There is no standard measure of local sleep, and thus we could not objectively establish whether it was better to use both features (δA together with θαF) than using only one of them for channel sleep detection. We reasoned that because δA and θαF were strongly correlated during sleep (Figure 6B), we would have a more robust classification when using both features (e.g., for the sleep state, we should have an increase in δA simultaneously with a decrease in θαF), than when using only one of them. We found that the sum of inactive channels was overestimated for amplitude sleep detection and underestimated for frequency sleep detection, in comparison with the proposed amplitude-frequency sleep detection (Figure 4C4D). Thus, we concluded that the proposed sleep detection gave less noisy results in comparison with sleep detection based on one feature.
A significant difference between this work and prior studies is the combination of instantaneous frequency and instantaneous amplitude. The two band combinations were analyzed specifically to allow tracking of the frequency in those instances where it might drift above or below the “official” limits of the Berger bane. Even in Hans Berger’s original description of the alpha frequency, the bandwidth he wrote of was 7.812–13.28 Hz, with a lower limit than is currently used.32 Our results are consistent with the idea that the frequency in the theta to alpha range has a direct relationship to the occurrence of local sleep—the high predictive value of a linear regression model for the number of electrodes in the sleep state suggests that generation of this frequency is directly dependent on the percentage of cortex in the wake state at any given time. Given the evidence for alpha phase dynamics modulating neuronal stimulus-response, stimulus-perception, and speed of processing (see22 for a review), the slowing of the alpha frequency into the theta range occurring with increasing drowsiness may provide an additional explanation for the development of functional deficits, particularly with respect to attention and executive function.
Limitations of the current study include the fact that it is a retrospective analysis. As such, formal behavioral or repetitive performance testing was not available to provide a clinical correlate to the measured percentage of local sleep. As sleep staging is not routinely performed in patients undergoing invasive monitoring prior to surgery, no consistent placement of scalp and electromyogram electrodes was made, preventing formal sleep staging. A weakness shared with almost every study involving human ECoG is that the patient population studied has medically refractory epilepsy. Given that refractory epilepsy is the only condition for which this type of long-term invasive monitoring is appropriate, this limitation is inescapable.
To address the limitations of the present study, a prospective study with formal sleep staging and repetitive behavioral analysis and performance testing is planned for the future. Greater numbers of subjects may allow for meaningful regional analysis of the spatial distribution of the inactive states.
The present study provides additional support for the concept of local sleep while awake, the first based on intracranial subdural grid recordings in humans. Rather than simply a global process imposed on the brain, sleep develops as a local process within the cortical column due to the accumulation of sleep regulatory substances.33 These appear as the consequence of normal neuronal network activity, and the greater the activity, the greater the likelihood of entering the sleep state.34 The present results are consistent with the clinically observed gradual decline in cognitive abilities that is irregular with respect to both spatial and temporal progression, commonly described as drowsiness.
Acknowledgments

The authors thank Dawnelle Schatte, for her helpful comments, and Delrick Sankar and Deena Prince, for their technical assistance. The authors also thank the patients, their families, and all the staff of Memorial Hermann Hospital.

Supplementary Material

File (appi.neuropsych.16060120.ds001.pdf)

References

1.
Slater JD: A definition of drowsiness: one purpose for sleep? Med Hypotheses 2008; 71:641–644
2.
Dinges DF, Kribbs N: Sleep, sleepiness, and performance, in Wiley Series in Human Performance and Cognition. Edited by Monk TH. Chichester, New York, Wiley, 1991
3.
Dinges DF, Pack F, Williams K, et al: Cumulative sleepiness, mood disturbance, and psychomotor vigilance performance decrements during a week of sleep restricted to 4-5 hours per night. Sleep 1997; 20:267–277
4.
Durmer JS, Dinges DF: Neurocognitive consequences of sleep deprivation. Semin Neurol 2005; 25:117–129
5.
Chee MW, Chuah LY, Venkatraman V, et al: Functional imaging of working memory following normal sleep and after 24 and 35 h of sleep deprivation: correlations of fronto-parietal activation with performance. Neuroimage 2006; 31:419–428
6.
Chee MW, Tan JC, Zheng H, et al: Lapsing during sleep deprivation is associated with distributed changes in brain activation. J Neurosci 2008; 28:5519–5528
7.
Chee MW, Goh CS, Namburi P, et al: Effects of sleep deprivation on cortical activation during directed attention in the absence and presence of visual stimuli. Neuroimage 2011; 58:595–604
8.
Rector DM, Topchiy IA, Carter KM, et al: Local functional state differences between rat cortical columns. Brain Res 2005; 1047:45–55
9.
Krueger JM, Rector DM, Roy S, et al: Sleep as a fundamental property of neuronal assemblies. Nat Rev Neurosci 2008; 9:910–919
10.
Rector DM, Schei JL, Van Dongen HP, et al: Physiological markers of local sleep. Eur J Neurosci 2009; 29:1771–1778
11.
Krueger JM, Huang YH, Rector DM, et al: Sleep: a synchrony of cell activity-driven small network states. Eur J Neurosci 2013; 38:2199–2209
12.
Mukhametov LM, Supin AY, Polyakova IG: Interhemispheric asymmetry of the electroencephalographic sleep patterns in dolphins. Brain Res 1977; 134:581–584
13.
Destexhe A, Contreras D, Steriade M: Spatiotemporal analysis of local field potentials and unit discharges in cat cerebral cortex during natural wake and sleep states. J Neurosci 1999; 19:4595–4608
14.
Pigarev IN, Nothdurft HC, Kastner S: Evidence for asynchronous development of sleep in cortical areas. Neuroreport 1997; 8:2557–2560
15.
Clinton JM, Davis CJ, Zielinski MR, et al: Biochemical regulation of sleep and sleep biomarkers. J Clin Sleep Med 2011; 7(5 Suppl):S38–S42
16.
Vyazovskiy VV, Olcese U, Hanlon EC, et al: Local sleep in awake rats. Nature 2011; 472:443–447
17.
Borbély AA, Achermann P: Sleep homeostasis and models of sleep regulation. J Biol Rhythms 1999; 14:557–568
18.
Finelli LA, Baumann H, Borbély AA, et al: Dual electroencephalogram markers of human sleep homeostasis: correlation between theta activity in waking and slow-wave activity in sleep. Neuroscience 2000; 101:523–529
19.
Santamaria J, Chiappa KH: The EEG of drowsiness in normal adults. J Clin Neurophysiol 1987; 4(4):327–382
20.
Erwin CW, Somerville ER, Radtke RA: A review of electroencephalographic features of normal sleep. J Clin Neurophysiol 1984; 1:253–274
21.
Palva S, Palva JM: New vistas for alpha-frequency band oscillations. Trends Neurosci 2007; 30:150–158
22.
Palva S, Palva JM: Functional roles of alpha-band phase synchronization in local and large-scale cortical networks. Front Psychol 2011; 2:204
23.
Hung CS, Sarasso S, Ferrarelli F, et al: Local experience-dependent changes in the wake EEG after prolonged wakefulness. Sleep 2013; 36:59–72
24.
Moroni F, Nobili L, De Carli F, et al: Slow EEG rhythms and inter-hemispheric synchronization across sleep and wakefulness in the human hippocampus. Neuroimage 2012; 60:497–504
25.
Nobili L, Ferrara M, Moroni F, et al: Dissociated wake-like and sleep-like electro-cortical activity during sleep. Neuroimage 2011; 58:612–619
26.
Moroni F, Nobili L, Curcio G, et al: Sleep in the human hippocampus: a stereo-EEG study. PLoS One 2007; 2:e867
27.
Huang NE, Shen Z, Long SR, et al: The empirical mode decomposition and the Hilbert spectrum for nonlinear and non-stationary time series analysis. Proceedings of the Royal Society of London A: Mathematical, Physical and Engineering Sciences. 1998; 454(1971):903–995
28.
Oppenheim AV, Schafer RW, Buck JR: Discrete-Time Signal Processing, 2nd ed. Upper Saddle River, NJ, Prentice Hall, 1999
29.
Gibbons JD, Chakraborty S: Nonparametric Statistical Inference, 5th ed. Boca Raton, Fla, Chapman & Hall/CRC Press, Taylor & Francis Group, 2011
30.
Holm S: A simple sequentially rejective multiple test procedure. Scand J Stat 1979; 6:65–70
31.
Lim J, Dinges DF: Sleep deprivation and vigilant attention. Ann N Y Acad Sci 2008; 1129:305–322
32.
Berger H: Über das Elektrenkephalogram des Menschen. Arch Psychiatr Nervenkr 1929; 87:527–570
33.
Vyazovskiy VV, Harris KD: Sleep and the single neuron: the role of global slow oscillations in individual cell rest. Nat Rev Neurosci 2013; 14:443–451
34.
Krueger JM, Tononi G: Local use-dependent sleep; synthesis of the new paradigm. Curr Top Med Chem 2011; 11:2490–2492

Information & Authors

Information

Published In

Go to The Journal of Neuropsychiatry and Clinical Neurosciences
The Journal of Neuropsychiatry and Clinical Neurosciences
Pages: 236 - 247
PubMed: 28121257

History

Received: 17 June 2016
Revision received: 7 September 2016
Accepted: 21 September 2016
Published online: 25 January 2017
Published in print: Summer 2017

Keywords

  1. Biological Rhythms
  2. Neurophysiology
  3. Research Design and Methodology
  4. Sleep

Authors

Details

Jeremy D. Slater, M.D. [email protected]
From the Department of Neurology, University of Texas Medical School at Houston, Houston, Tex. (JDS, GK); the Department of Neurobiology and Anatomy, University of Texas Medical School at Houston, Houston, Tex. (JDS, MIC, BJH, CB, VD); Department of In Vivo Pharmacology, Merck Research Laboratories, West Point, Penn. (BJH); and the Vivian L. Smith Department of Neurosurgery, University of Texas Medical School at Houston, Houston, Tex. (NT).
Mircea I. Chelaru, Ph.D.
From the Department of Neurology, University of Texas Medical School at Houston, Houston, Tex. (JDS, GK); the Department of Neurobiology and Anatomy, University of Texas Medical School at Houston, Houston, Tex. (JDS, MIC, BJH, CB, VD); Department of In Vivo Pharmacology, Merck Research Laboratories, West Point, Penn. (BJH); and the Vivian L. Smith Department of Neurosurgery, University of Texas Medical School at Houston, Houston, Tex. (NT).
Bryan J. Hansen, Ph.D.
From the Department of Neurology, University of Texas Medical School at Houston, Houston, Tex. (JDS, GK); the Department of Neurobiology and Anatomy, University of Texas Medical School at Houston, Houston, Tex. (JDS, MIC, BJH, CB, VD); Department of In Vivo Pharmacology, Merck Research Laboratories, West Point, Penn. (BJH); and the Vivian L. Smith Department of Neurosurgery, University of Texas Medical School at Houston, Houston, Tex. (NT).
Charles Beaman, B.Sc.
From the Department of Neurology, University of Texas Medical School at Houston, Houston, Tex. (JDS, GK); the Department of Neurobiology and Anatomy, University of Texas Medical School at Houston, Houston, Tex. (JDS, MIC, BJH, CB, VD); Department of In Vivo Pharmacology, Merck Research Laboratories, West Point, Penn. (BJH); and the Vivian L. Smith Department of Neurosurgery, University of Texas Medical School at Houston, Houston, Tex. (NT).
Giridhar Kalamangalam, M.D., D.Phil.
From the Department of Neurology, University of Texas Medical School at Houston, Houston, Tex. (JDS, GK); the Department of Neurobiology and Anatomy, University of Texas Medical School at Houston, Houston, Tex. (JDS, MIC, BJH, CB, VD); Department of In Vivo Pharmacology, Merck Research Laboratories, West Point, Penn. (BJH); and the Vivian L. Smith Department of Neurosurgery, University of Texas Medical School at Houston, Houston, Tex. (NT).
Nitin Tandon, M.D.
From the Department of Neurology, University of Texas Medical School at Houston, Houston, Tex. (JDS, GK); the Department of Neurobiology and Anatomy, University of Texas Medical School at Houston, Houston, Tex. (JDS, MIC, BJH, CB, VD); Department of In Vivo Pharmacology, Merck Research Laboratories, West Point, Penn. (BJH); and the Vivian L. Smith Department of Neurosurgery, University of Texas Medical School at Houston, Houston, Tex. (NT).
Valentin Dragoi, Ph.D.
From the Department of Neurology, University of Texas Medical School at Houston, Houston, Tex. (JDS, GK); the Department of Neurobiology and Anatomy, University of Texas Medical School at Houston, Houston, Tex. (JDS, MIC, BJH, CB, VD); Department of In Vivo Pharmacology, Merck Research Laboratories, West Point, Penn. (BJH); and the Vivian L. Smith Department of Neurosurgery, University of Texas Medical School at Houston, Houston, Tex. (NT).

Notes

Send correspondence to Dr. Slater; e-mail: [email protected]

Author Contributions

Drs. Slater and Chelaru contributed equally to this study.

Competing Interests

Dr. Slater receives research support from, serves as a consultant to, and serves on the speaker’s bureau for Lundbeck; he also receives research support from and serves on the speaker’s bureau for Cyberonics. All other authors report no financial relationships with commercial interests.

Funding Information

Supported by funding from the Kraft W. Eidman Development Board (to Dr. Slater), an NIH grant and Clinical and Translational Award from the National Center for Research Resources (to Dr. Tandon), the Vision Training Grant (to Dr. Beaman), and by grants from the National Institutes of Health EUREKA Program, Pew Scholars Program, and James S. McDonnell Foundation (to Dr. Dragoi).

Metrics & Citations

Metrics

Citations

Export Citations

If you have the appropriate software installed, you can download article citation data to the citation manager of your choice. Simply select your manager software from the list below and click Download.

For more information or tips please see 'Downloading to a citation manager' in the Help menu.

Format
Citation style
Style
Copy to clipboard

View Options

View options

PDF/EPUB

View PDF/EPUB

Login options

Already a subscriber? Access your subscription through your login credentials or your institution for full access to this article.

Personal login Institutional Login Open Athens login
Purchase Options

Purchase this article to access the full text.

PPV Articles - Journal of Neuropsychiatry and Clinical Neurosciences

PPV Articles - Journal of Neuropsychiatry and Clinical Neurosciences

Not a subscriber?

Subscribe Now / Learn More

PsychiatryOnline subscription options offer access to the DSM-5-TR® library, books, journals, CME, and patient resources. This all-in-one virtual library provides psychiatrists and mental health professionals with key resources for diagnosis, treatment, research, and professional development.

Need more help? PsychiatryOnline Customer Service may be reached by emailing [email protected] or by calling 800-368-5777 (in the U.S.) or 703-907-7322 (outside the U.S.).

Media

Figures

Other

Tables

Share

Share

Share article link

Share