On a global basis, alcohol misuse and its consequences, including alcohol use disorder (AUD), are leading causes of death and loss of disability‐adjusted life‐years in both sexes. In 2016, alcohol use was the largest risk factor for deaths in people aged 15–49 (
1). While the prevalence of AUD and heavy drinking in the U.S. males has changed relatively little in the past several years, both have increased dramatically in women (
2). Alcohol use and dependence also account for a vast demand for hospital resources, with over 1 million people hospitalized under diagnoses related to alcohol in 2010 (
3).
The psychotropic effects of alcohol encourage its use, and both directly and indirectly lead to morbidity and mortality. Psychotropic effects include euphoria, sedation, anxiolysis, and diminished motor and cognitive performance (
4). Clinical manifestations of excessive alcohol use and withdrawal include autonomic dysfunction, perceptual disturbances, blackouts (including both episodic amnesia and lapses in executive cognitive control), self‐harm, aggression directed against others, and seizures. These alcohol‐related events often necessitate emergency room visits and hospitalizations, with alcohol‐related emergency room visits increasing by 61% between 2006 and 2014 (
2).
Both in humans and in animal models, interindividual variation in alcohol responses is substantial and is partly heritable (
5); inbred rat and mice strains tested under similar conditions of rearing and exposure vary in alcohol responses such as sedation and withdrawal. Heritability of addictions has both substance‐specific and substance‐nonspecific components exemplified by polymorphisms in drug receptors and enzymes involved in metabolism, as well as shared heritability of addiction vulnerability, variation in reward, stress resiliency, and executive cognitive functioning (
6). Heritable variation in alcohol response has stimulated studies to identify genes responsible, as genes influencing alcohol response could also influence vulnerability to other addictions. Alcohol response phenotypes that have been artificially selected in rodent strains include sensitivity to sedation (e.g., the Short Sleep/Long Sleep mice) and withdrawal (e.g., Withdrawal Seizure Resistant/Seizure Prone mice). Additionally, High Response (HR)/Low Response (LR) rat lines have been developed as a model of arousal predictive of alcohol and drug liking (
7). The ability to artificially select response phenotypes in animals indicates that some differences in alcohol response are innate, with moderate heritability. In humans, twin studies on subjective response to ethanol indicate that sensitivity to the sedative effects of ethanol is moderately heritable (
8).
Pharmacogenomic studies of alcohol response have established that interindividual variation in responses is both pharmacokinetic in origin, as illustrated by
ADH1B and
ALDH2 variants that cause alcohol‐induced flushing (
6), and pharmacodynamic, as illustrated by lack of difference in alcohol metabolism to explain variation in alcohol‐induced sedation in humans (
9) and mice (
10). Overall, genetic sources of variability in response remain poorly understood, restricting insights into physiologic mechanisms, the extent to which these response phenotypes are independent or co‐determined, and relationships to other heritable phenotypes. Genome wide association studies (GWAS) of AUD have found no loci of large effect beyond single nucleotide polymorphisms at the alcohol dehydrogenases (
ADH) gene cluster and at the aldehyde dehydrogenase gene
ALDH2. Potentially, genes of large effect will be identified for other responses. For example, a recent study of novelty response in the HR rat, a strain selected for a phenotype predictive of addiction liability, found seven genome wide significant loci accounting for a third of the variance in that phenotype, and two thirds of the genetic variance (
7).
Both genotypic and phenotypic characterizations of alcohol responses are germane for uncovering predictors of clinical and behavioral outcomes in individuals with AUD or at risk. Previous research relating to clinical alcohol response characterization has focused on the relationship of response to alcohol consumption and AUD. Schuckit found that men around 20 years old who reported a lower response following oral alcohol challenge on subjective measures of alcohol effects, and who differed in objective measures such as body sway and cortisol, were more likely to develop AUD (
11), suggesting that a lower response to internal cues during alcohol consumption leads to excessive drinking (low level response theory). Newlin and Thompson (
12) added the insight that higher risk drinkers often experience greater stimulant effects along with lower sedation than lighter drinkers. King found that positive and negative effects of alcohol predicted alcohol behaviors and found that in heavy drinkers, peak “liking” and “wanting,” as well as lower sedation, predicted future drinking binges, worse consequences, and higher likelihood of AUD (
13).
In this study, we sought to identify common factors underlying alcohol responses using a large, deeply phenotyped clinical sample and factor analysis of 17 Alcohol Dependence Scale (ADS) items. The ADS was derived from factor scales described by the Alcohol Use Inventory (
14) focusing on alcohol use in the previous 12 months. The items of the ADS were constructed by Skinner and Allen (
15) with weight placed on areas related to loss of behavioral control, obsessive drinking style, and psychophysical/psychoperceptual withdrawal symptoms. In a validation of the ADS by Doyle and Donovan (
16), a three‐factor solution was elucidated representing these same three domains. Outside of the ADS, Mundt et al. described three orthogonal factors corresponding to psychomotor, subjective, and physiological (body temperature, oculomotor) response domains (
17). Our study expands upon these findings by seeking to gain a better mechanistic understanding of variation in physical alcohol responses specifically, rather than behavioral or control differences, and implicating genetic bases in the correlation of response domains.
Alcohol response factors emergent from this approach were used to ask whether diverse alcohol response phenotypes correlate with latent factors, implying concurrent effects and a shared genetic mechanism, or remain independent. Factor scoring on alcohol response factors could have diagnostic and predictive utility, potentially providing a tool to identify genetic and other sources of variability.
Methods:
Study Sample
(See Supplemental Methods for more information) Participants were 938 individuals diagnosed with AUD via structured psychiatric interview (SCID), either meeting DSM‐5 criteria for AUD or DSM‐IV criteria for alcohol dependence/abuse. All study participants provided written informed consent under a natural history protocol approved by the National Institutes of Health institutional review board.
Statistical Analyses
Factor analysis was performed using 17 alcohol response related items from the ADS (out of 25 total) as indicator variables. The 17 items chosen were specific alcohol response phenotypes such as hangover, hallucinations, passing out, and convulsions (see
Table 2). The other eight items were excluded because they did not pertain to physical alcohol responses. The data set was randomly split into two halves (each with n=469), one for exploratory factor analysis (Group 1) and a test set for confirmatory factor analysis (Group 2). Exploratory factor analysis in Group 1 (EFA
1) identified latent factors underlying the indicator variables (
Table 2). In Factor Analysis, and unlike Principal Component Analysis, factors can be non‐orthogonal and intercorrelated. Analyses were conducted in Mplus version 7.4. Weighted least squares was used to estimate the model and the geomin oblique rotation was applied, allowing correlation between factors as recommended when indicators are predicted to load onto more than one factor. Factor selection was guided by examination of fit indices and overall interpretability. The fit indices examined were the root mean square error of approximation (RMSEA), the comparative fit index (CFI) and the Tucker‐Lewis index (TLI). The recommendations of Hu et al. were followed, which suggest CFI and TLI values above 0.95 and RMSEA values below 0.06 to represent good model fit (
18). Variables with a loading ≥0.35 were considered to load onto a particular factor. Confirmatory factor analysis (CFA), which fit the indicator items in Group 2 onto the factor structure pre‐determined by Group 1, was performed in the test data set to ensure that model fit was still acceptable. In the CFA, variables with loadings <0.35 in EFA
1 were fixed at zero, and modification indices, which reflect improvements in model fit with addition of previously omitted and freely estimated parameters (
19), were examined and applied if they improved model fit and were conceptually meaningful. Good model fit was then tested in the full dataset.
In order to assess for stability of item loadings onto the factors, a replication of the factor analysis was carried out using the same model and rotations as described above and further described in Supplementary Methods.
MIMIC Analysis
A multiple indicators, multiple causes (MIMIC) analysis, a model in covariance structure analysis previously described by Joreskog and Goldberger (
20), was carried out to identify patient characteristics that predict how individuals score on each latent factor, or “multiple causes” for a latent factor that also has multiple indicators. A variety of social and demographic patient variables were assessed (
Table 3) using self‐report questionnaires administered under the Natural History Protocol. These questionnaires were part of a set of assessments that were collected over a period of time to characterize a range of phenotypes, including but not limited to alcohol use behaviors, comorbidities (mental health history and substance use measures), and personality and behavioral traits (aggression and impulsivity) that may be associated with AUD. Our previous work has examined these measures for group differences in addicted versus nonaddicted individuals as well as alignment with the neurofunctional domains of incentive salience, negative emotionality, and executive function that map onto the phases of the addiction cycle (
21,
22,
23). The patient variables chosen in this study (further described in Supplementary Methods) were used to ask whether physical responses to alcohol identified in this current study are predicted by the same characteristics.
We also tested sociodemographic characteristics including genetic ancestry, environmental factors (childhood adversity), and developmental markers (age at first drink) based on previously described biopsychosocial models for development of substance use disorder (SUD) (
24,
25). Genetic ancestry information was extracted from genotyping on Illumina 850k arrays (data not shown) yielding ancestry informative markers used to compute ancestry scores) and analysis of functional variants.
Results
Demographically, the 938 participants in this study were diverse (
Tables 1a and
1b). 31% were female, and 49% were Caucasian. Mean age at first drink was approximately 15 years, and average standard drinks per drinking day was approximately 13. All had a current diagnosis of AUD. 64% had an additional diagnosis of SUD at some point in their lifetime. There was a considerable, but not unexpectedly large, proportion of patients with co‐morbid psychopathology, including 24% diagnosed with posttraumatic stress disorder, 38.5% diagnosed with an anxiety disorder, and 29% with major depressive disorder (MDD). The average score on the ADS was close to 19.
Alcohol Response Factors
EFA
1 resulted in a good model fit for both a two‐factor model (RMSEA=0.050, CFI=0.976, TLI=0.969) and a three‐factor model (RMSEA=0.036, CFI=0.989, TLI=0.984). The three‐factor model had better fit indices and more distinctly grouped ADS response items, which allowed for more clear recognition of what each domain represented.
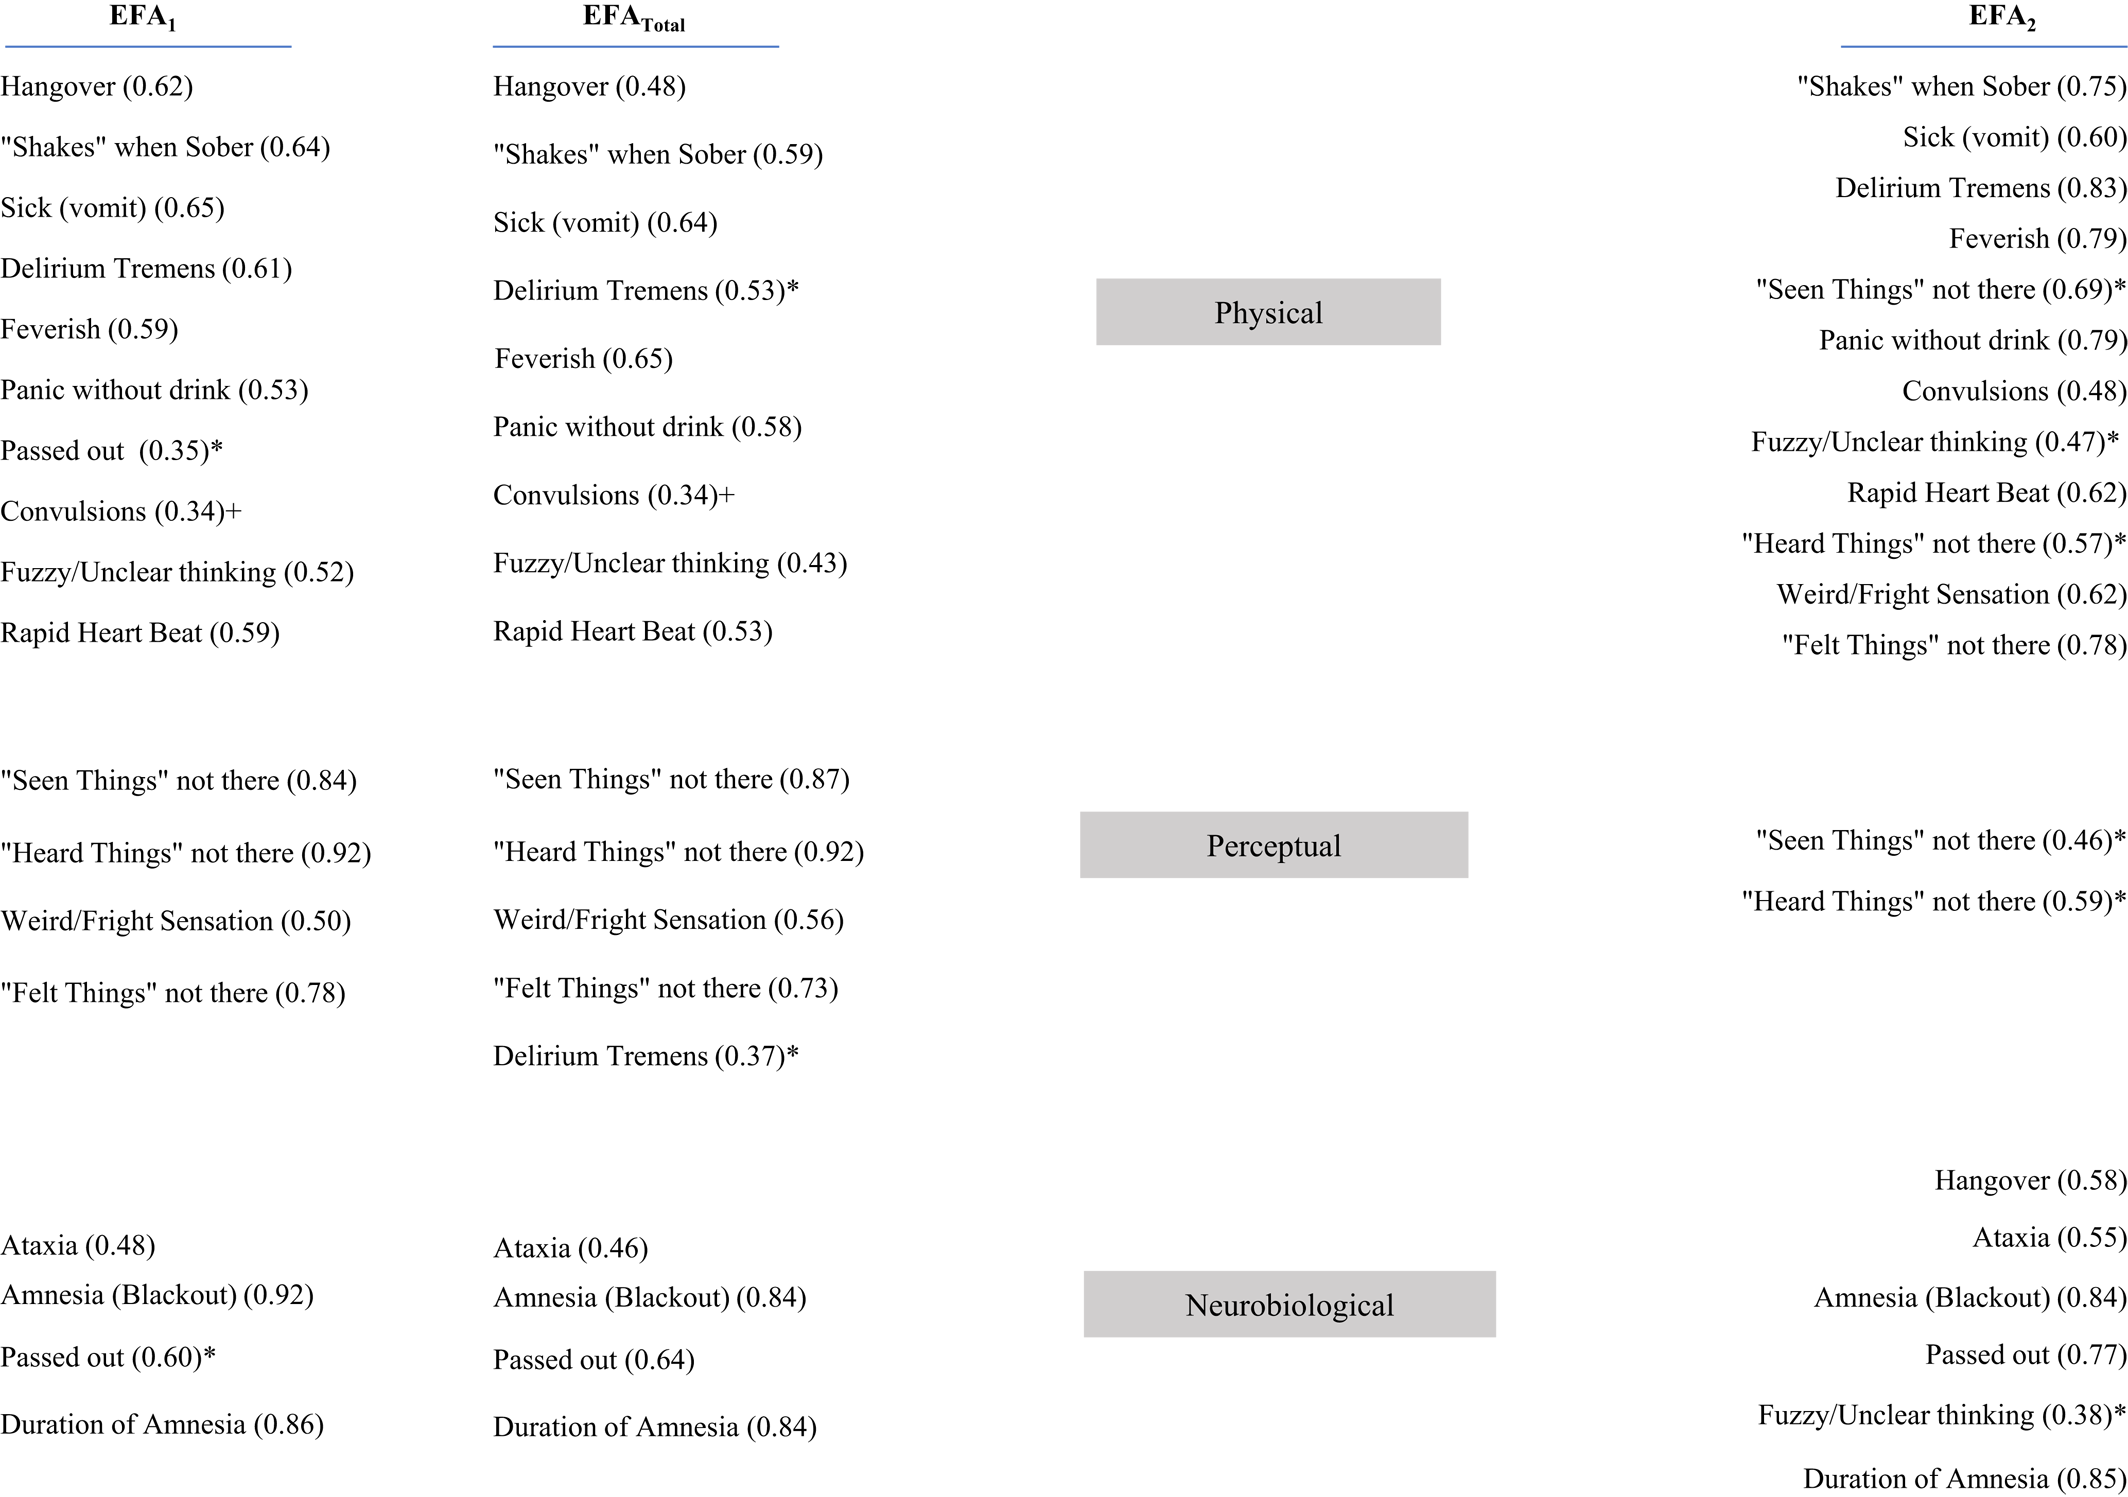
Table 2 shows the factor loadings for the three‐factor solution with each ADS item loading onto at least one of three factor domains described below.
Factor 1 (labeled “Physical”) encompassed physical symptoms related to alcohol use, with positive loadings for hangovers, “shakes,” vomiting/cramps, delirium tremens, fevers, panic without drink, passing out, convulsions, unclear thinking, and rapid heartbeat. Factor 2 (labeled “Perceptual”) was defined by perceptual disturbances and included positive loadings for “seeing things not really there” and “hearing things not really there.” Factor 3 represents a “Neurobiological” domain, including positive loadings for ataxia, blackouts or loss of memory, and passing out in relation to drinking.
CFA performed in the test half of the data set determined that the items assigned to factors by EFA1 still resulted in good model fit (RMSEA 0.062, CFI 0.963, and TLI 0.957). Final factor analysis of the full data set revealed a strong fit to the three‐factor model (RMSEA=0.057, CFI=0.967, TLI=0.961).
Stability of Item Loadings onto Factors
Stability of factors and item loadings onto these factors from EFA
1 tested via second, independent EFA (EFA
2) are shown in
Figure 1 (RMSEA=0.034, CFI=0.991, TLI=0.987). Again, the factors still represented Physical, Perceptual, and Neurobiological categories and fit indices indicated good model fit. However, the items loaded somewhat differently in EFA
2, resulting in less distinct grouping of ADS items (greater cross‐loading of items onto two different factors). Factor loadings from the EFA
1 and EFA
2 reveal that while some indicator items loaded strongly onto the same factors each time, others loaded onto different factors or cross‐loaded in one group, but not the other. The factor solution and item loadings of EFA
Total (RMSEA=0.034, CFI=0.991, TLI=0.986) closely resembled the EFA
1 factor solution. EFA
1 was chosen to be the final factor solution because of better interpretability and was used for the following MIMIC analysis.
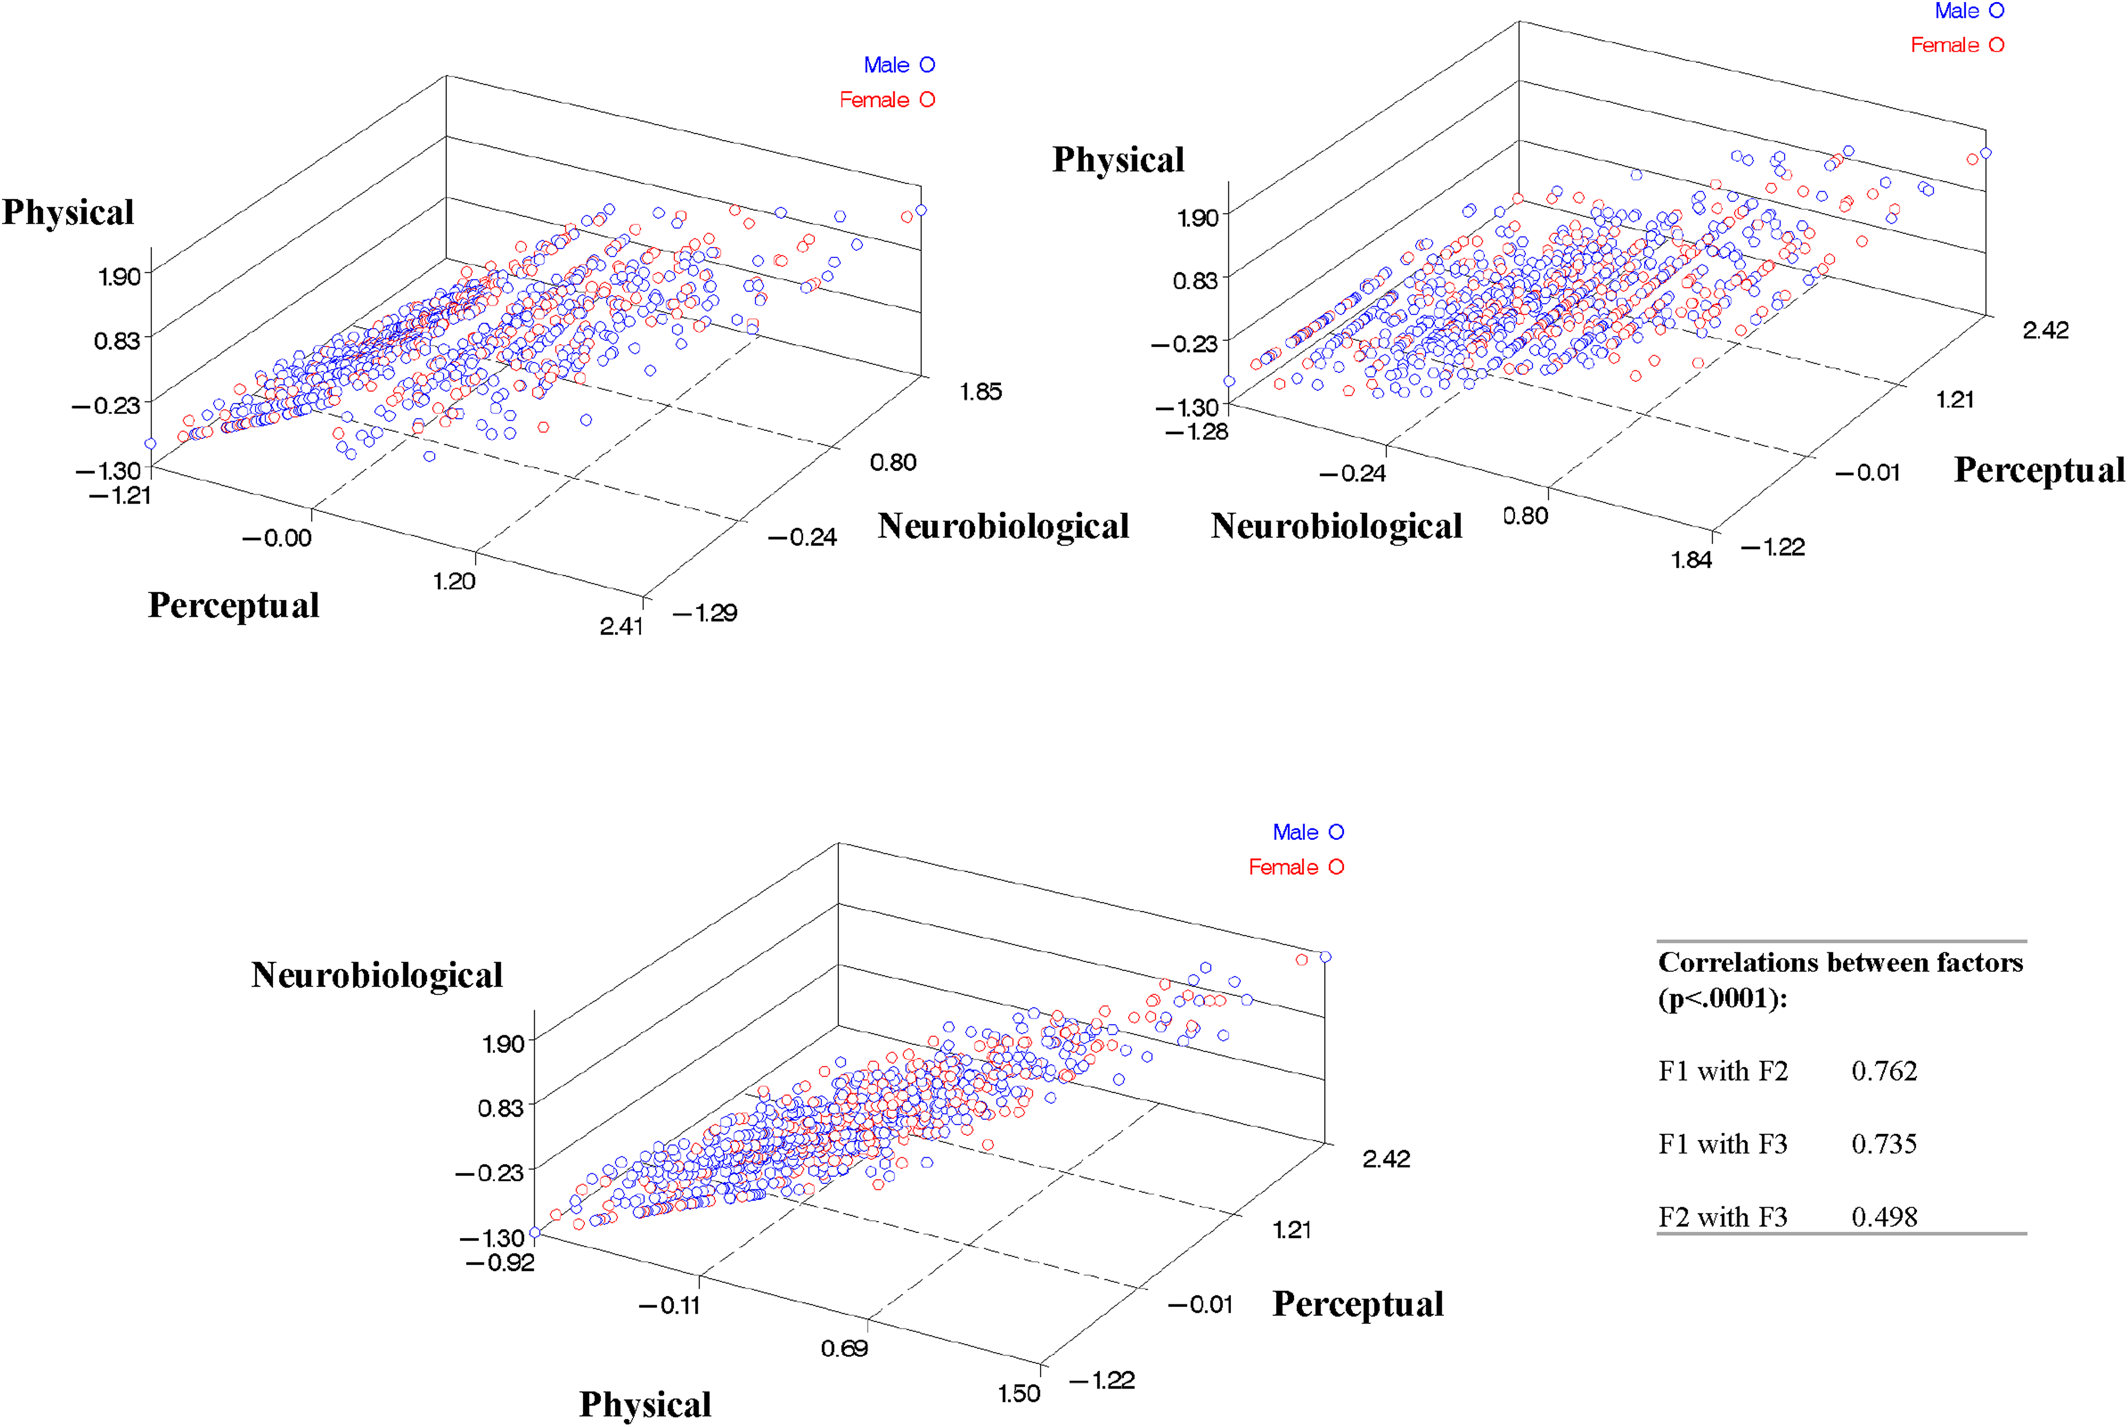
The three factors were moderately to highly correlated, as shown in
Figure 2 (Factor 1 with Factor 2=0.762, Factor 1 with Factor 3=0.735, and Factor 2 with Factor 3=0.498, p<0.0001 for each).
Clinical Predictors of Alcohol Response Factors
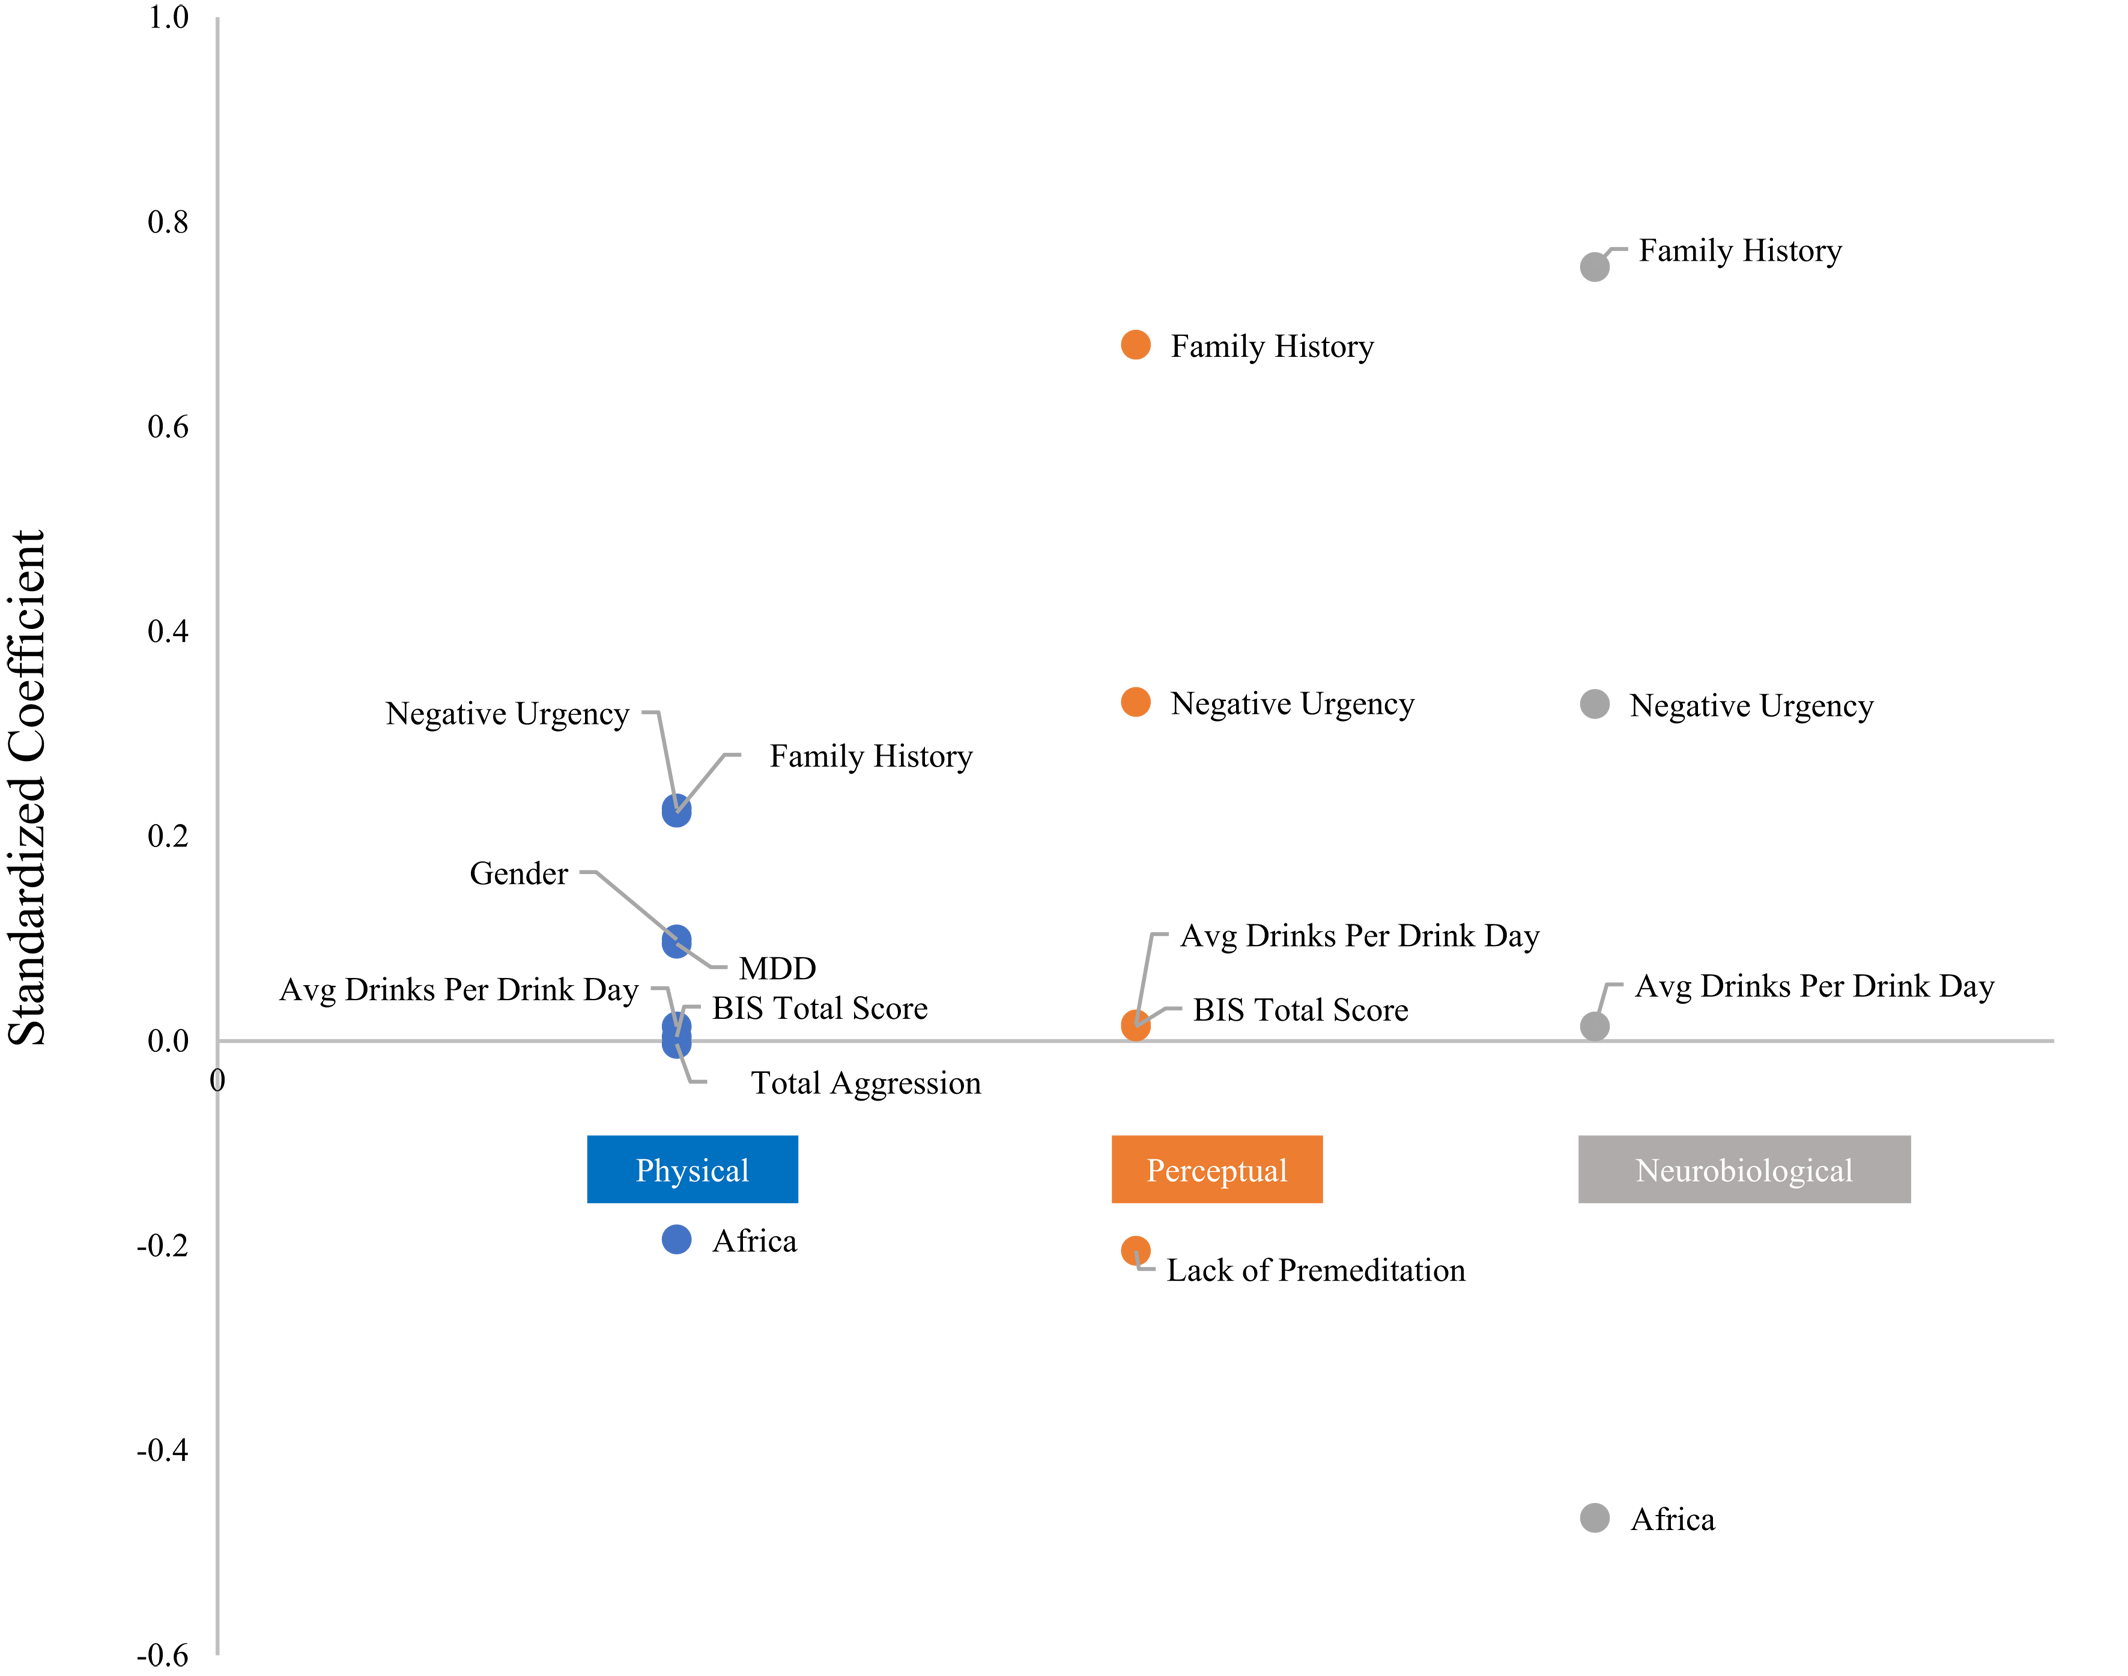
Results from the MIMIC analysis (
Table 3) showed that genetic information and gender predicted domain‐specific responses. A history of major depression predicted more physical symptoms. Aggression negatively predicted physical symptoms and lack of premeditation (planning/deliberation before an act) negatively predicted perceptual symptoms. Barratt's Impulsivity Scale total score predicted the Physical and Perceptual domains. Family history (proportion of first and second degree relatives with alcohol‐related problems), average drinks per drinking day, and negative urgency (an impulsivity measure) predicted all three domains. MIMIC results are graphically depicted in
Figure 3.
Discussion
AUD patients are diverse in age, gender, genetic background, developmental exposures, age at onset, psychiatric comorbidity, level of illness, and more. Despite this diversity, a common underlying structure of responses to alcohol can be detected. We successfully identified three latent factors underlying diverse alcohol response phenotypes: Physical Symptoms, Perceptual Disturbances, and Neurobiological Effects. Furthermore, MIMIC analysis identified a range of patient characteristics as well as genetic ancestry information that predicted how individuals scored on each of these factors. From this we ascertain that genes that have not yet been identified underlie the mechanistic process leading to variation in alcohol response.
Factor scores created from this analysis (
Figure 2), synthesizing inputs from multiple items, are potential targets for mechanistic studies, reducing the complexity of data and more robustly measuring latent traits than individual items even within a disease as causally and clinically complex as AUD. Future applications can include genetic studies using individual loci implicated by GWAS, measured ancestry, or polygenic risk scores to predict response domains. Future directions can also include studies of prevention and treatment, with response domains being important both as markers of liability and as predictors of adverse consequences that might be ameliorated or exacerbated by treatment.
The concurrent loadings of indicator items onto the Physical factor indicate possible shared genetic liability underlying domain‐specific alcohol responses. Rodent models have allowed for mapping of genes related to alcohol sensitivity and withdrawal. However, genes implicated in these response phenotypes remain largely independent (
26). Inbred mouse strains differ significantly in alcohol withdrawal (AW) severity, independent of strain differences in alcohol metabolism. Studies by Metten and Crabbe showed that around one‐third to one‐half of the total variability in withdrawal among animals is influenced by genetic factors. However, commonalities in genetic risk factors for the diverse physical symptoms exhibited by patients have yet to be discovered. Our primary analyses suggest that it may be worthwhile to undertake genomic studies to further investigate a shared genetic basis of responses to alcohol that may exist in humans.
Clinically, it is important that multiple indicators loaded onto the Physical symptom domain. ADS items did not load independently, but instead co‐loaded onto the Physical factor, implying concurrent effects of different phenotypes on the overarching domain. Based on these results, clinicians should be aware that patients presenting with one alcohol‐related physical problem are at risk of emergence of other physical problems as well. Patients should be surveilled for these and could possibly benefit from prophylactic treatment.
An animal model is lacking to study the genetics or physiology of alcohol induced blackout (AIB). However, the existence of a Neurobiological Effect domain or “blackout domain” implies that specific physiologic and genetic differences influence AIB. AIB are a concern practically unique to AUD as compared to other addictions. Blackouts are significantly associated with a lifetime diagnosis of AUD, with stronger associations seen with higher frequency of blackouts (
27). AIB often foreshadow severe AUD symptoms over the course of the disease (
27). Blackouts are distinct from passing out because the individual is conscious and capable of carrying out a conversation, but suggestible. They are thought to occur because of alcohol–induced disruption of the hippocampus, a brain region that is vital in the formation of new autobiographical memories (
28). Episodic memory fails in blacked out individuals who often awaken the following day with no recollection of events that took place while in a state of diminished self‐control. This chain of events dramatically increases risk of hazardous accidents, physical violence, sexual assault, and other serious harm to themselves and others (
29).
The problem of blackouts is compounded by the fact that AUD patients with blackouts are likely to have other problematic responses to alcohol as well. We found that individuals who loaded highly onto the Neurobiological domain were likely to be high scorers in the other domains because each of the three factors were intercorrelated. It has been shown that psychiatric disorders that tend to be comorbid have genetic liability that is partly shared, as seen in the case of schizophrenia and SUD (
30). Understanding the genetic basis of these response domains and discovery of shared liability will allow for development of better treatment and prevention strategies for emergent clinical problems.
Clinical Correlates of Alcohol Response Factors
A genetic basis underlying scoring on alcohol response factors is further evidenced by ancestry‐informed prediction of individual factor scoring in the response domains. Participants with alleles highly differentiated in ancestral African populations were less likely to indicate physical symptoms as well as blackout symptoms after controlling for amount of alcohol used. Along the same lines, gender was a predictor of scoring on the Physical domain.
Interestingly, social and demographic variables predict the severity of alcohol response factors in individuals, outside of the influence of simply drinking more alcohol. Suggestive of the multidimensionality of AUD, indicator items for response factors are tied to other aspects of the clinical picture. Such environmental predictors likely interact with genetic liability in a gene‐environment interplay leading to level and diversity of alcohol responses. Indicator items for the Physical factor encompass many of the symptoms of AW including delirium tremens and seizure and are predicted by MDD. These results point towards the possibility that dysphoria and negative emotionality contribute to more severe physical symptoms in patients with AUD. Shared neural mechanisms may underly negative emotional state, stress, and physiologic withdrawal. In fact, the pathophysiology of withdrawal, familiar to clinicians as irritability, tremors, hallucination, and seizure, is thought to involve the effects of stress hormones on neurotrophic factor signaling (
31). Furthermore, addictive substances induce adaptive changes in brain function that are the bases for tolerance, craving, withdrawal and affective disturbance. The ability of addictive drugs to adaptively shift the brain to an allostatic state leads to long‐lasting negative emotionality and predisposes to relapse triggered by either stress or drug‐related cues (
32). Considerable interindividual variation exists in sensitivity and resilience and is partly heritable due to the influence of functional variants of genes mediating stress or stress response. Examples of the former are the
NPY (
33) and
FKBP5 (
34) genes and an example of the latter is the
SLC6A4 polymorphism altering serotonin transporter expression in the amygdala, changing response to emotional stimuli (shown by functional magnetic resonance imaging, fMRI) and contributing to dysphoria and drug consumption after exposure to stress (
34). The close relationship between affective disturbance, alcohol use, and withdrawal should be monitored by clinicians, who may be able to prevent lapse and relapse by targeting motivation enhancement therapy towards negative emotionality traits.
Negative urgency is shown to underlie all three domains of alcohol response. Negative urgency involves acting rashly when in extreme distress. It has been proposed to derive from stress related to negative emotional states during withdrawal/negative affect stage of the addiction cycle (
35). Strong individual differences in impulsivity precede addiction and impulsivity is a liability factor that has been tied to several genes, including a stop codon of the HTR2B receptor (
36). The frontal cortex mediates executive cognitive function and moderates impulsivity, as evidenced by lesions of the frontal cortex that disinhibit behavior, the effects of drugs (e.g., methylphenidate), functional genetic variants (e.g., COMT Val158Met) that modulate dopamine levels, and fMRI response of this region (
37). Impulsive behavior is thus the product of both urgency and moderation of impulse and can be tied to different, interacting regions of the brain. The imbalance between the two is accentuated by alcohol intoxication. Liability to partake in uncontrolled drinking may be associated either with negative urgency or impulsivity with other origins, in either case leading to blackouts, which are thought to arise from dramatic and rapid increases in blood alcohol concentration (
29).
Average drinks per drinking day predicted all three domains. Alcohol consumption measures were included in the analysis to control for amount of alcohol used when identifying predictors of the response domains.
Limitations
Because our clinical sample consisted of AUD patients with high levels of alcohol consumption, responses such as blackout, passing out, and seizure, which rely on heavy alcohol exposure for recognition, were more detectable in our sample. Our findings support the existence of three alcohol response domains; however, these results are also limited by the items chosen in the ADS. Another limitation of this study was that we did not differentiate patients in our population sample that had moderate versus severe AUD. A future study with this differentiation may give better insight into what predicts future alcohol use behaviors and which predictors may be relevant for moderate drinkers versus severe drinkers.
Few of the patients we studied carried functional polymorphisms of ADH1B and ALDH2 that trigger alcohol‐induced flushing and might alter other alcohol responses, as well (see Supplementary Methods). Our sample was predominantly European and African American and contained few individuals of East Asian descent. None of our subjects carried protective Arg48 and ALDH2 Lys487 alleles. Therefore, we had limited ability to relate flushing to other alcohol response items.
Conclusions
We identify three factors relevant for diverse alcohol response phenotypes, Physical Symptoms, Perceptual Disturbances, and Neurobiological Effects. Diverse items from the ADS concurrently load onto the same factors rather than loading independently. Gender, ancestry, personality traits, and degree of alcohol consumption predict the severity of items that define the alcohol response factors. Patients presenting with one problem, for example delirium tremens or blackouts, are likely to experience several problems in clinical settings, either acutely or sometime in the future. These co‐occurring phenotypes point towards an underlying shared physiology of diverse alcohol responses.


