In the wake of the deinstitutionalization movement and the current emphasis on recovery-oriented and person-centered models of behavioral health service delivery, stakeholders are increasingly interested in less coercive alternatives to traditional inpatient and emergency interventions (
1). Peer respites are voluntary residential programs designed to provide a safe space for individuals experiencing or at risk of experiencing a self-defined mental health crisis. Currently, a handful of such programs operate throughout the world, including 13 in the United States (
2).
Peer support is based on the principle that as providers, persons with lived experience offer a unique perspective on mental health and foster hope that recovery is achievable (
3). Two recent literature reviews examining the effectiveness of peer supports found that peer-provided services are associated with reductions in inpatient service use, although both reviews concluded that methodological shortcomings and measurement issues limited existing research (
4,
5).
A smaller body of literature has examined peer respites. In the only randomized trial, Greenfield and colleagues (
6) examined mental health service costs, functioning, psychiatric symptoms, self-esteem, and satisfaction among 393 individuals facing civil commitment for mental health issues who were randomly assigned to peer respite or to a locked inpatient facility. Compared with the control group, respite users had higher satisfaction and experienced greater improvements in symptoms, social functioning, and self-esteem. There were no significant cost differences between groups, although authors noted that randomization and attrition issues may have biased the study against the respite condition, leading to an underestimation of cost reductions for the respite group.
In 2013, Thomas and Rickwood (
7) conducted a systematic review of acute and subacute residential services, which included the aforementioned study by Greenfield and colleagues (
6) and 25 other studies that examined similar programs staffed by nonpeers. That review found that residential crisis alternatives are generally associated with higher satisfaction, similar or improved symptoms and quality of life, and reduced costs compared with inpatient psychiatric units. Recent reviews of other community-based crisis alternatives, such as day hospitals and crisis resolution teams, found improved clinical and recovery outcomes and lower inpatient utilization (
8,
9).
The existing literature suggests that peer respites may lower system costs through reductions in inpatient and emergency services. Using a quasi-experimental design with propensity score matching and two-stage regression analysis, we examined whether use of inpatient and emergency services differed among individuals who used or did not use a peer respite during a two-year period. This analysis was part of a mixed-methods evaluation of 2nd Story, a peer respite program in Santa Cruz County, California. The program is funded by a grant from the Substance Abuse and Mental Health Services Administration, administered through a community-based organization, and overseen by the Santa Cruz County behavioral health department.
2nd Story offers short-term residential support for six individuals, or “guests,” in a homelike environment for up to 14 days per visit. Some program participants return to 2nd Story after their stays to take part in program activities as visitors or volunteers. The program is staffed entirely by peers trained in Intentional Peer Support, a trauma-informed service delivery paradigm emphasizing mutuality, reciprocity, and growth (
10). Participation in all program activities, such as informal groups, open staff meetings, shared meals, day trips, and other social events, is entirely optional.
Individuals currently receiving publicly funded behavioral health services through the county’s system of care are the program’s target population. Program staff conduct ongoing outreach and education with staff and participants at local mental health programs. To be eligible, individuals must be adults enrolled in the county system of care who are not homeless at the time of admission. Each admission (including readmissions) is contingent on an interview with program staff to discuss what brings a potential guest to the program and what he or she hopes to accomplish by staying there. On the basis of the interview, two or more staff reach consensus on whether to admit a potential guest.
Methods
Data and Variables
We examined deidentified, county-derived demographic and service use data for individuals receiving county behavioral health services over a period of approximately two years, from the program’s opening date on May 16, 2011, to June 30, 2013. The data set includes basic demographic variables, clinical characteristics, and date and length of services. It also includes service records dating to the individuals’ entry into the county system, which were used to establish baseline service history. Because the data are organized by service episode, there were multiple observations per individual. For variables that could possibly change from one episode to another, such as marital status, employment, age, diagnosis, and Global Assessment of Functioning (GAF) score, we used the observation closest to the program’s opening date. We constructed binary variables to indicate whether an individual used each service from a detailed list of services. The outcome of interest of this analysis—inpatient and emergency service use—included crisis support services, crisis residential services, and short- and long-term psychiatric inpatient hospitalization. The study protocol was reviewed and approved by the Human Services Research Institute’s Institutional Review Board.
During the study period, 8,462 adults received services through the county’s system of care, and 141 of these used the peer respite. Of the former group, 139 nonusers of respite were assigned to a comparison group by using propensity score matching. Propensity score matching is commonly used in cases in which a randomized control group is unavailable (
11,
12). By simultaneously accounting for multiple observed factors that may influence selection of an intervention group, propensity score matching minimizes the effects of confounders associated with selection and mimics randomization by generating a sample that is comparable to the intervention group in terms of characteristics relevant to the study. A propensity score reflects the predicted probability of receiving versus not receiving an intervention.
We fitted a binary logistic regression model predicting the log odds of having participated in the program and used the predicted values as propensity scores. Predictors were selected on the basis of their hypothesized relationship to the treatment variable (peer respite use) and the outcome (inpatient or emergency service use) and were composed of the following factors: demographic characteristics (age and gender), clinical characteristics (schizophrenia, substance abuse, and axis II diagnosis), and behavioral health service use prior to the program’s opening date (use of a care coordinator; subacute, outpatient, inpatient, crisis, locked, and substance use services; homelessness support; medication management; employment support; board and care; jail support; and benefits counseling). The model fit the data well: the omnibus test of model coefficients yielded a chi square value of 493.7 (df=17, p<.001), and the Hosmer-Lemeshow test indicated no significant differences between observed and model-predicted values.
Using nearest-neighbor matching, we assigned each respite guest to a nonuser of respite (
13). Of the 141 respite guests, 139 had data for all of the characteristics used for matching and were successfully assigned a match, yielding a final sample size of 278.
After matching a respite guest and a nonuser of respite, each member of the pair was assigned an index date corresponding to the respite user’s first visit to the respite. This “matched pair” index date assignment ensured that potential bias due to a “censored cohort” effect was similar for both groups. We then calculated two outcome variables: a binary variable indicating whether an individual ever used inpatient or emergency services after the index date and the total number of hours of use of inpatient and emergency services after the index date, log transformed to account for nonnormality and heteroskedasticity typical of health care utilization data (
14,
15).
Statistical Analysis
All analyses were performed by using SPSS software, version 22 (
16). Because of the zero-inflated nature of the outcome variable (inpatient and emergency service hours), we used a two-stage regression approach. This approach is appropriate in cases in which the dependent variable has a disproportionate number of zeros; hence logarithmic transformations do not fully address nonnormality, a situation frequently encountered in health care utilization studies (
14,
15). In stage 1, we fitted a logistic regression model to estimate the log odds of any use of inpatient or emergency services after the index date, controlling for relevant covariates.
In stage 2, we estimated an ordinary least-squares regression model predicting total hours of use of inpatient and emergency services among individuals who used these services after the index date. Regression diagnostics ensured model assumptions were not violated, and eight cases with residuals larger than two standard deviations from zero on either side were removed from the final model. To capture the full complexity of program effects, group membership information was represented by two separate variables: a dichotomous variable indicating whether the individual was a respite guest and a “dosage” variable measuring total days of respite, coded zero for the comparison group.
Results
Table 1 displays study sample characteristics. A vast majority of participants were non-Hispanic white, single, and unemployed and had a care coordinator. Most had used some outpatient, inpatient, and emergency services prior to the index date. On average, respite guests had 2.3 program episodes and 28.4 total respite days.
We observed only one significant baseline difference between the groups—greater use of outpatient mental health services before the index date among respite users (Pearson’s χ2=4.4, df=1, p=.04). Differences between the two groups in use of inpatient or emergency services at baseline were marginally significant. The analytic models included these two factors as controls to account for this baseline nonequivalence. No significant group differences were observed in the proportion of participants with care coordinators, suggesting that the propensity scores successfully addressed selection bias due to possible differences in referral and admission processes between individuals with and without care coordinators.
Individuals in the comparison group were, unexpectedly, less likely to use inpatient and emergency services after the index date (29%) compared with respite guests (42%). The multivariate analysis that follows provides a more nuanced picture of program effects than is implied by this bivariate association.
The results of the stage 1 model predicting the log odds of using inpatient or emergency services after the index date indicated that both respite use and respite days had significant effects independent of each other (
Table 2). The probability of using inpatient or emergency services was approximately 70% lower for respite guests compared with members of the comparison group (odds ratio [OR]=.16, p=.014) after we controlled for respite days and other relevant covariates. However, the likelihood of this outcome increased with every additional respite day (OR=2.21, p=.001). When other factors were held constant, having a care coordinator was associated with an increased likelihood of use of inpatient or emergency services (OR=2.16, p=.048).
Because of logarithmic transformations and the inclusion of both respite use and dosage in the model, the information in
Table 2 alone does not adequately convey the association between respite stay and use of inpatient or emergency services.
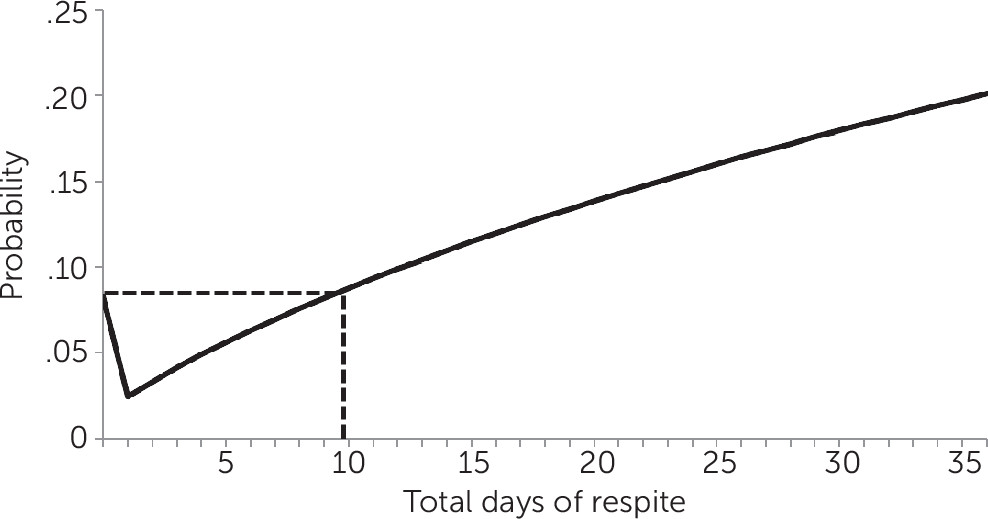
Figure 1 is a visual representation of this association. We calculated the probabilities in the figure based on the results of the stage 1 model, holding constant all other variables that were at least marginally significant (using means for continuous variables and modes for dichotomous variables). The probability plot reveals that respite users with stays of up to about nine days were less likely to use inpatient or emergency services compared with nonusers of respite. Among respite participants who stayed longer, use of inpatient or emergency services was equal to or higher compared with use among nonusers of respite, based on predicted probabilities.
Table 3 displays results of the stage 2 regression model in which we predicted the log-transformed hours of inpatient and emergency services among individuals who used those services, controlling for demographic characteristics and use of other services. Within this subsample (N=98), respite use had no net effect on inpatient and emergency service hours after we controlled for dosage. However, log-transformed respite days were negatively associated with inpatient or emergency service hours (β=–.559, p=.037). On average, women were more intensive users of inpatient and emergency services compared with men (β=.294, p=.008). The model explained 27% of the variability in hours of inpatient and emergency services among users of these services.
Figure 2 displays the relationship between total hours of inpatient and emergency services and number of respite days. The number of hours was predicted by the stage 2 model, after we controlled for all other covariates that were at least marginally significant. The predicted decline in hours of inpatient and emergency services was steepest between zero days (no respite) and one day of respite, from 134 to 99 hours. The decline continued with increasing respite days but at a gradually lower gradient. The curve appears to level off around nine to ten days of respite. After this point, each additional respite day predicted a negligible reduction; for example, participants who stayed at 2nd Story for 14 days used only one additional hour of inpatient and emergency services compared with participants who stayed 15 days.
As demonstrated by the stage 2 results, longer respite stays were significantly associated with fewer hours of inpatient and emergency services, although there appeared to be diminishing returns with each additional respite day, especially after nine or ten days. Stage 1 results suggested a similar “breaking point” of around nine or ten days in the program’s effects on the probability of using inpatient or emergency services.
Discussion
These results, which were based on data from the first two years of a five-year program, highlight several noteworthy points. First, even with a relatively small sample, we detected a significant association between participation in a peer respite and use of inpatient and emergency services. Equally important, results suggest that this association is complex and nonlinear.
When the analysis was restricted to individuals who used any inpatient or emergency services, results suggested that program benefits were larger for guests who stayed no more than nine to ten days compared with those who stayed longer. It is possible that individuals who stayed at 2nd Story longer than nine days had some shared functional or clinical characteristics that increase the need for inpatient and emergency services, regardless of respite use. One such factor may be housing instability. However, receipt of board-and-care or homelessness services in the past, which may be proxies for housing instability, were already included as covariates in the models.
We also examined available baseline measures of diagnosis and functioning to explore possible clinical differences between respite participants who stayed longer than nine days and those whose stays were shorter. There was no significant difference between the groups in mean GAF scores. We also considered diagnostic categories. Controlling for these factors made no notable difference in the conclusions, so they were not included in the final models.
Although the results were practically unchanged after addressing housing instability and clinical differences between guests with shorter or longer stays, further research is needed before this finding is used to guide program design decisions about optimal length of stay because the currently available data did not allow us to fully investigate other potentially important underlying mechanisms. The relationship between length of stay and use of inpatient and emergency services could be reflective of a habitual reliance on institutional services by some individuals. In addition, the relationship may be mediated by other unobserved factors, such as health and wellness, nonclinical supports, and other life stressors. More reliable measures of functioning and housing stability than were available for this analysis could also yield different models. In any case, results suggest that a respite may act as an alternative to inpatient and emergency services, at least for individuals who use a respite program for relatively brief periods.
These results, although promising, should be regarded with caution because of several study limitations. First, propensity score matching carries significant limitations, chief among them the fact that propensity scores can account for only observed characteristics and cannot account for unobserved factors that might influence a decision to use respite services (
17).
Further, the shapes of the predicted curves (
Figures 1 and
2) may be influenced by unobserved factors, as discussed earlier; and the curves could shift vertically or horizontally as new data become available. These cautionary notes notwithstanding, the preliminary results have important policy implications for the incorporation of peer respites into mental health systems.
Conclusions
This analysis adds to the limited literature on service use implications of peer respites. The peer respite model is currently understudied. Although its methods carried limitations, this study provides a much-needed glimpse into the impact of this innovative model. Findings suggest peer respites may be an effective alternative to traditional crisis services. Peer respites may have the potential to increase meaningful choices for recovery and decrease the behavioral health system’s reliance on more coercive, less person-centered modes of service delivery.
Future research should continue this line of inquiry by using more rigorous experimental designs, analyzing cost implications, and incorporating additional covariates, such as quality of life, social supports, and life stressors. The observed reductions in use of inpatient and emergency services by respite guests likely translated to some degree of cost savings, given the resource-intensive nature of these services. Future analyses should test this hypothesis by generating reliable estimates of the potential savings attributable to this service model.


