Full access
Articles
Published Online: 16 November 2015

National Trends in Psychiatric Not Otherwise Specified (NOS) Diagnosis and Medication Use Among Adults in Outpatient Treatment

Abstract

Objective:

This study examined national trends between 1999 and 2010 in not otherwise specified (NOS) DSM-IV psychiatric diagnoses and in related medication treatment patterns reported for adults during outpatient physician office visits.

Methods:

Data on physician office visits by adults (ages 18–64) with a psychiatric diagnosis were from the National Ambulatory Medical Care Survey and National Hospital Ambulatory Medical Care Survey (1999–2010) (N=52,026). Trends for visits with full-criteria diagnoses compared with visits with NOS diagnoses were analyzed for major psychiatric diagnostic groups, physician specialty, and prescribed medications. Population weighted chi square and logistic regression analyses were utilized.

Results:

Between 1999–2002 and 2007–2010, the proportion of all mental health visits by adults to office-based physicians that involved an NOS diagnosis increased significantly, from 42% to 50% (p<.001). Significant proportional increases in NOS diagnoses included bipolar disorders NOS (5% to 55%), anxiety disorders NOS (50% to 62%), and mood disorders NOS (.4% to 1.8%). In 2007–2010, NOS visits accounted for a greater proportion of visits to nonpsychiatrists than to psychiatrists (61% and 35%, respectively). Psychotropic medications prescribed during visits increased over time for both full-criteria and NOS diagnoses, but the increase was greater for NOS visits, specifically for antipsychotics, anticonvulsants–mood stabilizers, and lithium. By 2007–2010, psychotropic monotherapy and multidrug regimens were comparable for full-criteria and NOS diagnoses.

Conclusions:

The proportion of U.S. physician visits with an NOS psychiatric diagnosis increased to nearly 50% in 2007–2010. The increase raises concerns about the precision of psychiatric diagnoses in community care and about the impact on concomitant medication regimens.
A recent study reported that the proportion of physician office–based psychiatric visits for youths with diagnoses not otherwise specified (NOS) increased substantially from 1999–2002 to 2007–2010 across major DSM-IV diagnostic groups (1). Compared with office visits with diagnoses that meet full psychiatric criteria, the proportion of office visits with a NOS diagnosis for youths (ages 2–19) during this 12-year period increased as follows: from 4% to 73% for bipolar disorder NOS, from 45% to 58% for anxiety disorders NOS, and from 53% to 58% for depressive disorder NOS.
Among adults, a number of studies in primary care have reported that the proportion of NOS psychiatric diagnoses equals or exceeds the proportion meeting full diagnostic criteria (2,3). These findings apply particularly to anxiety and depression diagnoses (2,4). However, no adult studies in U.S. national psychiatric and primary care settings have reported on trends over time in the proportion of psychiatric NOS diagnoses versus psychiatric diagnoses meeting full criteria (full-criteria diagnoses) and on corresponding psychotropic medication patterns.
This report presents trend data from 1999 through 2010 on the most common DSM-IV NOS psychiatric diagnoses. Data were obtained from a national sample of physician office visits by adults. NOS is specifically coded when symptoms do not fully meet diagnostic criteria, there is uncertainty about the etiology of the disorder, some relevant symptoms fall outside the listed diagnostic criteria, or insufficient diagnostic criteria are identified during the evaluation (5,6). Commonly, an NOS diagnosis is made when the number of psychiatric symptoms reported is subthreshold (not meeting a sufficient number of criteria) or the duration of the disorder is too short (2,7). In DSM-IV, NOS codes are similar to those that are unspecified in DSM-5, except that in DSM-5 these codes are specifically subdivided into “unspecified” and “other specified.” Also, DSM-5 does not include mood disorder NOS and pervasive developmental disorder NOS from DSM-IV.
In this study, psychiatric NOS diagnoses made during U.S. physician office–based visits over a 12-year period were described and proportionally compared with diagnoses reaching full diagnostic criteria. In addition, we explored diagnostic differences between 1999 and 2010 by physician specialty and patterns of psychotropic medications prescribed during office visits associated with full-criteria diagnoses and with NOS diagnoses.

Methods

Study Design and Data Source

This cross-sectional study was conducted with nationally representative data for physician office–based visits by adults (ages 18–64) from the National Ambulatory Medical Care Survey (NAMCS) and the National Hospital Ambulatory Medical Care Survey (NHAMCS) from 1999 through 2010. The NAMCS and NHAMCS are annual surveys conducted by the National Center for Health Statistics (NCHS) (8,9). NAMCS surveys include visits to non–federally employed office-based physicians who are directly engaged in outpatient care activities. Descriptions of data collection and processing, including the documentation of diagnoses in NAMCS and NHAMCS, can be found elsewhere (10). Up to three physician-reported diagnoses coded with ICD-9-CM categories were further categorized into full-criteria diagnoses or NOS diagnoses. Across the study years, survey response rates varied from 58.3% to 70.4%, with a median response rate of 62.5% for NAMCS and 90.4% for NHAMCS.
NAMCS and NHAMCS use a multistage probability sampling design involving primary sampling units (a county, a group of adjacent counties, or a standard metropolitan statistical area), physician practices within primary sampling units, and visits within physician practices. Each visit is assigned a visit weight and values for clustering and stratification to account for the complex multistage probability survey design. The data are weighted to produce national estimates of the utilization of ambulatory medical care. To ensure reliability of national estimates, absolute visit counts <30 are considered unreliable (8,9).
For each patient visit, both NAMCS and NHAMCS include information on sociodemographic and administrative characteristics, physician-reported diagnoses, and medications prescribed. Following NCHS guidelines, we combined NAMCS and NHAMCS visit data from contiguous survey years to produce stable estimates. Physician office visits were grouped into time periods as follows: 1999–2002, 2003–2006, and 2007–2010. Because the data set consisted of deidentified, publicly available data, the study did not require review by the institutional review board.

Outcome Measures

Psychiatric diagnoses.

The main dependent variable was the proportion of visits involving NOS diagnoses in each time period among total office visits for adults (ages 18–64) having a psychiatric diagnosis in the leading psychiatric diagnostic categories—namely, depressive disorders, anxiety disorders, and bipolar disorders.
Psychiatric diagnoses were assessed with ICD-9-CM codes. Diagnoses recorded by physicians using ICD-9-CM codes were matched to the DSM-IV codes by using a procedure published by the American Psychological Association and a similar procedure published by the Mental Health Department of Los Angeles County (11,12). A total of 33 unspecified psychiatric diagnoses were used in this study. [A table in an online supplement to this article lists the 33 unspecified diagnoses.] Eight ICD-9-CM codes were excluded from this study, because these physician-recorded diagnoses could not be successfully matched to DSM-IV codes. The excluded codes represented less than 5% of the diagnostic codes used in office-based adult visits with a psychiatric diagnosis.
The following full-criteria diagnostic codes were assessed. Depressive disorders included major depressive disorder (DSM-IV codes 296.2–296.3) and dysthymic disorder (300.4). Bipolar disorders included bipolar I disorder (296.0, 296.1, and 296.4–296.7), bipolar II disorder (296.89), and cyclothymic disorder (301.13). Anxiety disorders included all anxiety diagnoses (293.84, 300.2, 300.3, 300.8, 309.21, 309.81, 313.0, 313.2, and 313.89). NOS codes included depressive disorder NOS (311), anxiety disorder NOS (300.00), bipolar disorder NOS (296.80), and mood disorder NOS (296.90). Uniquely, mood disorder NOS (296.90) did not have a full-criteria categorical complement.

Psychotropic medications.

We report the proportion of visits during which selected psychotropic medication classes were prescribed, comparing the proportion of full-criteria visits with NOS visits. Psychotropic medications prescribed during visits for the treatment of psychiatric disorders included the following seven classes: antipsychotics, anticonvulsants–mood stabilizers, antidepressants, anxiolytics-hypnotics, lithium, alpha-agonists, and stimulants. Anticonvulsants–mood stabilizers included carbamazepine, oxcarbazepine, divalproex-valproic acid, lamotrigine, and topiramate. Psychotropic medication regimens were analyzed for monotherapy and for concomitant therapy (concurrent use of two drug classes or three or more drug classes), comparing full-criteria with NOS diagnoses across study periods.

Other Study Variables

Other study covariates included age group (18–24, 25–34, and 35–64 year olds), gender, race-ethnicity (white versus nonwhite, which included African American, Hispanic, Native American, Pacific islander, Asian, and more than one race), U.S. region (Northeast, South, Midwest, and West-Pacific), metropolitan versus nonmetropolitan statistical area, and payment type (private insurance, including self-payment, versus public insurance, including Medicaid, other government insurance, no charge, and unknown source).

Statistical Analysis

The proportional distribution of visits with full-criteria diagnoses versus those with NOS diagnoses was assessed with population-weighted chi square analyses across 12 years. Included in the analyses were total adult psychiatric visits and a rank order assessment for selected diagnoses—namely, depressive, anxiety, and bipolar disorders. Temporal changes in the sociodemographic and administrative characteristics of office-based adult visits were evaluated according to full-criteria and NOS visits by using population-weighted chi square analyses.
In a subanalysis that used only NAMCS data from 1999 through 2010, we compared the proportional distribution of full-criteria and NOS visits according to whether visits were to psychiatrists or nonpsychiatrists (including primary care and other specialties) for all psychiatric disorders, as well as separately for anxiety, depressive, and bipolar disorders. Weighted logistic regression was conducted with an interaction term for time period (2007–2010 versus 1999–2002) and physician specialty to assess whether trends in NOS diagnoses significantly differed between visits to psychiatrists and to nonpsychiatrists.
In addition, we used weighted, multivariable logistic regression models to assess the proportion of NOS and full-criteria diagnoses for any psychotropic medications and to assess selected psychotropic medication classes prescribed during the visits. All statistical analyses were performed at the visit level with SAS, version 9.3.

Results

Characteristics of Physician Office Visits by Adults

As a proportion of all adult physician office visits (N=405,297), visits with a psychiatric diagnosis (N=52,026) increased slightly, from 17.1% in 1999–2002 to 18.3% in 2007–2010. The majority of visits were made by adults who were white (80%−83%), privately insured (65%−73%), and female (57%−66%) and who resided in metropolitan areas (83%−89%) (Table 1).
TABLE 1. Characteristics of office-based adult visits that involved a full-criteria or NOS psychiatric diagnosis, 1999–2010a
Characteristic1999–2002 (N=16,061)2003–2006 (N=18,921)2007–2010 (N=17,044)p
Full criteriaNOSFull criteriaNOSFull criteriaNOS
N%bN%bN%bN%bN%bN%b
Gender            <.001
 Female5,89557.03,62666.26,52857.24,63066.35,28956.54,48064.7 
 Male4,57143.01,96933.85,16342.82,60033.74,58343.52,69235.3 
Age group            <.001
 18–241,1049.35348.01,31510.58039.11,11211.18309.8 
 25–445,06044.82,62747.05,21141.43,12742.74,09540.92,98740.7 
 45–644,30245.82,43445.05,16548.13,30048.24,66548.13,35549.5 
Race-ethnicity            .370
 White7,94583.14,29283.38,55580.15,23281.36,98680.55,18480.2 
 Nonwhitec2,52116.91,30316.73,13619.91,99818.72,88619.51,98819.8 
Payment            <.001
 Private5,65567.13,19272.96,13864.93,75170.84,95265.03,74968.6 
 Publicd4,81132.92,40327.15,55335.13,47929.24,92035.03,42331.4 
Residence            .004
 Nonmetropolitan1,06812.764817.31,15511.590214.41,09212.689615.2 
 Metropolitan9,39887.34,94782.710,53688.56,32885.68,78087.46,27684.8 
Region            .282
 Northeast3,37727.31,74423.74,42826.32,64324.03,69325.62,34621.7 
 Midwest2,28520.61,24922.72,20919.91,48623.81,76621.41,56023.8 
 South2,80129.31,43830.42,75832.91,78833.72,69631.91,98635.9 
 West2,00322.81,16423.12,29620.81,31318.51,71721.11,28018.6 
a
NOS, not otherwise specified
b
Weighted column percentage
c
Black, Hispanic, Native American, Pacific Islander, Asian, or more than one race
d
Medicare, Medicaid, other government insurance, no charge, and unknown payment source

Proportion of NOS Visits Compared With Full-Criteria Visits
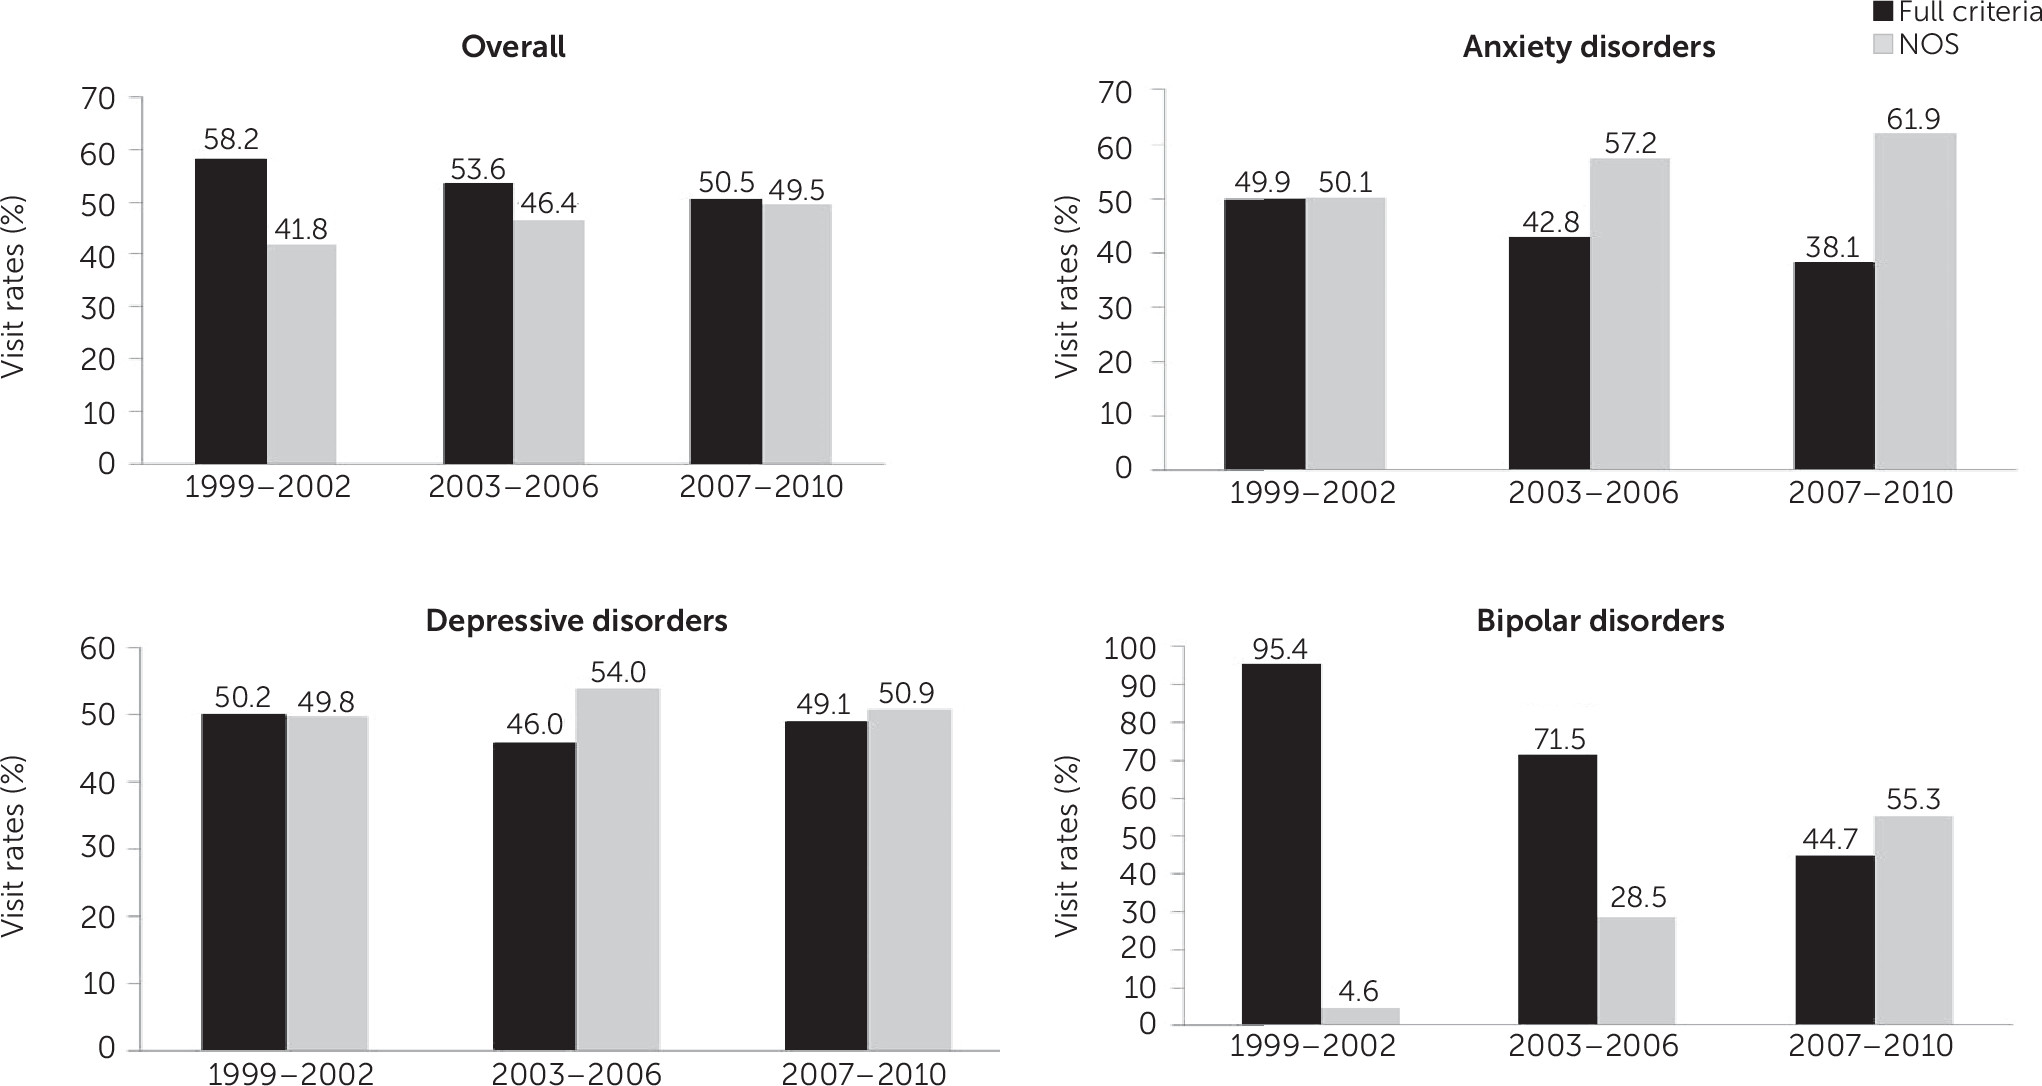
Overall, the proportion of all psychiatric visits with an NOS diagnosis increased significantly, from 41.8% in 1999–2002 to 49.5% in 2007–2010 (Figure 1). Bar graphs in Figure 1 also illustrate time trends in the proportion of visits with NOS versus full-criteria diagnoses for depressive, anxiety, and bipolar disorders. In 2007–2010, the most frequent NOS diagnostic visits, rank ordered by the weighted column percentage, were depressive disorders NOS (50.9%), anxiety disorders NOS (61.9%), and bipolar disorders NOS (55.3%). Significant weighted increases over the 12 years were found for anxiety disorders NOS (50.1% to 61.9%) and bipolar disorders NOS (4.6% to 55.3%). Mood disorder NOS also increased significantly from .4% to 1.8% (data not shown).
FIGURE 1. Office-based adult visits that involved a full-criteria or NOS psychiatric diagnosis, overall and for depressive, anxiety, and bipolar disorders, 1999–2010a
a NOS, not otherwise specified. For comparisons across 12 years: overall, χ2=25.2, df=2, p≤.001; depressive disorders, χ2=3.6, df=2, p=.16; anxiety disorders, χ2=19.1, df=2, p≤.001; bipolar disorders, χ2=195.7, df=2, p≤.001

Proportion of Visits by Physician Specialty

In 2007–2010, full-criteria diagnoses accounted for 65.3% of visits to psychiatrists, and NOS diagnoses accounted for 60.7% of visits to nonpsychiatrists (Table 2). Across 12 years, among all psychiatric visits, the proportion of NOS diagnoses increased significantly more for visits to psychiatrists than for visits to nonpsychiatrists (interaction p=.003). Only minor changes were noted in physician specialty for diagnoses of depressive and anxiety disorders over the 12-year period. However, NOS diagnoses of bipolar disorders increased substantially for both psychiatrists and nonpsychiatrists.
TABLE 2. Office-based adult visits that involved a full-criteria or NOS psychiatric diagnosis, by provider type, 1999–2010a
Characteristic1999–20022003–20062007–2010Interaction
Full criteriaNOSFull criteriaNOSFull criteriaNOS
N%bN%bN%bN%bN%bN%bpc
Total psychiatric visits            .003
 Psychiatrist3,20576.21,04923.83,29071.61,32128.42,61265.31,47534.7 
 Nonpsychiatrist1,05043.2118556.81,31739.71,70160.31,73239.32,32260.7 
Depressive disorders            .26
 Psychiatrist1,76577.054223.01,72978.149421.91,40575.149524.9 
 Nonpsychiatrist21825.667774.425520.895679.240627.91,10172.1 
Anxiety disorders            .81
 Psychiatrist73177.720922.375271.131928.962569.429430.5 
 Nonpsychiatrist11928.031172.013923.150676.921921.280678.8 
Bipolar disorders            .91
 Psychiatrist49696.920d3.158276.317323.739753.936546.1 
 Nonpsychiatrist6289.35d10.75155.96444.16022.919077.1 
a
NOS, not otherwise specified
b
Weighted column percentage
c
Weighted logistic regression was conducted with an interaction term for time period (2007–2010 versus 1999–2002) and physician specialty (psychiatrist versus nonpsychiatrist) to assess whether trends in NOS visits significantly differed between psychiatrists and nonpsychiatrists (p values associated with these interaction terms are shown).
d
Unweighted observations of <30 visits are unreliable.

Psychotropic Medication Classes in NOS and Full-Criteria Visits

In rank order, the psychotropic drug classes prescribed most commonly during visits in 2007–2010 were antidepressants, anxiolytics-hypnotics, antipsychotics, anticonvulsants–mood stabilizers, stimulants, lithium, and alpha-agonists. Table 3 shows that the use of any prescribed psychotropic medication class increased over the 12-year period for full-criteria visits (61.6% to 68.7%); the increase was significantly greater for NOS visits (62.7% to 75.2%); with the most prominent increase being stimulants (for both full criteria and NOS visits) . Over the 12-year period, a nearly threefold increase occurred in concomitant prescription of three or more medications during NOS visits (p<.001).
TABLE 3. Medication classes prescribed in office-based adult visits that involved a full-criteria or NOS psychiatric diagnosis and adjusted odds ratios for prescription of medication classesa
Psychotropic class1999–20022007–2010Logistic regressionb
Full criteriaNOSFull criteriaNOSFull criteriaNOS
N%cN%cN%cN%cAOR95% CIAOR95% CI
Any psychotropic3,07861.61,54262.74,85668.74,34175.21.41.2–1.71.91.6–2.2
Antipsychotics75613.71935.91,50817.21,10813.81.31.0–1.62.51.9–3.1
Antidepressants2,30445.41,18748.83,34646.23,00752.71.1.9–1.21.21.1–1.4
Anxiolytics and hypnotics1,04721.250220.21,82928.21,70333.41.51.3–1.72.01.7–2.4
Lithium1682.929d.61582.21351.7.8.6–1.12.81.9–4.1
Alpha-agonist16d.45d.164.852.81.91.0–3.65.63.0–10.5
Anticonvulsants–mood stabilizers3886.71353.779810.07199.31.51.2–2.02.62.1–3.4
Stimulants2414.4701.666311.73216.02.92.3–3.83.82.8–5.3
Combinations            
 1 drug class1,31160.380774.72,36352.92,32858.5    
 2 drug classes77730.531022.01,62734.81,39332.2    
 ≥3 drug classes2499.3593.365512.34779.3    
a
NOS, not otherwise specified
b
Adjusted odds ratios (AORs) indicate the likelihood of prescription in 2007–2010 compared with 1999–2002. Adjusted for age group, gender, race-ethnicity, payment type, region, and metropolitan residence. Multivariable logistic regression analyses were not conducted for psychotropic class combinations.
c
Weighted column percentage
d
Unweighted observations of <30 visits are unreliable.
To assess whether temporal increases in psychotropic medication class use were different for full-criteria visits than for NOS visits, a logistic regression analysis was conducted. The adjusted odds of use of any psychotropic medication class were greater for NOS visits than for full-criteria visits (Table 3). Significantly greater increases were noted for NOS visits compared with full-criteria visits. Adjusted odds of use of the various medication classes for NOS visits were as follows: antipsychotics, adjusted odds ratio (AOR)=2.5; anticonvulsants–mood stabilizers, AOR=2.6; and lithium, AOR=2.8. Because of the greater increase in the proportion of NOS visits during which a medication was prescribed compared with full-criteria visits, the proportional patterns of prescribing by psychotropic class during full-criteria visits and during NOS visits became similar by 2007–2010 (Table 3). In 2007–2010, concomitant prescribing of two or more classes characterized 47.1% of full-criteria visits and 41.5% of NOS visits (Table 3).

Discussion

The major findings in this national study of adult outpatient visits to physicians are that NOS psychiatric diagnoses increased significantly, from 41.8% of all psychiatric diagnoses in 1999–2002 to 49.5% in 2007–2010; findings for adults of a significant expansion in NOS psychiatric diagnoses from 1999 to 2000 replicated similar findings for youths (1). The most prominent proportional increases in NOS diagnoses from 1999 to 2010 were for mood disorders NOS, bipolar disorders NOS, and anxiety disorders NOS. NOS psychiatric diagnoses were far more commonly made by nonpsychiatrist physicians (57%–61% over the study period) than by psychiatrists (24%−35%); increases in prescribed psychotropic medication classes (particularly antipsychotics, lithium, and anticonvulsants–mood stabilizers) were greater over the 12-year study period for NOS visits than for full-criteria visits; and concomitant prescribing of two or more medication classes accounted for nearly half of all psychiatric visits regardless of type (full criteria or NOS).

Low Reliability of NOS Diagnoses

The reliability of NOS psychiatric diagnoses has been the subject of little research. In the DSM-5 field trials, the interrater reliability for subthreshold depressive, bipolar, and anxiety disorders were not reported. In one systematic study of primary care psychiatric diagnoses, the test-retest reliabilities for adults who were diagnosed as having anxiety disorder NOS (κ=.30) and minor depressive disorder (κ=.03) were far lower than for major depressive disorder (κ=.58) and any anxiety disorder (κ=.51) (13). Miller and colleagues (14) reported a similar low statistical agreement for subthreshold diagnoses.

Utility and Limitations of NOS Diagnoses

Subthreshold diagnoses can serve important functions in medical practice. The NOS diagnostic subtype can indicate the following: the patient has less extensive symptomatology, the evaluation is incomplete, the physician is uncertain about the etiology of the symptoms, and the diagnosis can be completed later in a more comprehensive way. However, if NOS diagnoses are final, one result is a loss of clinical information for the researcher (6). For example, if two patients are each diagnosed as having depressive disorder NOS on the basis of meeting two criteria, it is possible that the two criteria supporting each NOS diagnosis are not the same.

Can NOS Diagnoses Increase Further?

In all likelihood, the proportion of NOS psychiatric diagnoses will increase in the future. Lewinsohn and colleagues (15) in their assessment of older adolescents and young adults (N=1,704) found that 53% met criteria for one or more subthreshold DSM psychiatric disorders. Olfson and colleagues (2) found that 30% of selected adults in a health maintenance organization merited an NOS psychiatric diagnosis. Kessler and coauthors (16) reported that the lifetime prevalence of having a psychiatric disorder is over 50% and that 40% of such psychiatric diagnoses are mild (17), which commonly characterizes NOS diagnoses rather than full-criteria diagnoses (1820). Paris (21) commented that “admitting subclinical phenomena into a classification system is a very slippery slope. The lifetime prevalence of mental disorders could easily come to approach 100%.”

Consequences of the Rise in NOS Psychiatric Diagnoses

Finding that 50% of recorded psychiatric diagnoses for adults did not meet full DSM-IV criteria in 2007–2010 does not bode well for researchers aiming for more diagnostic reliability. This lack of diagnostic precision may frustrate efforts by the lead framers of DSM-5 to gradually shift psychiatric nomenclature to measurable dimensional criteria (22).

NOS Diagnoses and Psychotropic Medications

In research studies, there is no substantive evidence that psychotropic medications (mainly based on studies with antidepressants) are effective for NOS psychiatric disorders (2325). Furthermore, because U.S. Food and Drug Administration indications for psychotropic medication treatment are exclusively based on full-criteria clinical trial data, persons with NOS diagnoses who are prescribed psychotropic medication are being treated off label. Thus they do not have the benefit of data from randomized placebo-controlled trials. Nonetheless, the prevalence of medication use for mental health conditions continues to increase in the United States, and it is not surprising that such medication increases tend to rise in tandem with increases in related diagnoses, whether NOS or full criteria (26).

NOS Diagnoses and Provider Specialty

In most primary care clinical studies of adults, the most common psychiatric diagnosis is one that does not meet full criteria (2,3,27,28). Why NOS diagnoses are more common in primary care practice is not clear (29). In our study, nonpsychiatrist medical practitioners accounted for nearly two-thirds of NOS diagnosis visits in recent years. Although NOS psychiatric diagnoses increased for both psychiatrists and nonpsychiatrists over the 12-year study period, they increased more for psychiatrists (23.8% to 34.7%). Psychotropic medication prescribing in 2007–2010 by primary care practitioners was more than three times greater than prescribing by psychiatrists. This difference parallels the findings of Olfson and colleagues (30) and Mark and colleagues (31).

Limitations

This study had several limitations. First, NAMCS and NHAMCS survey analyses are based on outpatient physician visits—patients are not the unit of analysis. Second, diagnoses in the NAMCS and NHAMCS are based on the judgment of treating physicians rather than on a research-level assessment. Third, information was not available concerning psychotropic medication dosage and duration of use. Fourth, the details on severity and treatment response associated with NOS diagnoses could not be assessed from the available data. Finally, in this study, eight NOS diagnosis codes (ICD-9 CM codes) for visits were excluded because they could not be matched with DSM-IV codes. Use of the term NOS to generally represent DSM-IV NOS categories is incomplete to a minor extent because several DSM-IV diagnoses do not fit within ICD-9-CM codes. Fortunately, these exclusions accounted for less than 5% of total psychiatric visits.

Conclusions

Psychiatric NOS diagnoses have become the major diagnoses in adult outpatient treatment, particularly for bipolar, depressive, and anxiety disorders, and NOS diagnoses are currently associated with similar proportions of prescribed psychotropic medication for NOS diagnoses as for full-criteria psychiatric diagnoses. The data presented here document how DSM-IV has been used in clinical practice over a recent 12-year period. The steady increase in psychiatric NOS/unspecified diagnoses could be a wake-up call for those contemplating further DSM-5 diagnostic improvements, and the increase may lead to change (32). If NOS psychiatric diagnoses cannot be reduced, it may be preferable to subdivide unspecified DSM-5 diagnoses by severity.

Supplementary Material

File (appi.ps.201500045.ds001.pdf)

References

1.
Safer DJ, Rajakannan T, Burcu M, et al: Trends in subthreshold psychiatric diagnoses for youth in community treatment. JAMA Psychiatry 72:75–83, 2015
2.
Olfson M, Broadhead WE, Weissman MM, et al: Subthreshold psychiatric symptoms in a primary care group practice. Archives of General Psychiatry 53:880–886, 1996
3.
Wittchen H-U, Höfler M, Meister W: Prevalence and recognition of depressive syndromes in German primary care settings: poorly recognized and treated? International Clinical Psychopharmacology 16:121–135, 2001
4.
Rucci P, Gherardi S, Tansella M, et al: Subthreshold psychiatric disorders in primary care: prevalence and associated characteristics. Journal of Affective Disorders 76:171–181, 2003
5.
Dziegielewski SF: DSM-IV-TR in Action. New York, Wiley, 2010
6.
First MB: Clinical utility in the revision of the Diagnostic and Statistical Manual of Mental Disorders (DSM). Professional Psychology, Research and Practice 41:465–473, 2010
7.
Pincus HA, Davis WW, McQueen LE: “Subthreshold” mental disorders: a review and synthesis of studies on minor depression and other “brand names.” British Journal of Psychiatry 174:288–296, 1999
8.
National Ambulatory Medical Care Survey (NAMCS): Public-Use Data Files and Documentation. Atlanta, Centers for Disease Control and Prevention, National Center for Health Statistics. Available at www.cdc.gov/nchs/ahcd/ahcd_questionnaires.htm#public_use. Accessed June 16, 2014
9.
National Hospital Ambulatory Medical Care Survey (NHAMCS): Public-Use Data Files and Documentation. Atlanta, Centers for Disease Control and Prevention, National Center for Health Statistics. Available at www.cdc.gov/nchs/ahcd/ahcd_questionnaires.htm#public_use. Accessed June 16, 2014
10.
National Ambulatory Healthcare Data: Public-Use Data Files and Documentation. Atlanta, Centers for Disease Control and Prevention, National Center for Health Statistics. Available at www.cdc.gov/nchs/ahcd/ahcd_data_collection.htm#public_use. Accessed June 16, 2014
11.
Covered Diagnoses and Crosswalk of DSM-IV Codes to ICD-9-CM codes. Washington, DC, American Psychological Association, 2002. Available at www.apapracticecentral.org/reimbursement/billing/dsmiv-to-icd9cm-codes-chart.pdf
12.
DSM-IV to ICD-9 Codes Matrix. Los Angeles, County of Los Angeles, Department of Mental Health, 2008. Available at www.lacdmh.lacounty.gov/hipaa/downloads/DSM-IVtoICD-9CodesMatrix.pdf
13.
Bakker IM, Terluin B, van Marwijk HW, et al: Test-retest reliability of the PRIME-MD: limitations in diagnosing mental disorders in primary care. European Journal of Public Health 19:303–307, 2009
14.
Miller CJ, Klugman J, Berv DA, et al: Sensitivity and specificity of the Mood Disorder Questionnaire for detecting bipolar disorder. Journal of Affective Disorders 81:167–171, 2004
15.
Lewinsohn PM, Shankman SA, Gau JM, et al: The prevalence and co-morbidity of subthreshold psychiatric conditions. Psychological Medicine 34:613–622, 2004
16.
Kessler RC, Berglund P, Demler O, et al: Lifetime prevalence and age-of-onset distributions of DSM-IV disorders in the National Comorbidity Survey Replication. Archives of General Psychiatry 62:593–602, 2005
17.
Kessler RC, Chiu WT, Demler O, et al: Prevalence, severity, and comorbidity of 12-month DSM-IV disorders in the National Comorbidity Survey Replication. Archives of General Psychiatry 62:617–627, 2005
18.
Meeks TW, Vahia IV, Lavretsky H, et al: A tune in “a minor” can “b major”: a review of epidemiology, illness course, and public health implications of subthreshold depression in older adults. Journal of Affective Disorders 129:126–142, 2011
19.
Bader CD, Dunner DL: Bipolar disorder not otherwise specified in relation to the bipolar spectrum. Bipolar Disorders 9:860–867, 2007
20.
Pini S, Perkonnig A, Tansella M, et al: Prevalence and 12-month outcome of threshold and subthreshold mental disorders in primary care. Journal of Affective Disorders 56:37–48, 1999
21.
Paris J: The Intelligent Clinician's Guide to the DSM-5. Oxford, United Kingdom, Oxford University Press, 2013
22.
Kupfer DJ: Dimensional models for research and diagnosis: a current dilemma. Journal of Abnormal Psychology 114:557–559, 2005
23.
Barbui C, Cipriani A, Patel V, et al: Efficacy of antidepressants and benzodiazepines in minor depression: systematic review and meta-analysis. British Journal of Psychiatry 198(suppl 11):11–16, 2011
24.
Cameron IM, Reid IC, MacGillivray SA: Efficacy and tolerability of antidepressants for sub-threshold depression and for mild major depressive disorder. Journal of Affective Disorders 166:48–58, 2014
25.
Fournier JC, DeRubeis RJ, Hollon SD, et al: Antidepressant drug effects and depression severity: a patient-level meta-analysis. JAMA 303:47–53, 2010
26.
Olfson M, Blanco C, Wang S, et al: National trends in the mental health care of children, adolescents, and adults by office-based physicians. JAMA Psychiatry 71:81–90, 2014
27.
Haller H, Cramer H, Lauche R, et al: The prevalence and burden of subthreshold generalized anxiety disorder: a systematic review. BMC Psychiatry 14:128, 2014
28.
Jackson JL, Passamonti M, Kroenke K: Outcome and impact of mental disorders in primary care at 5 years. Psychosomatic Medicine 69:270–276, 2007
29.
Gardner W, Kelleher KJ, Pajer KA, et al: Primary care clinicians’ use of standardized psychiatric diagnoses. Child: Care, Health and Development 30:401–412, 2004
30.
Olfson M, Kroenke K, Wang S, et al: Trends in office-based mental health care provided by psychiatrists and primary care physicians. Journal of Clinical Psychiatry 75:247–253, 2014
31.
Mark TL, Levit KR, Buck JA: Datapoints: psychotropic drug prescriptions by medical specialty. Psychiatric Services 60:1167, 2009
32.
First MB, Bhat V, Adler D, et al: How do clinicians actually use the Diagnostic and Statistical Manual of Mental Disorders in clinical practice and why we need to know more. Journal of Nervous and Mental Disease 202:841–844, 2014

Information & Authors

Information

Published In
Go to Psychiatric Services

Cover: Bowl, by Louis Comfort Tiffany, circa 1908. Favrile glass. Gift of Louis Comfort Tiffany Foundation, 1951 (51.121.13). Metropolitan Museum of Art, New York City. Image copyright © The Metropolitan Museum of Art. Image source: Art Resource, New York City.

Psychiatric Services
Pages: 289 - 295
PubMed: 26567936

History

Received: 1 February 2015
Revision received: 4 April 2015
Revision received: 2 May 2015
Accepted: 4 June 2015
Published online: 16 November 2015
Published in print: March 01, 2016

Authors

Details

Thiyagu Rajakannan, Ph.D.
Dr. Rajakannan, Mr. Burcu, and Dr. Zito are with the Department of Pharmaceutical Health Services Research, University of Maryland School of Pharmacy, Baltimore. Dr. Zito is also with the Department of Psychiatry, University of Maryland School of Medicine, Baltimore. Dr. Safer is with the Department of Psychiatry and Pediatrics, Johns Hopkins University School of Medicine, Baltimore. Send correspondence to Dr. Safer (e-mail: [email protected]).
Daniel J. Safer, M.D.
Dr. Rajakannan, Mr. Burcu, and Dr. Zito are with the Department of Pharmaceutical Health Services Research, University of Maryland School of Pharmacy, Baltimore. Dr. Zito is also with the Department of Psychiatry, University of Maryland School of Medicine, Baltimore. Dr. Safer is with the Department of Psychiatry and Pediatrics, Johns Hopkins University School of Medicine, Baltimore. Send correspondence to Dr. Safer (e-mail: [email protected]).
Mehmet Burcu, M.S.
Dr. Rajakannan, Mr. Burcu, and Dr. Zito are with the Department of Pharmaceutical Health Services Research, University of Maryland School of Pharmacy, Baltimore. Dr. Zito is also with the Department of Psychiatry, University of Maryland School of Medicine, Baltimore. Dr. Safer is with the Department of Psychiatry and Pediatrics, Johns Hopkins University School of Medicine, Baltimore. Send correspondence to Dr. Safer (e-mail: [email protected]).
Julie Magno Zito, Ph.D.
Dr. Rajakannan, Mr. Burcu, and Dr. Zito are with the Department of Pharmaceutical Health Services Research, University of Maryland School of Pharmacy, Baltimore. Dr. Zito is also with the Department of Psychiatry, University of Maryland School of Medicine, Baltimore. Dr. Safer is with the Department of Psychiatry and Pediatrics, Johns Hopkins University School of Medicine, Baltimore. Send correspondence to Dr. Safer (e-mail: [email protected]).

Competing Interests

The authors report no financial relationships with commercial interests.

Metrics & Citations

Metrics

Citations

Export Citations

If you have the appropriate software installed, you can download article citation data to the citation manager of your choice. Simply select your manager software from the list below and click Download.

For more information or tips please see 'Downloading to a citation manager' in the Help menu.

Format
Citation style
Style
Copy to clipboard

View Options

View options

PDF/EPUB

View PDF/EPUB

Login options

Already a subscriber? Access your subscription through your login credentials or your institution for full access to this article.

Personal login Institutional Login Open Athens login
Purchase Options

Purchase this article to access the full text.

PPV Articles - Psychiatric Services

PPV Articles - Psychiatric Services

Not a subscriber?

Subscribe Now / Learn More

PsychiatryOnline subscription options offer access to the DSM-5-TR® library, books, journals, CME, and patient resources. This all-in-one virtual library provides psychiatrists and mental health professionals with key resources for diagnosis, treatment, research, and professional development.

Need more help? PsychiatryOnline Customer Service may be reached by emailing [email protected] or by calling 800-368-5777 (in the U.S.) or 703-907-7322 (outside the U.S.).
Media

Figures

Other

Tables

Share

Share

Share article link

Share