An increase in the number of emergency department (ED) visits in the presence of decreasing resources is a well-documented trend (
1). Visits for psychiatric emergencies appear to be increasing at an even faster rate than emergency visits overall, and reports of patient boarding and ED overcrowding have become common (
2). Overcrowding can lead to dissatisfaction among patients and staff and contribute to poorer outcomes (
3). Approaches to alleviate these problems include accelerated care at triage (
4), use of surge personnel (
5–
7), and the addition of holding units (
8). However, hospitals may not have adequate space or finances to significantly expand resources, so methods to reliably predict the utility of expanding capacity prior to making such choices can be invaluable.
Health care systems increasingly utilize computer simulations to test proposed changes (
9) because they offer a variety of benefits compared with flow analyses based on averages. Although it may be self-evident, patient arrival rate and clinical effort needed to treat each patient can be highly variable. The impact of these deviations on patient flow can produce large delays that skew the amount of time patients spend waiting during various phases of care. Unfortunately, averages smooth over these skews, hiding events that significantly contribute to delays in the flow of patients. Computer simulations can also reveal the limits of proposed interventions (
10,
11). Some interventions to improve patient flow fail because they inadvertently shift a bottleneck from one phase of care to another. Periods of ED overcrowding commonly increase the delay from triage to placement into an ED bed (
12,
13). Yet adding beds without a concomitant increase in staff may simply shift the delay from waiting at triage to waiting somewhere else (
14). Overcrowding in the ED can cause patients to remain in a hallway or other area not designed for patient care, requiring the use of additional resources—such as portable cardiac monitors and clinical or support staff—that may be in limited supply.
Statistical models of patient flow allow calculation of outcomes for various scenarios and predict the effects of proposed changes to the system (
15). Queuing models, a variant of statistical models of patient flow, permit greater attention to the specific steps in a process that potentially introduce delay. Queuing models can predict patient overflow, waiting room capacity needed for surge volumes (
16), staffing needed to match volume fluctuations during specific times of day or days of the week (
17), and effects of assigning variable priority to patients (
18–
20). Queuing models can be used to adjust ED staffing or number of beds to maximize resource utilization (
21). Planning based on patient volume averages, on the other hand, may miss back-ups caused by irregular patient volume. [A user-friendly example of the limitations of using averages to model ED processes during a prototypical day is available as an
online supplement to this article.]
The psychiatric emergency service (PES) of the nonprofit university hospital in this study had reached a capacity that routinely strained facilities originally designed to treat half the current volume. Patients overflowed into nonpsychiatric areas such as the main ED and hallways, wait time to see a provider had increased, and length of stay for all patients had increased, especially for those awaiting hospitalization. Because the number of available inpatient beds restricted patient outflow, it was not obvious that expanding PES resources would significantly reduce patient wait times. We therefore chose a queuing analysis to model patient flow in the PES, aiming specifically to assess the effects of adding another licensed independent practitioner.
Methods
Clinical Facilities
The PES consists of 12 beds in a locked area designated for psychiatric evaluations within a university hospital ED that has approximately 7,500 psychiatric patient visits per year. The ED triage nurses screen all patients upon their arrival. Persons with acute general medical concerns receive treatment in the ED prior to placement in the PES. Those with acute behavioral disturbances are also medicated, restrained, or both prior to arriving in the PES. During weekdays, clinical coverage includes an attending psychiatrist, an advanced practice registered nurse (APRN), and a junior resident. An attending psychiatrist and an APRN continue coverage throughout the evening. An attending psychiatrist and senior resident cover the overnight shifts (midnight to 8 a.m.) and weekends, although one to two additional providers are available for volume surges.
Patients requiring hospitalization are typically admitted within the same university hospital system, which includes 50 beds for general adult populations, 15 beds for adolescents (14–18 years), and eight beds for persons over 60 years old.
We collected data on patient flow over a period of two months. Using these data, we calibrated a discrete-event simulation model of the PES process.
Figure 1 provides a schematic illustration of the patient flow through the PES. All patients undergo an initial screening by a registered nurse and then wait for a provider to become available for full evaluation on a first come, first served basis. The management of behavioral disturbances or acute medical problems prior to transfer to the PES eliminated the need to build variable acuity into this model. The potential outcomes of evaluation include further observation, admission to an inpatient psychiatric bed, or discharge from the ED. Each of these outcomes involves some delay. For the purposes of our model, further observation while the patient awaits evaluation is treated as a delay. Patients who need hospital admission wait until a bed is available and a transfer to an inpatient unit can be arranged. Patients being discharged often need to wait for someone to collect them and take them home. Time spent by physicians visiting existing patients during rounds is excluded from the schematic. Contact with patients during rounds is generally brief but can add delays if the unit is very congested.
For the purposes of modeling, we assumed that patient evaluation and documentation took two hours for APRNs (who work independently) and for attending psychiatrists who were not supervising a resident. Evaluation by an attending psychiatrist would take approximately 38% (3.25 hours) longer if he or she were supervising a junior resident. For simplicity, the model uses the notation “provider” to represent a clinician who works independently and completes a new patient evaluation with documentation in two hours. Evaluations include a physical exam, orders, and a comprehensive psychiatric assessment that can also serve as the admission documentation should the patient be admitted. A reevaluation of a patient who was under observation was assumed to take an additional 45 minutes. These times were chosen based on individual time logs kept by the clinicians during the period of data collection and retrospective review of the electronic medical record.
Simulation Model
Using MATLAB programming language, we constructed a simulation model to mimic the patient flow depicted in
Figure 1. We broke the day into four-hour blocks starting at midnight. For each block, we modeled the number of patients arriving as a Poisson random variable (assumes patients arrive independently of each other) by using rates derived from the data on actual patient arrival patterns. After evaluation, patients were assigned to one of three categories (observation, admission, or discharge) by using a random draw based on the rates observed in the data. We modeled the delay in discharge as a geometric process in which a random draw determines whether a patient gets discharged, a process that reflects the chance that discharge will occur successfully after a fixed number of time periods. We modeled delay in admission to the hospital by using a binomial random variable that indicates how many beds have become available in a particular time block. The time spent by providers evaluating patients was taken as deterministic (fixed). Although in practice there is random variation across patients and providers in the length of evaluation, this variable was difficult to survey accurately from our electronic medical record and was not believed to be as significant as the variations in patient arrival patterns.
Using the base level of staffing in the PES, the simulation model generated sojourn times for the unit that were fairly close to those seen in practice. In the simulation, patients who were eventually discharged spent an average of 13 hours and 41 minutes in the unit. This compared with 14 hours (range 11 minutes to 105 hours) for actual discharged patients. The simulation yielded average lengths of stay of 38 hours and 3 minutes for patients who were ultimately admitted to the hospital, compared with 33 hours and 24 minutes (range 54 minutes to 99 hours and 18 minutes) for actual patients. The general agreement of these performance measures with the empirical values gave us confidence that the effect of resource changes on simulated results would translate to real effects in practice.
The model was then employed to test the addition of .5 to three providers on various measures of patient flow. Addition of a half-time provider was modeled as the presence of a full-time provider for a four-hour shift. The scheduling of additional providers was evaluated for all possible four-hour time blocks and the results shown for the time block representing the greatest performance benefit.
Results
The PES treated an average of 17 patients per 24-hour period (range four to 29 patients). Patients stayed an average of 20 hours and 31 minutes. The median length of stay was 14 hours and 48 minutes. After initial evaluation, approximately 25% of patients were assigned to further observation, 35% were determined to need admission to the hospital, and the rest were deemed fit for discharge. Of the patients initially assigned to observation, a similar fraction (35%) required hospitalization once reevaluated, whereas the remainder were discharged. During the study period, no patients were admitted or reevaluated between midnight and 8 a.m.
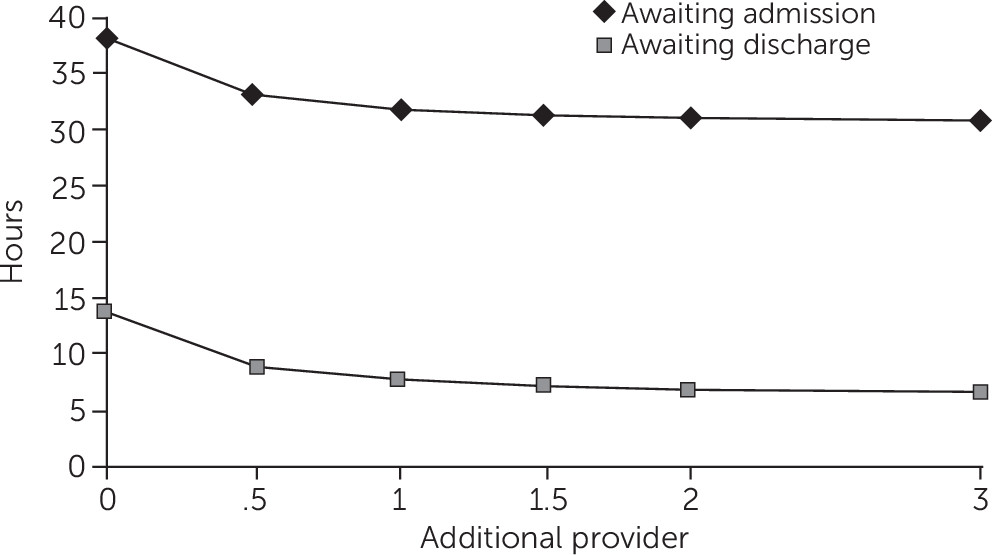
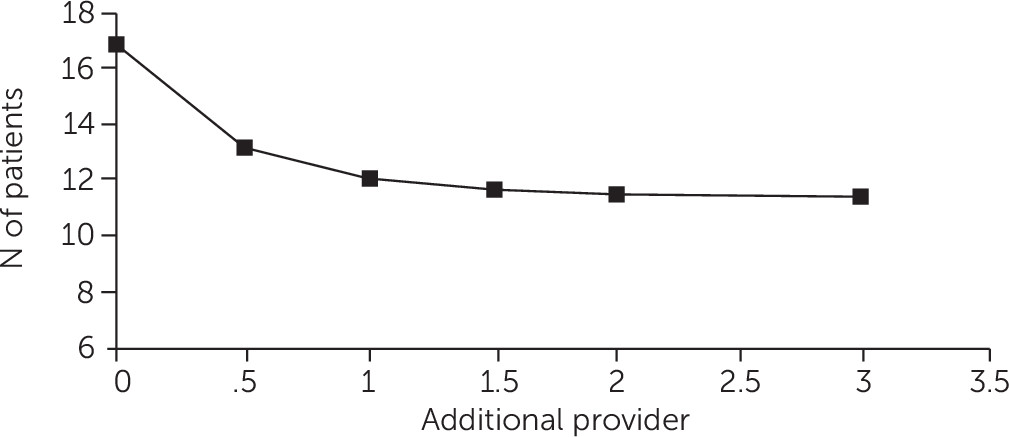
Figure 2 shows the modeled effects on patient length of stay from adding .5 to three additional providers during the hours of 8 a.m. and 4 p.m., given that additional staff during this time block showed the greatest benefit to length of stay. Addition of a half-time provider reduced the average length of stay for a patient awaiting hospitalization from 38.1 hours to 33.2 hours. Patients who were eventually discharged experienced a reduction in average length of stay from 13.7 to 8.9 hours. The difference between average length of stay for those who were admitted and those who were discharged was approximately 24 hours. Adding more than one provider showed minimal effect on the length of stay for either group. The effects of adding staff on the number of patients who occupied the PES between 8 a.m. and 4 p.m. are depicted in
Figure 3. Addition of a half-time provider showed the largest reduction in patient volume (from 17 to 13 patients). Similar to results for length of stay, addition of more than one provider failed to reduce the average number of patients below 12.
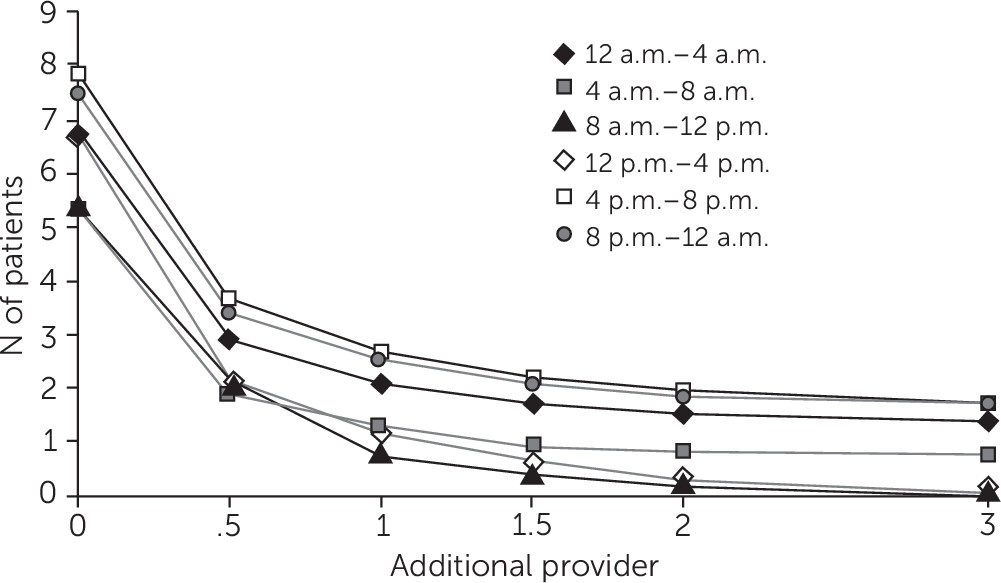
Addition of staff also reduced the number of new patients waiting to be seen by a provider (
Figure 4). Although providers were added only between 8 a.m. and 4 p.m., reductions in patient waits appeared across all the remaining time points. The largest decrease was observed with the addition of a half-time provider, with a tapering effect beyond the addition of 1.5 to two providers. The addition of a half-time provider between the hours of 8 a.m. and 4 p.m. predicted a reduction in the number of patients waiting to be seen by two-thirds. However, the benefit of this additional daytime staffing continued to accrue, with reductions of at least 50% for the remaining four-hour time blocks. This outcome is consistent with Little’s law (
22), which states that census is related to arrival rates and length of stay and implies that wait times decrease when there are fewer patients ahead in line.
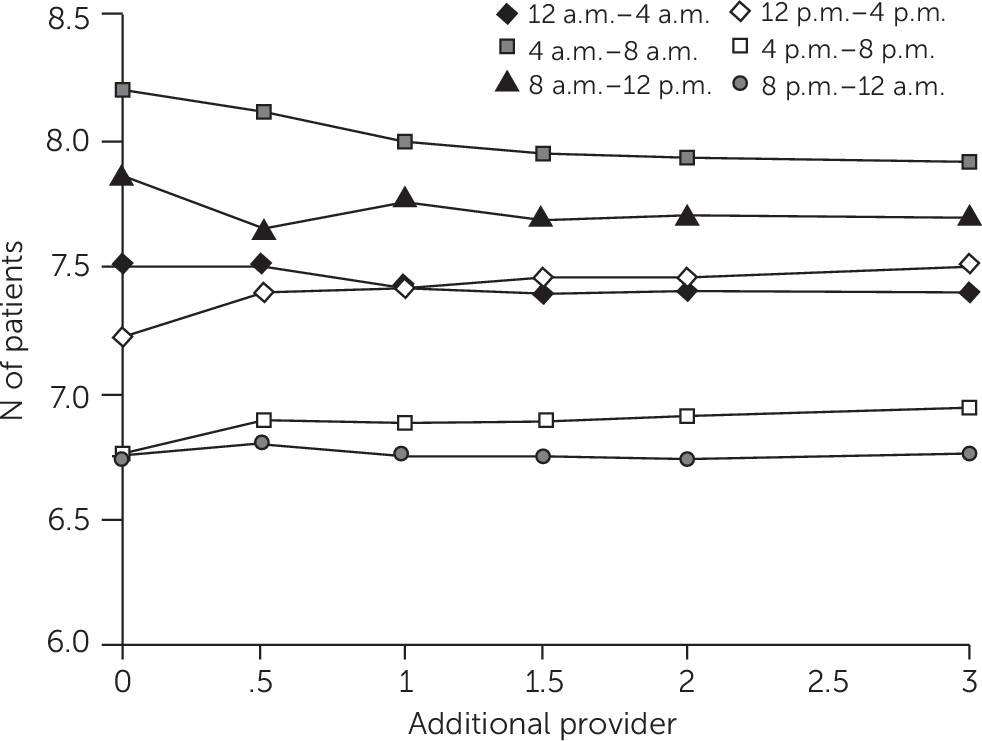
Figure 5 shows the effects of additional clinical staffing on the number of patients awaiting inpatient hospitalization. The average number of patients who remained in the PES awaiting inpatient hospitalization after completion of their evaluation was highest during the time blocks from 4 a.m. to 8 a.m. (8.2 patients) and from 8 a.m. to noon (7.9 patients). The lowest average patient volumes (6.8 patients) occurred between 4 p.m. and 8 p.m. and between 8 p.m. and midnight. Although it appeared additional provider staffing was associated with a slight reduction in the number of patients waiting in the PES between 4 a.m. and 8 a.m. and between 8 a.m. and noon, this modest effect disappeared during the remaining time blocks.
Discussion
This simulation model analysis demonstrates adding clinicians improves several measures of patient flow: reduced overall length of stay, reduced numbers of patients in the PES, and reduced time waiting to see a provider. Although this finding might seem obvious, the model unexpectedly showed that the most dramatic improvements occurred with the addition of only a half-time provider (one provider for a half-shift, or four hours). Very little benefit was predicted from adding further staff. This finding shows that relatively small increases in provider time can vastly improve service, especially during periods of high workload.
Addition of staff beyond a certain threshold failed to improve the flow metrics for several possible reasons. The number of additional clinicians can exceed the number of patients waiting. Moreover, certain constraints that prolong length of stay remain outside the control of the PES. For example, the psychiatric hospital typically does not discharge patients at night, so beds may be unavailable. Other after-hours constraints include difficulty reaching outpatient clinicians who could provide collateral information, refusal by residential facilities to accept return of a patient because of reduced nightly staffing, and inability of inpatient substance treatment programs to accept patients after hours. Intoxicated patients are also more likely to arrive in the ED at night, and awaiting their sobriety prolongs length of stay.
Surprisingly, length of stay decreased for both patients awaiting hospitalization and those who were eventually discharged. Prior to simulation, we predicted that length of stay would decrease among discharged patients but would remain relatively stable for patients awaiting hospitalization. The benefit to both groups can be explained in part by shortened wait times to see a provider. However, determining before nightfall whether patients require hospitalization may also confer significant benefit, given that a timely decision can prevent an overnight wait for admission. Thus a short reduction in the delay in evaluation can have a large impact on length of stay.
Improved patient flow can achieve a number of benefits beyond relieving patient and staff frustration (
23). Increased time spent waiting to see a provider is also associated with increased “reneging” (patients leaving without being seen) (
24), which in turn can affect patient outcome (
25,
26), disproportionately so among poor or uninsured patients (
27), and potentially reduce hospital income (
28). Even for patients who remain for an evaluation, increased wait times can decrease compliance with outpatient referrals (
29–
31). ED administrators, professional associations, and governmental groups all advocate for improving quality measures of patient flow (
32,
33). Queuing models offer the possibility to examine minimal but targeted changes to improve patient flow and decrease crowding.
Queuing models also can predict the effects of improved efficiency at critical bottlenecks. Reducing the amount of time physicians spend with each patient could potentially achieve the same benefits as adding personnel. Our findings suggest that making small improvements in clinician efficiency or modification of existing staffing, rather than investing in expensive upgrades, such as expanding the number of beds, could dramatically improve patient flow. It might be reasonable to reduce documentation requirements, reduce redundancy in evaluations, and redistribute data collection to other personnel, such as psychiatric nurses or licensed clinical social workers (LCSWs). Efforts to speed hospital discharges could be achieved by educating staff in discharge planning, adjusting times for patient rounds, or scheduling social workers or other staff critical to disposition planning to hours that better facilitiate earlier discharge. Computer modeling suggests that relatively small changes, such as moving hospital discharges four hours earlier in the day, can completely eliminate ED boarding (
34).
The schedule of trainee supervision during the day could also be adjusted on the basis of a queuing simulation model. Because psychiatric residents in the PES evaluate patients at a slower rate and their attending physicians sacrifice clinical time to supervise them, the model could be used to predict when resident supervision best fits with patient flow. One could also compare patient flow metrics while using a host of possible staffing combinations, such as using only licensed independent practitioners (APRNs or psychiatrists), using APRNs to supervise LCSWs, or using psychiatrists to supervise LCSWs and psychiatric residents, in order to find the most productive combination of staffing.
One of the biggest limitations of using queuing simulation to model psychiatric patient flow is the extent to which variability in service time is affected by time of day. As described above, patients who are treated after regular business hours face a number of obstacles slowing their eventual hospitalization or discharge, most of which are beyond the control of PES. This disparity between length of stay during day and night shifts can be modeled by the simulation, but practical solutions based on such modeling may be elusive. Another limitation common to ED flow analysis is the paucity of data on provider time required for each step in the evaluation process. In order to address this potential limitation, the PES clinicians kept daily logs of the time they spent in various stages of patient treatment during the period of data collection analyzed in this study. When possible, the electronic medical record was used to confirm these estimates. Additional constraints, such as patient level of acuity, may also need to be added to the model. Although psychiatric patients in our PES were evaluated on a first come, first served basis, a format already compatible with queuing analysis, general medical EDs may need a more elaborate modeling system with different acuity tracks.
This study was limited by the relatively short period of data collection that was used for model inputs and calibration. However, we would not expect a longer period of data collection to alter the qualitative insight that limited addition of staff provides benefit to the system, given that many of the system constraints (time of day for hospital discharges and availability of collateral sources of information) remain constant.
Conclusions
Our analysis showed that a modest increase in staffing (a half-time provider) between 8 a.m. and 4 p.m. produces benefits to the system that should continue beyond the hours during which the provider is scheduled. As patients enter the queue faster during the 8 a.m. to 4 p.m. shift, the queue should be shorter, so those arriving later must no longer wait behind as many patients who had arrived previously. The volume of patients waiting in the PES would also decline, so they could be expected to generate fewer spontaneous requests for nicotine, medications, and other items, further freeing up clinician time. The model also revealed a limit to the benefit of adding staff, which was probably related to the limited availability of hospital beds. Using the simulation model helped elucidate the bottlenecks in this system and predict the potential effects of changes prior to commitment of resources.

