Recent studies have raised alarming concerns about increasing levels of psychological distress among adults in the United States (
1,
2). Implementation of the Patient Protection and Affordable Care Act (ACA) and of recommendations by the United States Preventive Services Task Force to screen adults for depression may address the mental health needs of adults in the United States (
3,
4). Given these recent events, it is both timely and relevant to examine baseline patterns of health care access and utilization among adults with and without serious psychological distress (SPD).
Research conducted with the National Health Interview Survey (NHIS) prior to full ACA implementation provided an examination of variations in health care access among adults with and without SPD. These studies, now more than a decade old, demonstrated that compared with adults without SPD, adults with SPD had an increased risk of forgoing health care and prescription medications because of cost and were more likely to be uninsured (
5). Adults with SPD were also more likely to exhibit greater nonadherence to mental health care (
5–
7). More recent data from the 2009–2013 NHIS found a similar lack of health insurance coverage among adults with SPD compared with adults without SPD (
8). That is notable given that a lack of adequate health insurance has been identified as an important barrier to care (
9). Yet earlier reports also showed that despite being more likely to lack health insurance coverage, adults with SPD visited doctors more frequently than adults without SPD (
5,
6).
It is important to evaluate differences in utilization among adults with and without SPD by using current baseline data during the early stages of ACA implementation. Our hypothesis was that SPD represents a risk factor for experiencing health care barriers independent of risk associated with other chronic health conditions. This study offered a broad-based, updated, and timely examination of health care access and utilization among adults with SPD compared with the general population and adults with other chronic health conditions.
Methods
Data Source and Analytic Sample
Data from the NHIS, including full years of data for 2006–2014, were used for this analysis. The NHIS is conducted by the Centers for Disease Control and Prevention’s National Center for Health Statistics and collects information through home-based interviews. The NHIS yields estimates representative of the civilian noninstitutionalized U.S. population (
10). This analysis was based on the sample adult questionnaire administered to one randomly selected adult in each family (
10,
11). Informed consent is obtained prior to interview. Institutional review board approval was not required because the data are deidentified and publicly available. We combined responses across 2006–2014 survey years to ensure adequate sample size and greater statistical power for examining SPD and health care indicators surrounding years of ACA’s implementation (
12). Our sample included adults ages 18 to 64, with and without SPD. We excluded adults ages 65 and older because of Medicare eligibility, a default government insurance not universally available to younger adults.
Measurement of SPD
SPD was measured with the Kessler Psychological Distress Scale (K6), a validated scale that identifies persons with a high likelihood of having a diagnosable mental health problem severe enough to cause moderate to serious impairment in social or occupational functioning requiring treatment (
13–
17). The K6 asks respondents to indicate the frequency of six symptoms by answering the following questions—“During the past 30 days, how often did you feel, as follows: so sad that nothing could cheer you up; nervous; restless or fidgety; hopeless; that everything was an effort; and worthless?” The following options are given to indicate frequency: all of the time, most of the time, some of the time, a little of the time, and none of the time. In keeping with this methodology, we reversed the coding of responses so that ‘‘none of the time’’ was scored as 0 and ‘‘all of the time’’ was scored as 4, with a total possible score of 0 to 24. Prior studies used a score of 13 or above as a validated cut point for SPD. Scores of 13 or above were coded 1 for SPD, and lower scores were coded 0 for no SPD (
13–
17).
Health Care Access and Utilization and Functional Indicators
We considered health insurance coverage (health coverage) to be an indicator of health care access. A variable called health coverage type grouped insurance coverage as Medicaid, private insurance, Medicaid and private insurance, and no coverage. Private insurance was defined as coverage obtained through employers or unions or purchased directly by the consumer. Public insurance was defined as a Medicaid insurance plan. Persons without private or public insurance were considered uninsured. Some adults had both private and Medicaid coverage.
Health care utilization was measured by the following indicators: inability to get needed prescription drugs because of a lack of money (insufficient money to buy medications), delay in health care (delay in care), not getting needed medical care in the past 12 months because the patient could not afford it (insufficient money for health care), visiting a doctor more than ten times within the past year (visited a doctor more than ten times), change in place of health care, change in place of health care due to insurance, lack of mental health care and counseling in the past 12 months because the patient could not afford them (insufficient money for mental health care), and having seen a mental health provider in the past 12 months (having seen a mental health provider).
The functional indicators were defined as limitations in activities of daily living (ADLs) and limitations in ability to work. Limitations in ADLs were defined as a “yes” response to, “Because of a physical, mental, or emotional problem, do you need the help with personal care needs, such as eating, bathing, dressing, or getting around inside this home?” Limitations in ability to work were defined as stating “unable to work” in response to being asked, “Are you limited in the kind or amount of work you can do because of a physical, mental, or emotional problem?”
Chronic Health Conditions
The number of chronic conditions (zero, one, and two or more) included chronic obstructive pulmonary disease (COPD), diabetes, heart disease, stroke, and cancer (
18). Respondents were asked whether they had been told by a health professional that they had coronary heart disease, angina, a heart attack, or any other heart condition. Having diabetes and stroke was based on “yes” responses about having been told they had these conditions. Having cancer was based on questions about having been told they had a malignancy excluding nonmelanoma skin cancer (
19). COPD was based on questions about having been told they had emphysema or—in the past 12 months—chronic bronchitis. Data were missing for relatively small numbers of respondents: heart disease (N=142), diabetes (N=229), COPD (n=98), stroke (N=301), and total number of conditions (N=2,925). Records with missing data were excluded in multivariate analyses but were retained in the overall study population.
Demographic Characteristics
Race-ethnicity was categorized as Hispanic, non-Hispanic white, non-Hispanic black, and other. We explored including Asian Indians, Chinese, Filipinos, Koreans, Vietnamese, Japanese, and other Asian subgroups. However, the prevalence of SPD among these ethnic subgroups was relatively low (range 1.1%–2.4%), limiting our ability to analyze them separately.
Annual family income was grouped by poverty index ratio (PIR), as follows: below 100% of federal poverty level (FPL), 100%−199% of FPL, 200%−399% of FPL, and 400% or more of FPL (
20). PIR was based on imputed family income, the number of children in the family, and the age of the family adults (
20). NHIS multiple imputation files included income levels with missing data, allowing for imputation estimates (
21). Education included people 25 years and over to account for the completion of degree programs. Education was not included in final models because of its significant correlation with PIR (correlation coefficient=.43, p<.001). Replacing PIR with education level did not meaningfully change the results. Region of respondent’s residence was included as Northeast, Midwest, South, and West.
Statistical Analysis
Point estimates and 95% confidence intervals were calculated with SUDAAN (
22). Categorical variables were evaluated with Rao Scott chi-square statistics for weighted surveys (α=.05, two-sided). Multivariate logistic regression models examined associations between SPD (present versus absent) as an independent variable and the eight health care utilization and two functional indicators as dependent variables (insufficient money to buy medications, delay in care, insufficient money for health care, visited a doctor more than ten times, change in place of health care, and change in place of health care due to insurance as well as two functional indicators, limitations in ability to work and ADLs). All models were adjusted for age group, sex, race-ethnicity, type of health coverage including no health coverage, region, PIR, survey year, and the number of chronic health conditions. Indicators for insufficient money for mental health care and having seen a mental health provider were not modeled because of their correlation with SPD.
Results
The analytic sample included 207,853 adults. Approximately 58.2% of the sample were between ages 18 and 44 (mean±SD age=40.4±13.1 years). The largest percentages of adults were female (50.4%) and non-Hispanic white (66.4%), had a college education or more (30.5%), and had an annual family income of 400% or more of FPL (38.3%). SPD prevalence was 3.2%, comparable to other reports of SPD (
Table 1) (
5,
6). NHIS includes only civilian noninstitutionalized adults, excluding individuals such as homeless adults. Our study must be viewed in light of these exclusions, which may underestimate associations between SPD and indicators of poor health care use and access.
A majority of participants with SPD either were uninsured (33.4%) or had private coverage (36.6%). Significant variation was observed in health coverage type by region (p<.001). The percentage of participants without health coverage was greatest in the South and West, and the percentage of participants with private insurance was highest in the Northeast and Midwest. Higher SPD prevalence was found among women versus men, middle-aged adults versus younger adults, Hispanics and non-Hispanic blacks versus non-Hispanic whites, participants with the lowest income, and participants with less than a high school education compared with a college degree or higher (p<.001 for all comparisons) (
Table 1).
In
Table 2, adults with and without SPD were compared on access, utilization, and functional indicators by using Rao-Scott chi-square tests. The same indicators were also used to compare the entire sample by number of health conditions.
A greater proportion of adults with SPD than adults without SPD and adults with one and two or more health conditions had no health coverage and reported delays in health care, insufficient money for health care, insufficient money to buy medications, insufficient money for mental health care, change in place of health care, change in place of health care due to insurance, and having visited a doctor more than ten times in the past year (
Table 2). A greater proportion of adults with SPD were also more likely to have limitations in ADLs compared with adults without SPD and adults with one and two or more health conditions (
Table 2).
Table 3 presents results from multivariate regression models examining each of the utilization and functional indicators as dependent variables. Adults with SPD were over three times more likely than those without SPD to have insufficient money to buy medications, to have insufficient money for health care, and to have visited a doctor more than ten times in the past year and were over two times more likely to experience delays in care. Those with SPD were nearly four times more likely to report limitations in ADLs and twice as likely to have limitations in their ability to work compared with those without SPD.
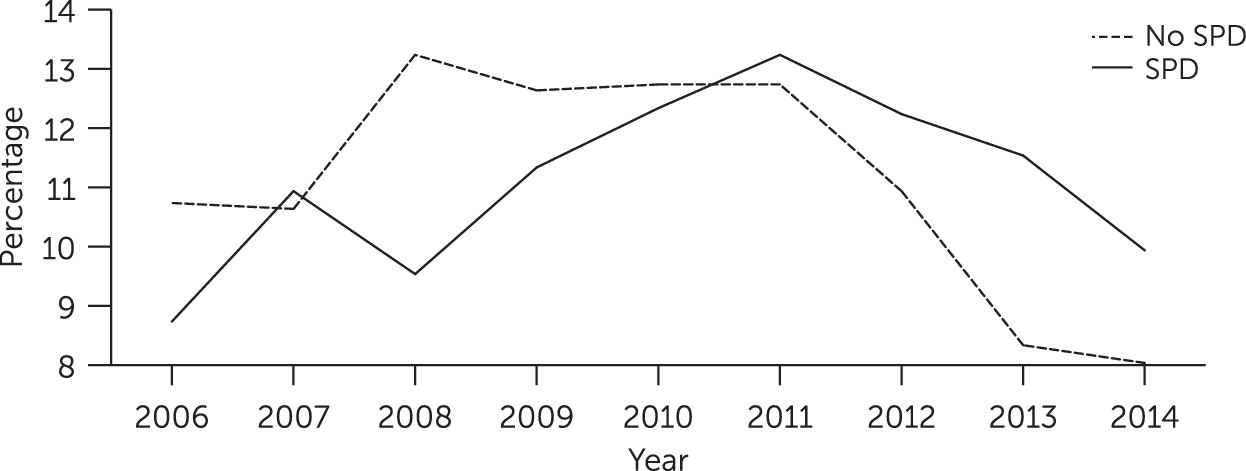
We examined trends by survey year stratified by SPD, which demonstrated that among adults without SPD, a smaller proportion had insufficient money to see a mental health care provider in 2014 (8.0%) compared with 2006 (10.7%). However, the reverse trend was observed among adults with SPD, with 9.9% having insufficient money to see a mental health care provider in 2014 versus 8.7% in 2006. We also conducted separate analyses by age group (18–25 and 26–64) for having seen a mental health care provider and having insufficient money to receive mental health care. We found that there was no significant difference between adults ages 18 to 25 compared with adults ages 26 to 64 in having seen a mental health care provider and having insufficient money to see a health care provider, regardless of SPD status.
There was a demonstrated increase in the proportion of participants with insufficient money to buy medications among adults both with and without SPD after 2008, followed by a decrease in rates in 2014 among adults both with and without SPD (
Figure 1). However, among adults with SPD, the proportion who had insufficient money to buy medications in 2014 (9.9%) had not returned to 2006 levels (8.7%). In contrast, among adults without SPD, there was a decrease in the proportion of participants who had insufficient money for medications in 2014 (8.0%) compared with 2006 (10.7%) (
Figure 1).
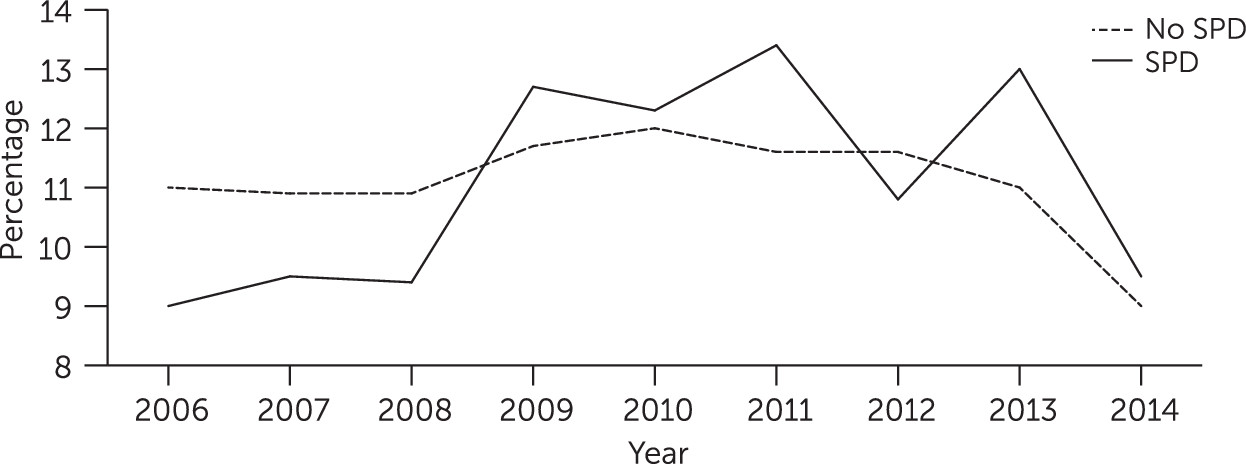
Patterns in access to care between 2006 and 2014 were similar among adults with and without SPD. Both groups experienced a steep rise in lack of health coverage after 2008 and a return to 2006 coverage levels in 2014. The proportion of adults with SPD without health coverage was slightly higher in 2014 (9.5%) compared with 2006 (9%) (
Figure 2).
Discussion
The major findings of this study are that adults with SPD were significantly more likely than those without SPD and those with other chronic health conditions to experience barriers to health care, including no health coverage, delays in care, insufficient money to buy medications, insufficient money for mental health care, change in the usual place of health care, and change in the usual place of health care due to insurance. Differences in functional indicators and sociodemographic variables were consistent with earlier reports; SPD tended to be more prevalent among female, poorer adults and among those with less than a college education. Adults with SPD were more likely to have diminished ADLs and a reduced ability to work compared with adults without SPD. Lack of health coverage and having insufficient money to buy medications worsened between 2008 to 2011 for all adults, suggesting that the Great Recession may have affected patterns of health care. Among adults with SPD, the increase from 2006 to 2014 in the proportions with insufficient money to buy medications suggests they may not have had as complete an economic recovery as adults without SPD.
Our findings, similar to those reported by Garfield and colleagues (
23), indicate that adults with psychological distress were more likely to be uninsured. Garfield and colleagues (
23) and Beronio and colleagues (
24) expressed hope that ACA’s expansion of health coverage would increase health coverage among those with psychological distress. Our review provides a baseline to evaluate the ACA’s benefits related to expansion of coverage for adults with SPD and confirms that the disparities identified by prior research still exist. We caution that our findings in evaluating the ACA are preliminary, given that data were available from only one year (2014) of ACA implementation and many states have not accepted ACA Medicaid expansion. Our study confirms the need to continue reviewing patterns of health care usage among adults with SPD when further postimplementation data are available and if more states choose to accept ACA Medicaid expansion.
The study results were also similar to those of Saloner and colleagues (
25) in that younger adults (ages 18 to 25) with or without SPD were not at greater risk of having insufficient money for mental health care and of having seen a mental health care provider compared with their older counterparts (ages 27 to 64). As Saloner and others (
25) pointed out, ACA provisions that afford parents the ability to cover their young adult children may be effective in providing coverage for this population (
25).
Our findings indicate that adults with SPD visit doctors frequently (
7). It is paradoxical that although SPD is associated with several indicators of poor utilization and access, as well as relatively poor general medical health, it is also associated with high utilization of expensive outpatient care (
4,
6,
24). One possible explanation is that primary care physicians (PCPs) are providing mental health care and prescription refills to adults with SPD in lieu of general medical care (
26). Improved care integration and linkages, for example, embedding mental health care providers within the primary care setting and embedding PCPs within the mental health setting, may facilitate better treatment of both mental health and general medical conditions (
27,
28). Moreover, integration of care may reduce chaotic health care utilization, including frequent changes in the location of health care.
Notably, adults enrolled in Medicaid had the highest prevalence of SPD compared with those covered in other ways. It remains to be determined whether barriers to care are minimized in states where the ACA acts as a “safety net” for unemployed adults with SPD (
4). Further analysis of health care utilization among persons with SPD by state may provide insight into the effects of Medicaid expansion. Information about states was not available for the current study. Thus a lack of examination of data by state represented a limitation of the study. We used region as a proxy for state variation and found that the South and West regions had the highest percentages of uninsured adults, the same regions occupied by states that did not accept the ACA Medicaid expansion. Cross-sectional studies may not reflect time in region, especially if residence was transitory. Additionally, SPD reporting may be limited by differential recall dependent on the respondent’s SPD status. A study strength was the comparison of adults with SPD and adults with other chronic health conditions and the use of the NHIS survey, providing a national sample, which made it possible to report health care patterns that are generalizable to the U.S. adult population.
Conclusions
Multivariate models adjusted for health coverage and sociodemographic characteristics indicated adults with SPD had greater odds of lacking money for prescriptions and health care, experiencing delays in care, visiting a doctor ten or more times in the past 12 months, changing usual place of health care, changing usual place of health care because of insurance, and having limitations in ADLs and ability to work. These results suggest that greater attention is needed to health care patterns among adults with SPD.


