Full access
Articles
Published Online: 2 October 2019

Relationship of County Opioid Epidemic Severity to Changes in Access to Substance Use Disorder Treatment, 2009–2017

Abstract

Objective:

The study measured the association between local opioid problem severity and changes in the availability of substance use disorder treatment programs, including the distance required for travel to treatment.

Methods:

A two-part, multivariable regression estimated the number of treatment facilities in the county (per 100,000 residents) and the number of miles to the nearest program (for all treatment programs, programs offering opioid use disorder medication, and programs accepting Medicaid) using data from the 2009–2017 National Directory of Drug and Alcohol Abuse Treatment Facilities. The unit of analysis was the county-year (N=28,270).

Results:

The probability of having at least one treatment program meeting the established criteria was greater in counties with a high-severity opioid problem than in counties with a low-severity problem, and the probability improved over time. In counties with a high-severity problem, the probability of having a treatment program offering buprenorphine, methadone, or both was 60.3% higher than in counties with low-severity problems. Between 2009 and 2017, the likelihood of having a treatment program that accepts Medicaid grew by 25.3%. For counties without treatment programs, the distance to the nearest program improved markedly over time, but there were no differences between distance to treatment in high-, moderate-, and low-severity status counties.

Conclusions:

The treatment system has reduced structural barriers to treatment where it is most needed. However, these findings do not imply that the treatment system has sufficient capacity to address the present scope of the opioid crisis. Policy makers should leverage this responsiveness to incentivize additional improvements in access.

HIGHLIGHTS

Controlling for confounders, a logistic regression analysis found that counties with severe opioid problems had an increased probability of having at least one substance use disorder treatment program offering methadone, buprenorphine, or both, compared with counties with less severe problems.
Between 2009 and 2017, the probability of having a treatment program accepting Medicaid reimbursement increased by 25.3%.
Among counties without a program offering medication, travel distance to the nearest such program decreased by 39% between 2009 and 2017.
Structural barriers to substance use disorder treatment have declined significantly, and the treatment system has demonstrated responsiveness to local need.
Drug overdose deaths are now the leading cause of mortality for Americans under 50 (1). The age-adjusted rate of drug overdose deaths continues to rise, increasing by 9.6% from 2016 to 2017. Furthermore, 67.8% of the 70,237 drug overdose deaths in 2017 were attributable to prescription and illicit opioids (2).
Rates of opioid use disorder have also increased; 2.1 million Americans met diagnostic criteria for the disorder in 2017 (3). The medications buprenorphine, methadone, and naltrexone—in conjunction with behavioral therapy—are considered the gold standard in treating opioid use disorder (49). However, relatively few patients receive these medications, and rates of medication availability in the specialty substance use disorder treatment system remain low (10). In 2017, only 30% of all specialty treatment programs offered either methadone or buprenorphine (11).
Improving the accessibility and quality of opioid use disorder treatment is imperative, especially for the Medicaid population, which has high rates of both substance use and overdose deaths. However, there is little understanding of the treatment landscape, especially treatment at the local level. Previous research is limited by a lack of recent data on the availability of treatment programs that include geographic location at a local level. Older studies found that approximately 40% of counties in 2009 lacked a treatment program that accepted Medicaid (12) and that, in 2012, many counties with high rates of opioid misuse lacked opioid treatment programs accepting Medicaid (13). Recent state-level studies show increases in the percentage of programs accepting Medicaid (14) and Medicaid-reimbursed treatment admissions (15).
The geographic distribution of specialty treatment programs—including those that accept Medicaid insurance, offer medication, or both—remains unclear. This is important because living far from the nearest program can present substantial structural barriers to treatment. Barriers may be acute for employed individuals with inflexible or unpredictable work hours, those with childcare responsibilities, those with limited or unreliable transportation options, and those with disabilities that make travel difficult.
We contribute to the study of this question by analyzing a novel data set from the Substance Abuse and Mental Health Services Administration (SAMHSA) that provides the physical location of and services provided by all specialty substance use treatment programs in the United States. We stratified counties by opioid problem severity and provide a longitudinal analysis of county-level change in access to substance use disorder treatment programs from 2009 to 2017. We specifically examined changes—according to local opioid problem severity—in the availability of and distance to all treatment programs; programs offering methadone, buprenorphine, or both; programs that accept Medicaid; and programs that accept Medicaid and offer medication.

Methods

Data

We utilized data from the National Directory of Drug and Alcohol Abuse Treatment Facilities published in a PDF format annually by SAMHSA using data from the National Survey of Substance Abuse Treatment Services (NSSATS). NSSATS is an annual survey of all known substance use disorder treatment programs in the United States, with an average response rate of 92.4%. As such, it represents the census of programs nationwide (16). We created a data set from the PDFs across the 2009–2017 directories, which includes the physical address of each location where treatment is provided, payment sources accepted, and medications offered. We retained data for all 50 states and the District of Columbia, which comprise 103,090 program-year observations.
The unit of analysis was the county-year. We assigned treatment programs to counties using a zip code–to–county crosswalk (17). If a zip code spanned more than one county, the program was assigned to the county with the greatest percentage of business activity for that zip code. We aggregated the number of treatment programs to the county level and adjusted the totals to represent the number of programs per 100,000 county residents. Outcome variables were the number of programs overall, programs offering medication (i.e., methadone, buprenorphine, or both), programs accepting Medicaid insurance as payment for services, and programs both offering medication and accepting Medicaid. The final sample had 28,270 county-year observations.
We measured distance as the miles between county centroids (18). In counties with at least one treatment program with the relevant characteristics (e.g., offers medication), we measured miles to the nearest county as zero. In counties with no such treatment programs, the distance to the closest county with a program was used as the distance to treatment.
For our principal independent variable of interest—county opioid problem severity—we divided counties into terciles of low, moderate, or high severity on the basis of three county-year variables: drug-related mortality rate (19), opioid prescription rate (20), and drug-related arrest rate (21). We imputed missing values using the average from adjoining counties (for deaths and prescribing rates) or the average of the surrounding years’ values (for arrests).
We conducted a factor analysis using the annual county-level prescribing, mortality, and arrest rates. To account for large year-to-year shifts in values due to the infrequency of events such as mortality in small areas, we Winsorized values at the first and 99th percentiles. (The variables loaded on a single factor, with an eigenvalue of .718.) We separated all counties into thirds (low, moderate, or high) on the basis of their factor scores and lagged the severity variable by 1 year.
County-level demographic data on population, race-ethnicity, education levels, urbanicity, median income, and poverty level were obtained from the U.S. Census Bureau’s American Community Survey. Other county-year control variables included the unemployment rate (22) and physicians per 1,000 population (23). We also controlled for state policies, including Medicaid expansion (24), prescription drug monitoring programs (both voluntary and mandatory access programs) (2527), substance use treatment parity laws (2830), pain clinic regulations (31), and laws making naloxone available without a prescription (i.e., standing orders) (32, 33). Finally, we controlled for per capita federal substance abuse prevention and treatment block grant dollars (2017 $) allocated to the states, including 2017 funding from the opioid state-targeted response grant.

Statistical Analyses

We present two sets of models estimating the relationship between opioid problem severity and treatment availability. The first set has dependent variables measuring the number of programs per 100,000 county residents for all treatment programs, programs offering medication, programs accepting Medicaid, and programs offering medication and accepting Medicaid. The second set of models estimates the number of miles to the nearest county with a treatment program (defined by the same criteria).
To address the zero-inflated distribution of our data, we employed a two-part model (TPM). In the first part, we used logistic regression to regress an indicator variable (having at least one such program) on our severity measure and control variables. (The first part of the TPM was the same for both outcomes.) A county’s inclusion in the second part of the TPM was conditional on having at least one program (for the outcome measuring number of programs) or on having no program (for the distance-to-treatment outcome). We used ordinary least squares (OLS) to regress the natural log of the number of programs or miles to the nearest program on the covariates. Log transformation of the dependent variables addressed the right-skewness in the values and allowed interpretation of the resulting coefficients as the percentage change in the dependent variable.
All models were conducted in Stata 15, with standard errors clustered at the county level. Each model included the county opioid severity level, the county- and state-level control variables described above, and year fixed effects to track changes in treatment availability over time. Because the analysis was focused on treatment programs, this study was not subject to institutional review board approval.

Results

Table 1 presents summary statistics for the full sample and by opioid severity level. (All statistics are weighted by county population to make them representative; unadjusted statistics are available in the online supplement.) On average, counties had 3.44 programs offering treatment services per 100,000 people. Divided by severity, county averages ranged between 3.10 and 3.76 programs. The mean distance to the nearest county with a treatment program for the full sample was 1.5 miles. Distance to programs offering methadone, buprenorphine, or both was significantly higher (8.09 miles). Treatment programs that both offered medication and accepted Medicaid were the farthest, at 13.85 miles.
TABLE 1. Summary statistics for counties grouped by tercile of opioid problem severitya
 All counties (N=28,270)Low severity (N=9,422)Moderate severity (N=9,422)High severity (N=9,426) 
VariableMSDMSDMSDMSDANOVA results: low vs. moderate/ low vs. high/ moderate vs. highb
Dependent         
 Programs per 100,000 population         
  All3.442.663.102.623.402.523.762.86**/**/**
  Provides methadone, buprenorphine, or both.901.04.78.98.87.901.031.23**/**/**
  Accepts Medicaid2.002.211.742.271.902.022.352.38/**/**
  Provides methadone, buprenorphine, or both and accepts Medicaid.57.91.52.92.54.80.651.04**/**/**
 Miles to nearest program         
  All1.506.702.228.341.175.691.416.53**/**/**
  Provides methadone, buprenorphine, or both8.0920.159.0823.566.8918.389.0319.51**/**/**
  Accepts Medicaid2.559.013.1310.242.078.012.769.27**/**/**
  Provides methadone, buprenorphine, or both and accepts Medicaid13.8527.7013.8831.0912.1725.3016.2427.95**/**/*
Control         
 Severity of opioid problem         
  Drug-related mortality per 10,000 population1.45.87.81.421.32.542.171.02**/**/**
  Opioid prescribing, per 100 population76.9633.6445.6314.7072.3418.72110.2133.25**/**/**
  Drug arrests per 10,000 population44.7328.6943.7529.5342.9225.7448.2531.68**/**/**
 State policy         
  Expanded Medicaid.31.46.35.47.31.46.27.44**/**/
  Optional PDMPc.80.38.82.37.78.40.82.37**/**/**
  Mandatory PDMPc.11.29.08.26.07.24.17.37**/**/**
  Pain clinic law.18.37.14.34.18.38.20.39/**/**
  Parity law.82.38.79.41.82.39.86.35**/**/**
  Naloxone standing order.33.45.34.45.31.44.35.45**/**/**
  SABG funds per capita (2017 $)d5.81.936.05.945.80.935.62.89**/**/**
 Demographic         
  Population (in 100,000s)11.3419.3122.8031.989.7111.994.484.85**/**/**
  Rural population (%)18.9724.3616.7027.9917.0821.7123.5024.22**/**/*
  Race-ethnicity (%)         
   White62.4822.0649.7525.9763.4019.4071.4116.83**/**/**
   Black12.3812.7112.1912.6411.4612.0013.8513.60**/**/**
   Hispanic17.1316.8426.0021.3517.5015.089.4610.19**/**/**
   Asian5.156.189.248.984.804.832.362.03**/**/**
   Other2.863.992.825.502.853.392.913.28**/**/
  Education         
   Less than high school14.065.9615.937.4113.165.5613.864.74**/**/**
   High school graduate/GED28.047.1925.517.4926.976.9331.625.81**/**/**
   Some college/associate degree28.824.7126.324.8229.474.4129.914.31†/**/**
   Bachelor's degree or higher29.0710.5632.2412.3930.4010.1624.617.70**/**/**
 Economic         
  Median income (in thousands) (2017 $)59.3615.7366.1920.0261.4913.6650.799.74/**/**
  Unemployment rate7.172.767.222.856.982.707.402.74**/**/**
  Poverty rate15.035.4214.486.4814.194.9216.694.75**/**/**
  Physicians per 1,000 population2.942.062.972.212.951.992.902.02**/**/**
a
Source: authors' analysis of all substance use disorder treatment programs listed in the National Directory of Drug and Alcohol Abuse Treatment Facilities (2009–2017) (derived from the National Survey of Substance Abuse Treatment Services), Substance Abuse and Mental Health Services Administration. Values were adjusted by using Stata's “fweight” to account for variation in county population size.
b
Statistical significance determined by using analysis of variance and Tukey's multiple comparison test.
c
PDMP, prescription drug monitoring program.
d
SABG, substance abuse prevention and treatment block grant.
*
p<.05, **p<.01.
p≥.1, †p<.1.
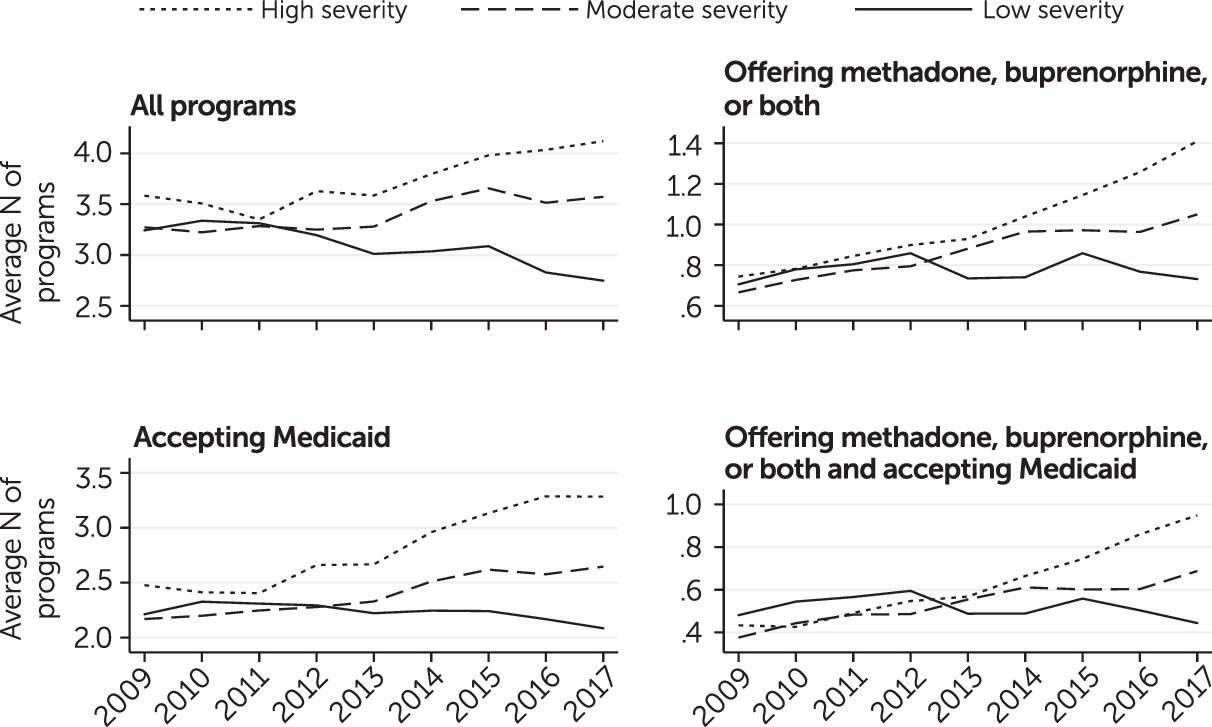
Figure 1 displays the average number of programs in a county per 100,000 population over time, by type of program and opioid problem severity. (Averages are weighted by county population.) The graphs clearly show that compared with counties with low-severity problems, there was more treatment access in counties with moderate-severity problems and greater access still in counties with high-severity problems. In addition, availability increased over time and increased more rapidly in the counties with higher-severity problems.
FIGURE 1. Average number of substance use disorder treatment programs per county (per 100,000 population), by severity of opioid problem, 2009–2017a
aSource: authors' analysis of all substance use disorder treatment programs listed in the National Survey of Substance Abuse Treatment Services (2009–2017), Substance Abuse and Mental Health Services Administration. Values were adjusted by county population size to make estimates representative.
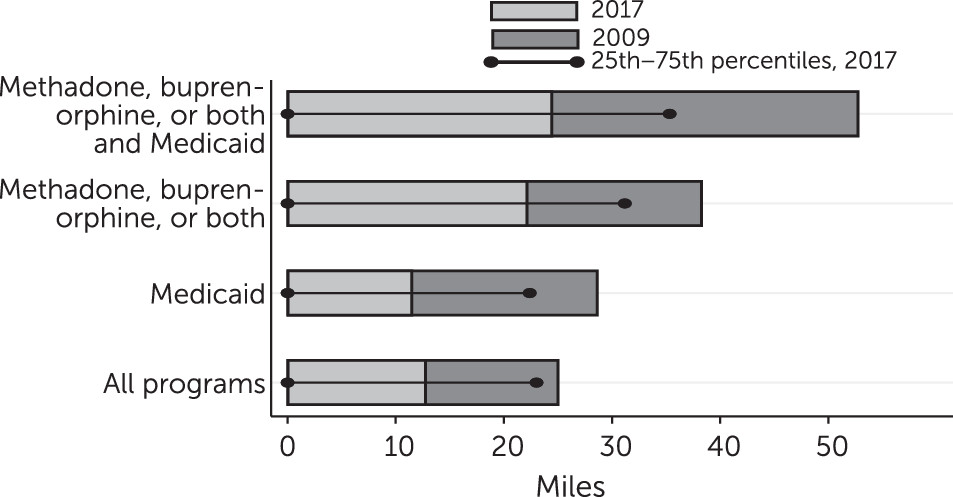
Figure 2 displays the average travel distance in miles to the nearest program in 2009 and 2017 (also weighted by county population). Because only counties that did not have such a program in 2009 are included, the graph represents counties with the lowest treatment accessibility in 2009. For each program type, there were substantial declines in the distances to treatment over the course of the study, with distances typically dropping by half or more.
FIGURE 2. Average number of miles per county to nearest substance use disorder treatment program in 2009 and 2017a
aSource: authors' analysis of all substance use disorder treatment programs listed in the National Survey of Substance Abuse Treatment Services (2009–2017), Substance Abuse and Mental Health Services Administration. Values were adjusted by county population size to make estimates representative. Only counties with no substance use disorder treatment facilities in 2009 were included (all programs, N=1,236; programs that accept Medicaid, N=1,529; programs that offer methadone, buprenorphine, or both, (N=2,491); and programs that offer methadone, buprenorphine, or both and accept Medicaid, N=2,677).
Table 2 presents the estimated marginal effects from the first part of our TPM, which used logistic regression to predict changes in the probability of a county having at least one treatment program. (Full model results for all specifications are available in the online supplement.) Across all outcomes, we found statistically significant and positive associations between the severity of the opioid problem and treatment program availability. Having a moderate-severity problem was associated with a 3–percentage point increase in the probability of having any treatment program (p<0.01). Moderate severity was associated with a 4–percentage point increase in the probability of having a treatment program offering methadone, buprenorphine, or both (p<0.01); a 6–percentage point increase in the probability of having a program that accepts Medicaid (p<0.01); and a 4–percentage point increase in the probability of having a program that offers medication and accepts Medicaid (p<0.01).
TABLE 2. Availability of a county substance use disorder treatment program as a function of severity of the county’s opioid problem and year, by type of programa
 All programsMethadone, buprenorphine, or bothMedicaidMethadone, buprenorphine, or both and Medicaid
VariableMEbSEpMEbSEpMEbSEpMEbSEp
Opioid problem severity (reference: low)            
 Moderate.03**.01.01.04**.01<.01.06**.01<.01.04**.01<.01
 High.03*.01.02.07**.01<.01.05**.01<.01.07**.01<.01
Year fixed effects (reference: 2009)            
 2010–.01*.00.03.01**.00.01–.00.01.50.01*.00.01
 2011–.02.01.10.00.01.99.02.01.16–.00.01.71
 2012–.00.01.80.02.01.06.05**.01<.01.02*.01.04
 2013–.01.02.60.04**.01<.01.05**.02<.01.04**.01<.01
 2014.02.02.33.05**.02<.01.12**.02<.01.06**.01<.01
 2015.02.02.34.06**.02<.01.13**.02<.01.07**.02<.01
 2016.02.02.43.06**.02<.01.14**.02<.01.08**.02<.01
 2017.02.02.47.03.02.13.13**.03<.01.04*.02.03
a
Source: authors' analysis of all substance use disorder treatment programs listed in the National Directory of Drug and Alcohol Abuse Treatment Facilities (2009–2017) (derived from the National Survey of Substance Abuse Treatment Services), Substance Abuse and Mental Health Services Administration (N=28,270 observations). All models conducted in Stata 15 by using the margins command following logistic regression, with standard errors clustered at the county level and control for Medicaid expansion; optional and mandatory prescription drug monitoring program; pain clinic laws; mental health parity laws; substance abuse prevention and treatment block grant funds per capita (2017 $); county population; percentage of rural population; county percentage of whites, blacks, Hispanics, Asians, and members of other race-ethnicity; county educational attainment (percentage of residents with less than high school, high school graduate/GED, some college/associate degree, and bachelor’s degree or higher); median income (2017 $); unemployment rate; poverty rate; and physicians per 1,000 residents.
b
Marginal effects.
*
p<.05, **p<.01.
p<.1.
The direction and significance of changes in the availability of a treatment program was the same in counties with high-severity problems as in counties with moderate-severity problems. High severity was associated with a 3–percentage point increase in the probability of having any treatment program compared with low-severity counties (p<0.05). High opioid problem severity was also associated with a 7–percentage point increase in the probability of having a program that offers medication (p<0.01), a 5–percentage point increase in the probability of having a program that accepts Medicaid (p<0.01), and a 7–percentage point increase in the probability of having a program that offers medication and accepts Medicaid (p<0.01).
Table 3 presents OLS coefficients estimating the association between opioid severity and the log number of programs per 100,000 population among the subset of counties with at least one program. Differences between counties with low- and high-severity problems were not statistically significant for programs offering medication or for programs offering medication and accepting Medicaid. A significant and negative association was found between opioid problem severity and the log number of programs overall (b=–0.07, p<0.05) and programs offering Medicaid (b=–0.13, p<0.01). Coefficients estimating the association between moderate-severity problems and number of programs were negative and significant across program types. Between 2009 and 2017, there was also a decrease (–0.34, p<0.01) in the number of programs but an increase (0.25, p<0.05) in the number of programs offering medication and accepting Medicaid.
TABLE 3. Number of substance use disorder treatment programs in the county and distance to the nearest substance use disorder treatment program as a function of severity of the county’s opioid problem and year, by type of programa
 All programs (N=18,001)bMethadone, buprenorphine, or both (N=7,030)cMedicaid (N=15,880)dMethadone, buprenorphine, or both and Medicaid (N=5,332)e
VariablebSEpbSEpbSEpbSEp
N of substance use disorder treatment programsf
Opioid problem severity (reference: low)            
 Moderate–.08**.03<.01–.15**.05<.01–.13**.03<.01–.18**.06<.01
 High–.07*.03.03–.06.06.26–.13**.03<.01–.11.07.11
Year fixed effects (reference: 2009)            
 2010–.03**.01<.01.10**.02<.01–.01.01.52.12**.03<.01
 2011–.18**.03<.01–.01.05.79–.08*.03.02.05.05.34
 2012–.18**.03<.01.01.05.79–.08*.04.04.09.06.13
 2013–.17**.03<.01.08.05.14–.04.04.32.13*.07.05
 2014–.25**.04<.01.11.07.10–.07.05.13.20*.08.02
 2015–.27**.05<.01.13.08.08–.06.05.27.23*.10.02
 2016–.29**.05<.01.17.09.05–.03.06.67.32**.11<.01
 2017–.34**.06<.01.08.09.40–.08.07.24.25*.11.03
 All programs (N=10,269)gMethadone, buprenorphine, or both (N=21,240)hMedicaid (N=12,390)iMethadone, buprenorphine, or both and Medicaid (N=22,938)j
 bSEpbSEpbSEpbSEp
Distance to nearest substance use disorder treatment programk
Opioid problem severity (reference: low)            
 Moderate–.00.01.92–.00.01.87.01.01.42–.02.01.12
 High.03.02.09.01.02.51.03.02.11–.01.02.72
Year fixed effects (reference: 2009)            
 2010–.00.01.66–.04**.01<.01–.02*.01.03–.08**.01<.01
 2011–.04.02.08–.10**.02<.01–.10**.02<.01–.16**.02<.01
 2012–.05*.02.04–.16**.02<.01–.13**.02<.01–.24**.02<.01
 2013–.01.03.62–.16**.02<.01–.09**.03<.01–.24**.03<.01
 2014–.07*.03.03–.24**.03<.01–.19**.03<.01–.37**.03<.01
 2015–.02.04.56–.25**.03<.01–.14**.04<.01–.40**.03<.01
 2016.01.04.81–.22**.04<.01–.11**.04<.01–.41**.04<.01
 2017–.08*.04.05–.39**.04<.01–.21**.04<.01–.57**.04<.01
a
Source: authors' analysis of all substance use disorder treatment programs listed in the National Directory of Drug and Alcohol Abuse Treatment Facilities (2009–2017) (derived from the National Survey of Substance Abuse Treatment Services), Substance Abuse and Mental Health Services Administration. All models conducted in Stata 15 by using the margins command following logistic regression, with standard errors clustered at the county level and control for Medicaid expansion; optional and mandatory prescription drug monitoring program; pain clinic laws; mental health parity laws; substance abuse prevention and treatment block grant funds per capita (2017 $); county population; percentage of rural population; county percentage of whites, blacks, Hispanics, Asians, and members of other race-ethnicity; county educational attainment (percentage of residents with less than high school, high school graduate/GED, some college/associate degree, and bachelor’s degree or higher); median income (2017 $); unemployment rate; poverty rate; and physicians per 1,000 residents.
b
R2=.31, F=38.17, df=30 and 2,369.
c
R2=.44, F=43.74, df=30 and 1,128.
d
R2=.44, F=63.32, df=30 and 2,218.
e
R2=.55, F=49.12, df=30 and 955.
f
Log number of programs per 100,000 population (conditional on having at least one program).
g
R2=.37, F=32.46, df=30 and 1,597.
h
R2=.37, F=69.43, df=30 and 2,649.
i
R2=.33, F=38.82, df=30 and 1,910.
j
R2=.33, F=88.35, df=30 and 2,824.
k
Log distance in miles (conditional on having no programs).
*
p<.05, **p<.01.
p<.1.
Table 3 displays the OLS coefficients from the second-part models estimating changes in the log distance to treatment (conditional on a county having no program). For all program types, there were no statistically significant differences between counties with low-, moderate-, and high-severity problems. All coefficients comparing distances to programs in 2017 versus 2009 were negative and significant (p<0.01)—all programs, –0.08; programs offering medication, –0.39; programs accepting Medicaid, –0.21; and programs offering medication and accepting Medicaid, –0.57.

Discussion

In this article, we examined the relationship of local opioid problem severity to changes in the geographic distribution of substance use disorder treatment programs over time. To our knowledge, this is the only study providing a longitudinal analysis of the substance use disorder treatment system using recent data at the local level. Furthermore, we know of no other work measuring geographic proximity to treatment. Our findings demonstrate that communities with the most acute need are more likely to have a program available in county, indicating a reduction in the distance required to travel to treatment. After controlling for year, socioeconomic and demographic characteristics, and state policy actions, the analyses showed that high- and moderate-severity problems were associated with modest increases (6.6%, or a 3–percentage point increase from 45.3% probability in low-severity counties) in the probability of having any treatment program, compared with low-severity status.
However, the likelihood of having a higher-quality, evidence-based program was substantially better for counties with higher-severity problems. Methadone and buprenorphine are considered the gold standard for achieving opioid use disorder recovery. Counties with moderate-severity problems were 34.5% (a 4–percentage point increase over the 11.6% average for low-severity counties) more likely than counties with low-severity problems to have at least one program offering these medications. The gains were larger for high-severity counties—a 60.3% increase (a 7–percentage point increase over the average for low-severity counties). (The findings hold for both methadone and buprenorphine when estimated separately [see online supplement].) This improvement represents closer proximity to treatment, given that residents of counties with these programs will not necessarily have to travel to other counties to access care. Closer access is important because it decreases the burden on vulnerable patients, especially those with fewer transportation options or with time constraints related to jobs or caregiving responsibilities.
These findings also reveal significant and meaningful evolution in the treatment landscape over time. The probability of a county having a program that offers medication increased by 14.4% between 2009 and 2017. Moreover, among counties without treatment programs, the distance to the nearest county with a program decreased across all program types between 2009 and 2017. There was a decrease of almost 40% in the distance to treatment for programs offering medication and of almost 60% in the distance to programs offering medication and accepting Medicaid. Strikingly, we did not see significant changes in the likelihood of a county having a program overall between 2009 and 2017, suggesting that existing programs had adopted medications or had been replaced by new programs that did.
These findings are consistent with studies that examine changes in treatment access by measuring the supply of physicians with waivers to prescribe buprenorphine. There is a positive correlation between the number of treatment programs and waivered physicians in a state (34). The supply of waivered physicians is responsive to certain state and local conditions, including local problem severity (measured as mortality) (35), and the number of counties with a shortage of waivered physicians fell sharply between 2002 and 2011 (36).
Access to treatment for Medicaid beneficiaries was better in both counties with high-severity opioid problems and counties with moderate-severity problems compared with counties with low-severity problems. High-severity status was associated with a 13.1% increase in the likelihood of having a program that accepts Medicaid reimbursement (up 5 percentage points from 38.2% probability in low-severity counties) and a 76.9% increase in the likelihood of having a program offering medication and accepting Medicaid (a 7–percentage point increase from a 9.1% probability for low-severity counties). By 2017, counties were 25.3% more likely to have a program accepting Medicaid (a 13–percentage point increase from a baseline of 51.3% in 2009), and the travel distance to such programs for people in counties without one decreased by 21%.
Figure 1 illustrates that treatment availability accelerated around the time of Medicaid expansion through the Affordable Care Act in 2014. Measuring the effect of expansion on local changes in treatment access is a promising area of future research. Indeed, state-level analyses suggest that expansion led to an increase in the availability of programs that accept Medicaid (24) and in Medicaid-reimbursed buprenorphine prescriptions (37). Because Medicaid beneficiaries account for a heavy share of opioid use disorder diagnoses, expansion may be an essential aspect of providing high-quality, affordable treatment options.
Although the quality and affordability of opioid use disorder treatment has improved markedly over time, demonstrating responsiveness to the scope of the opioid problem, the full picture is not entirely positive. We observed large and significant improvements in the likelihood of having any treatment program in counties with a high-severity opioid problem, but our findings did not show declines in the distance to treatment in counties with high-severity problems and no program of their own nor did they show increases in the number of programs in counties with high-severity problems and at least one program. (In fact, we showed that fewer programs accepted Medicaid in counties with high-severity problems.)
These results suggest a treatment system that has broadened in geographic scope but not deepened its capacity to fully meet treatment needs. Other studies have documented gaps between rates of opioid abuse and treatment capacity (3840). Most patients with opioid use disorder are not actively in treatment (41). A recent cross-sectional review of 2016 data suggests the continued existence of areas with both high opioid-related death rates and low treatment accessibility (42). Insufficient treatment access can arise from a variety of factors—affordability concerns, regulatory hurdles, stigma, and geographic barriers—and a multifaceted approach will be required in order to align treatment availability with the scale of the opioid problem (43).
This study had several limitations of note. First, there is no publicly available county-level measure of opioid use disorder. We created a proxy measure using county opioid prescribing rates and drug-related death and arrest rates. Second, this study did not examine access to treatment outside the specialty addiction treatment system (e.g., buprenorphine and naltrexone prescribed by office-based providers or federally qualified health centers); therefore, treatment access is likely to be even better than reported. Longitudinal data on office-based providers were not available. Third, we did not examine access to oral or injectable naltrexone, two additional opioid treatment medications approved by the U.S. Food and Drug Administration. NSSATS directories do not distinguish between naltrexone used for the treatment of alcohol use disorder and opioid use disorder. Fourth, measuring distance by county centroids may underestimate or overestimate actual travel distance to treatment if centroids do not align with population concentrations.

Conclusions

This study is the first to provide a comprehensive view of recent changes in the treatment landscape for substance use disorders at the local level. Although our findings provide strong evidence that the substance use disorder treatment system is responsive to local opioid problem severity, these results should not be interpreted to suggest that there is sufficient treatment access, especially in communities hardest hit by the opioid crisis. Across the United States, people report problems locating the type of treatment they need and can afford. The observed adaptability of treatment systems, however, implies that programs may respond to incentives to provide higher-quality treatment where it is most needed. Policy makers should deploy an array of “carrots and sticks” to promote growth and improvements in the treatment system. Such efforts may entail higher and less restrictive Medicaid and Medicare reimbursement for medications, reduced reimbursement to programs that do not offer medication, Medicaid expansion in the remaining nonexpansion states, and other efforts to encourage adoption of medication by treatment programs.

Acknowledgments

The authors thank the following individuals for their insightful suggestions and feedback on this project: Jason M. Hockenberry, Janet R. Cummings, and Adam S. Wilk.
Supplementary Material

File (appi.ps.201900150.ds001.pdf)

References

1.
Katz J: Drug deaths in America are rising faster than ever. New York Times, June 5, 2017
2.
Scholl L, Seth P, Kariisa M, et al: Drug and opioid-involved overdose deaths— United States, 2013–2017. MMWR Morb Mortal Wkly Rep 2018; 67:1419–1427
3.
Key Substance Use and Mental Health Indicators in the United States: Results From the 2017 National Survey on Drug Use and Health (HHS pub no SMA 18-5068, NSDUH Series H-53). Rockville, MD, Substance Abuse and Mental Health Services Administration, Center for Behavioral Health Statistics and Quality. https://www. samhsa.gov/data
4.
Amass L, Ling W, Freese TE, et al: Bringing buprenorphine-naloxone detoxification to community treatment providers: the NIDA Clinical Trials Network field experience. Am J Addict 2004; 13(suppl 1):S42–S66
5.
Amato L, Minozzi S, Davoli M, et al: Psychosocial and pharmacological treatments versus pharmacological treatments for opioid detoxification. Cochrane Database Syst Rev 2011; 9:CD005031
6.
Amato L, Minozzi S, Davoli M, et al: Psychosocial combined with agonist maintenance treatments versus agonist maintenance treatments alone for treatment of opioid dependence. Cochrane Database Syst Rev 2011; 10:CD004147
7.
Fiellin DA, Pantalon MV, Chawarski MC, et al: Counseling plus buprenorphine-naloxone maintenance therapy for opioid dependence. N Engl J Med 2006; 355:365–374
8.
Mattick RP, Ali R, White JM, et al: Buprenorphine versus methadone maintenance therapy: a randomized double-blind trial with 405 opioid-dependent patients. Addiction 2003; 98:441–452
9.
Strang J, Babor T, Caulkins J, et al: Drug policy and the public good: evidence for effective interventions. Lancet 2012; 379:71–83
10.
Treatment Episode Data Set–Admissions (TEDS-A): 2005–2015. Rockville, MD, Substance Abuse and Mental Health Services Administration, Center for Behavioral Health Statistics and Quality, 2017. https://www.datafiles.samhsa.gov/study-series/treatment-episode-data-set-admissions-teds-nid13518
11.
National Survey of Substance Abuse Treatment Services (N-SSATS). Bethesda, MD, Substance Abuse and Mental Health Services Administration, 2016.https://www.datafiles.samhsa.gov/study-series/national-survey-substance-abuse-treatment-services-n-ssats-nid13519
12.
Cummings JR, Wen H, Ko M, et al: Race/ethnicity and geographic access to Medicaid substance use disorder treatment facilities in the United States. JAMA Psychiatry 2014; 71:190–196
13.
Abraham AJ, Andrews CM, Yingling ME, et al: Geographic disparities in availability of opioid use disorder treatment for Medicaid enrollees. Health Serv Res 2018; 53:389–404
14.
Andrews CM, Grogan CM, Smith BT, et al: Medicaid benefits for addiction treatment expanded after implementation of the Affordable Care Act. Health Aff (Millwood) 2018; 37:1216–1222
15.
Maclean JC, Saloner B: The effect of public insurance expansions on substance use disorder treatment: evidence from the Affordable Care Act. J Policy Anal Manage 2019; 38:366–393
16.
2018 National Directory of Drug and Alcohol Abuse Treatment Facilities. Rockville, MD, Substance Abuse and Mental Health Services Administration, 2018. https://www.samhsa.gov/data/report/2018-national-directory-drug-and-alcohol-abuse-treatment-facilities
17.
HUD USPS ZIP Code Crosswalk Files. Washington, DC, US Department of Housing and Urban Development, 2018. https://www.huduser.gov/portal/datasets/usps_crosswalk.html
18.
County Distance Database. Cambridge, MA, National Bureau of Economic Research, 2016. https://www.nber.org/data/county-distance-database.html
19.
Mortality Data. Atlanta, Centers for Disease Control and Prevention, National Center for Health Statistics, National Vital Statistics System, 2018. https://www.cdc.gov/nchs/nvss/deaths.htm
20.
US Opioid Prescribing Rate Maps. Atlanta, Centers for Disease Control and Prevention, 2018. Accessed June 10, 2018. https://www.cdc.gov/drugoverdose/maps/rxrate-maps.html
21.
Uniform Crime Reports: County Level Detailed Arrest and Offense Data: Federal Bureau of Investigation, National Archive of Criminal Justice Data. Ann Arbor, University of Michigan, Institute of Social Research, 2019. https://www.icpsr.umich.edu/icpsrweb/ICPSR/series/57
22.
Local Area Unemployment Statistics. Washington, DC, US Department of Labor, Bureau of Labor Statistics, 2019. Accessed Jan 4, 2019. https://www.bls.gov/lau/
23.
Area Health Resource Files. Rockville, MD, US Department of Health and Human Resources, Health Resources & Services Administration, 2018. Accessed Aug 8, 2018. https://data.hrsa.gov/topics/health-workforce/ahrf
24.
Meinhofer A, Witman AE: The role of health insurance on treatment for opioid use disorders: evidence from the Affordable Care Act Medicaid expansion. J Health Econ 2018; 60:177–197
25.
Yarbrough CR: Prescription drug monitoring programs produce a limited impact on painkiller prescribing in Medicare part D. Health Serv Res 2018; 53:671–689
26.
Mandated Use of State Prescription Drug Monitoring Programs (PMPS). Harrisburg, PA, National Alliance for Model State Drug Laws, 2017. https://namsdl.org/wp-content/uploads/Mandated-Use-of-State-Prescription-Drug-Monitoring-Programs-PMPs-Highlights-of-Key-State-Requirements.pdf
27.
Mandatory PDMP Use. Waltham, MA, Brandeis University, Prescription Drug Monitoring Program Training and Technical Assistance Center, 2017. Accessed Feb 27, 2019. http://www.pdmpassist.org/pdf/Mandatory_conditions_use.pdf
28.
Popovici I, Maclean JC, French MT: Health Insurance and Traffic Fatalities: The Effects of Substance Use Disorder Parity Laws. Cambridge, MA, National Bureau of Economic Research, 2018. https://www.nber.org/papers/w23388
29.
Wen H, Cummings JR, Hockenberry JM, et al: State parity laws and access to treatment for substance use disorder in the United States: implications for federal parity legislation. JAMA Psychiatry 2013; 70:1355–1362
30.
Cauchi R, Hanson K: Mental Health Benefits: State Laws Mandating or Regulating. Washington, DC, National Conference of State Legislatures, 2017. http://www.ncsl.org/research/health/mental-health-benefits-state-mandates.aspx
31.
Pain Management Clinic Laws. Philadelphia, Prescription Drug Abuse Policy System, Legal Science, 2018. Accessed April 29, 2019. http://pdaps.org/datasets/pain-management-clinic-laws
32.
Naloxone Overdose Prevention Laws. Philadelphia, Prescription Drug Abuse Policy System, Legal Science, 2017. Accessed April 29, 2019. http://pdaps.org/datasets/laws-regulating-administration-of-naloxone-1501695139
33.
Gertner AK, Domino ME, Davis CS: Do naloxone access laws increase outpatient naloxone prescriptions? Evidence from Medicaid. Drug Alcohol Depend 2018; 190:37–41
34.
Knudsen HK: The supply of physicians waivered to prescribe buprenorphine for opioid use disorders in the United States: a state-level analysis. J Stud Alcohol Drugs 2015; 76:644–654
35.
Stein BD, Gordon AJ, Dick AW, et al: Supply of buprenorphine waivered physicians: the influence of state policies. J Subst Abuse Treat 2015; 48:104–111
36.
Dick AW, Pacula RL, Gordon AJ, et al: Growth in buprenorphine waivers for physicians increased potential access to opioid agonist treatment, 2002–11. Health Aff 2015; 34:1028–1034
37.
Wen H, Hockenberry JM, Borders TF, et al: Impact of Medicaid expansion on Medicaid-covered utilization of buprenorphine for opioid use disorder treatment. Med Care 2017; 55:336–341
38.
Stein BD, Pacula RL, Gordon AJ, et al: Where is buprenorphine dispensed to treat opioid use disorders? The role of private offices, opioid treatment programs, and substance abuse treatment facilities in urban and rural counties. Milbank Q 2015; 93:561–583
39.
Rosenblatt RA, Andrilla CHA, Catlin M, et al: Geographic and specialty distribution of US physicians trained to treat opioid use disorder. Ann Fam Med 2015; 13:23–26
40.
Jones CM, Campopiano M, Baldwin G, et al: National and state treatment need and capacity for opioid agonist medication-assisted treatment. Am J Public Health 2015; 105:e55–e63
41.
Wu L-T, Zhu H, Swartz MS: Treatment utilization among persons with opioid use disorder in the United States. Drug Alcohol Depend 2016; 169:117–127
42.
Langabeer JR, Gourishankar A, Chambers KA, et al.: Disparities between US opioid overdose deaths and treatment capacity: a geospatial and descriptive analysis. J Addict Med (Epub ahead of print, March 4, 2019)
43.
Sharma A, Kelly SM, Mitchell SG, et al: Update on barriers to pharmacotherapy for opioid use disorders. Curr Psychiatry Rep 2017; 19:35

Information & Authors

Information

Published In

Go to Psychiatric Services
Psychiatric Services
Pages: 12 - 20
PubMed: 31575353

History

Received: 21 March 2019
Revision received: 11 July 2019
Accepted: 26 July 2019
Published online: 2 October 2019
Published in print: January 01, 2020

Keywords

  1. Alcohol &amp
  2. drug abuse, Public policy issues

Authors

Details

Courtney R. Yarbrough, Ph.D. [email protected]
Department of Health Policy and Management, Rollins School of Public Health, Emory University, Atlanta (Yarbrough); Department of Public Administration and Policy, School of Public and International Affairs (Abraham), and Department of Health Policy and Management, School of Public Health (Adams), University of Georgia, Athens.
Amanda J. Abraham, Ph.D.
Department of Health Policy and Management, Rollins School of Public Health, Emory University, Atlanta (Yarbrough); Department of Public Administration and Policy, School of Public and International Affairs (Abraham), and Department of Health Policy and Management, School of Public Health (Adams), University of Georgia, Athens.
Grace Bagwell Adams, Ph.D.
Department of Health Policy and Management, Rollins School of Public Health, Emory University, Atlanta (Yarbrough); Department of Public Administration and Policy, School of Public and International Affairs (Abraham), and Department of Health Policy and Management, School of Public Health (Adams), University of Georgia, Athens.

Notes

Send correspondence to Dr. Yarbrough ([email protected]).

Competing Interests

The authors report no financial relationships with commercial interests.

Metrics & Citations

Metrics

Citations

Export Citations

If you have the appropriate software installed, you can download article citation data to the citation manager of your choice. Simply select your manager software from the list below and click Download.

For more information or tips please see 'Downloading to a citation manager' in the Help menu.

Format
Citation style
Style
Copy to clipboard

View Options

View options

PDF/EPUB

View PDF/EPUB

Login options

Already a subscriber? Access your subscription through your login credentials or your institution for full access to this article.

Personal login Institutional Login Open Athens login
Purchase Options

Purchase this article to access the full text.

PPV Articles - Psychiatric Services

PPV Articles - Psychiatric Services

Not a subscriber?

Subscribe Now / Learn More

PsychiatryOnline subscription options offer access to the DSM-5-TR® library, books, journals, CME, and patient resources. This all-in-one virtual library provides psychiatrists and mental health professionals with key resources for diagnosis, treatment, research, and professional development.

Need more help? PsychiatryOnline Customer Service may be reached by emailing [email protected] or by calling 800-368-5777 (in the U.S.) or 703-907-7322 (outside the U.S.).

Media

Figures

Other

Tables

Share

Share

Share article link

Share