Despite continued efforts of policy makers, public health advocates, and other stakeholders, the United States remains in the throes of an opioid crisis. In 2017, almost 48,000 Americans died of an opioid-related overdose (
1). An estimated 11.5 million Americans report past-year heroin use or misuse of prescription opioid pain relievers, and more than two million Americans are classified as having an opioid use disorder (
2).
Amid these trends, several changes have occurred in the U.S. health care system that may mitigate the opioid crisis by making substance use disorder treatment more accessible. Key among these health policy reforms is the expansion of Medicaid under the Affordable Care Act (
3). As of 2020, 36 states and the District of Columbia have expanded Medicaid, resulting in 12 million previously uninsured Americans gaining insurance coverage.
Medicaid expansion is particularly salient for treatment of substance use disorders, because Americans with these disorders are disproportionately unemployed and have lower incomes (
4,
5). Medicaid expansion not only extended health insurance coverage but also required Medicaid expansion plans to cover substance use disorder treatment and comply with mental health parity legislation (
3,
6). As a result, Medicaid expansion has made substance use disorder treatment more accessible and financially feasible for many low-income Americans. This is critical given the increased need for opioid use disorder treatment. Evidence-based treatment—especially receipt of medications approved by the Food and Drug Administration for opioid use disorder (i.e., methadone, buprenorphine, and naltrexone) along with psychosocial therapy—significantly increases the likelihood of sustained recovery (
7).
A handful of studies have examined the relationship between Medicaid expansion and availability of opioid use disorder medications (
8–
12). A cross-sectional study using data from the National Survey of Substance Abuse Treatment Services (N-SSATS) reported a positive correlation between Medicaid expansion and the likelihood of an individual program offering opioid use disorder medications, but this study did not measure changes in the overall supply of substance use disorder treatment programs offering these medications (
13). Two studies using State Drug Utilization Data (SDUD) found increases in prescriptions of opioid use disorder medications in Medicaid expansion states (
12,
14). However, SDUD do not include provider- or patient-level information, and therefore it is not possible to determine whether medications were prescribed for opioid use disorder or to identify the treatment setting (e.g., specialty treatment or primary care).
A study using data from the Treatment Episode Data Set (TEDS) found that the effect of Medicaid expansion on the proportion of patients receiving opioid medications was predominantly facilitated by an increase in the proportion of treatment admissions with Medicaid as the primary payment source in states that had expanded Medicaid (
10). The TEDS data have significant limitations; TEDS does not include data from all states and in many states, TEDS excludes most substance use disorder treatment programs that do not receive block grant funds (e.g., private for-profit treatment programs, which make up 36.5% of all programs and 60.6% of opioid treatment programs [OTPs]). Additionally, TEDS reports only whether a patient’s treatment plan included an opioid use disorder medication, such as buprenorphine or methadone, and not whether the patient actually received the medication nor what medication type patients received.
Most relevant to the study reported here, a study by Meinhofer and Witman (
15) examined state-level data from several data sets, including N-SSATS. Its results indicated increases in the number of OTPs (i.e., programs licensed to dispense methadone) that accepted Medicaid and the number of Medicaid-accepting OTPs that offered buprenorphine and naltrexone. However, the study did not measure the effect of Medicaid expansion on the number of OTPs and non-OTPs that offered medications independently of the programs’ Medicaid acceptance. Therefore, it is not possible to determine whether increases in the number of Medicaid-accepting OTPs that offer medications was driven by more programs accepting Medicaid, by more programs offering medications, or both. This is a critical distinction, because improving medication availability in specialty treatment programs is essential to address the opioid epidemic. Additionally, the study did not distinguish between oral and extended-release injectable naltrexone, which is important because oral naltrexone is not recommended for the management of opioid use disorder.
It is also unclear whether and how substance use disorder treatment programs may respond differentially to Medicaid expansion on the basis of program ownership. For example, for-profit treatment programs are less likely to accept Medicaid insurance than are private nonprofit treatment programs and publicly owned programs (
16,
17). A recent study showed that private for-profit programs served a significantly lower percentage of Medicaid clients, compared with nonprofit programs (
18). Thus, for-profit treatment programs may be less likely than nonprofit or publicly owned programs to respond to Medicaid expansion. Given that for-profit treatment programs make up an increasing share of the substance use disorder treatment market, it is important to understand how program ownership type may play a role in the effect of Medicaid expansion on treatment for opioid use disorders.
To address these gaps in the literature, we addressed the following research questions. What is the impact of Medicaid expansion on acceptance of Medicaid insurance and availability of opioid medications among all specialty substance use disorder treatment programs? Do the effects of Medicaid expansion vary by ownership type of OTPs and non-OTPs?
Methods
Data Sources
This study used data from the 2002–2017 N-SSATS, an annual survey of all known substance use disorder treatment programs in the United States. The average survey response rate across the study period was 93.7%. Consistent with previous studies (
19–
22), programs that did not offer substance use disorder treatment services or provided only services for persons convicted of driving under the influence or driving while impaired were excluded from the present study.
Medicaid expansion dates were drawn from the Kaiser Family Foundation and previous studies (
23). We derived state-level policy measures of prescription drug monitoring program (PDMP) implementation and enactment of pain clinic legislation from the National Alliance for Model State Drug Laws and from communications with state officials (
24–
27). We used state measures of unemployment, poverty, median income, and race-ethnicity and age distributions from the Bureau of Labor Statistics and the Census Bureau. This study focused on substance use disorder treatment programs and was not subject to institutional review board approval.
Independent Variables
The key independent variable of interest measured Medicaid expansion status (
11). States were coded as 1 if they had implemented Medicaid expansion for at least 6 months of the year and 0 otherwise. Expansion states were Alaska, Arizona, Arkansas, California, Colorado, Connecticut, Delaware, District of Columbia, Hawaii, Illinois, Indiana, Iowa, Kentucky, Louisiana, Maine, Maryland, Massachusetts, Michigan, Minnesota, Montana, Nevada, New Hampshire, New Jersey, New Mexico, New York, North Dakota, Ohio, Oregon, Pennsylvania, Rhode Island, Vermont, Virginia, Washington, and West Virginia. Nonexpansion states were Alabama, Florida, Georgia, Idaho, Kansas, Mississippi, Missouri, Nebraska, North Carolina, Oklahoma, South Carolina, South Dakota, Tennessee, Texas, Utah, Wisconsin, and Wyoming. We conducted sensitivity analyses using pre-2014 Medicaid expansion dates for the six states that expanded Medicaid before January 2014 (results not shown).
To account for state policy variation over time, all models controlled for whether a state had an operational PDMP, a mandatory-access PDMP, or a pain clinic law in effect in a given year (
13). To account for any within-state demographic or socioeconomic changes during the study period that may also have varied with treatment program availability, we controlled for state age distribution, race-ethnicity distribution, poverty and unemployment rates, and median household income (adjusted to 2017 dollars using the Consumer Price Index).
Dependent Variables
A set of continuous dependent variables measured the number of OTPs and non-OTPs per 100,000 persons in the state as follows: accepted Medicaid, offered buprenorphine, offered extended-release injectable naltrexone, accepted Medicaid and offered buprenorphine, accepted Medicaid and offered extended-release injectable naltrexone, did not accept Medicaid and offered buprenorphine, and did not accept Medicaid and offered extended-release injectable naltrexone. A second set of dependent variables measured the number of OTPs and non-OTPs (per 100,000 persons) meeting the above criteria, stratified by program ownership type: publicly owned, private for profit, and private nonprofit.
Analytic Techniques
We aggregated 2002–2017 N-SSATS program-level data to the state-year–level counts of treatment programs (N=816 state-years) and adjusted them by state population. N-SSATS began tracking buprenorphine in 2003 and extended-release injectable naltrexone in 2011. Therefore, buprenorphine analyses covered 2003–2017 (N=765 state-years), and extended-release injectable naltrexone analyses covered 2011–2017 (N=357 state-years). At the program level (N=13,783 programs in 2002; N=13,321 programs in 2017), we also calculated the percentages of OTP and non-OTP treatment programs over the study period as well as differences in OTPs and non-OTPs across key characteristics such as program ownership type, census region, Medicaid acceptance, and provision of buprenorphine and injectable naltrexone.
Descriptive statistics were calculated for all study variables, and we used t tests to examine differences in means for treatment program and state characteristics between Medicaid expansion and nonexpansion states. For our main analyses, we employed a quasi-experimental, difference-in-differences (DID) approach, conducting ordinary least-squares, two-way (state and year) fixed-effects regression models in Stata, version 15.0. State fixed effects controlled for time-invariant state characteristics, and year fixed effects accounted for secular time trends. Together, they established the DID framework, which was designed to account for baseline differences between expansion and nonexpansion states. Standard errors were clustered at the state level. To clarify the magnitude of the effects estimated in our regression models, we also calculated the percentage increase or decrease in the number of treatment programs (per 100,000 population) associated with Medicaid expansion (i.e., our DID coefficients) relative to the preexpansion number of programs.
We conducted event studies to determine whether the data satisfied the parallel-trends assumption of the DID design, which required that preexpansion trends in outcome variables for expansion and nonexpansion states move in tandem. Each dependent variable was regressed on the interaction between pretreatment year dummy variables and a dichotomous treatment group variable. The interaction coefficients were statistically nonsignificant for all outcomes, indicating that the parallel-trends assumption held for all models (results of this analysis are presented in an online supplement to this article).
Results
Descriptive Statistics
Program-level data revealed that over the study period, approximately 90% of all substance use disorder treatment programs were non-OTPs. Overall, the percentage of for-profit treatment programs increased over the study period, while the percentages of nonprofit and publicly owned treatment programs decreased. This change was more pronounced among OTPs. The percentage of for-profit OTPs increased from 43% (N=453) in 2002 to 61% (N=782) in 2017, whereas the percentage of nonprofit OTPs decreased from 43% (N=451) in 2002 to 32% (N=415) in 2017, and the proportion of publicly owned OTPs decreased from 15% (N=89) in 2002 to 7% (N=155) in 2017. (All of these percentages are based on 1,059 OTPs in 2002 and 1,286 OTPs in 2017.)
In contrast, the percentage of for-profit non-OTPs increased from 22.4% (N=2,686) in 2002 to 33.7% (N=4,016) in 2017, while the percentage of publicly owned non-OTPs decreased from 14.6% (N=1,750) in 2002 to 11.4% (N=1,369) in 2017 and the percentage of nonprofit non-OTPs decreased from 63.0% (N=7,561) in 2002 to 54.9% (N=6,549) in 2017. (All of these percentages are based on 11,997 non-OTPs in 2002 and 11,935 non-OTPs in 2017.)
We also found that OTPs and non-OTPs varied across key characteristics including census region, Medicaid acceptance, and provision of buprenorphine and injectable naltrexone. For example, in the Northeast, nonprofit OTPs represented 56% (N=206) of all OTPs, and 96% (N=351) of OTPs in this region accepted Medicaid. In contrast, most OTPs in the South (79%; N=351) and Midwest (59%; N=121) were for-profit OTPs, and only 35% (N=120) and 43% (N=52) of these OTPs accepted Medicaid, respectively. We noted a similar pattern among non-OTPs. About 68% (N=398) of for-profit non-OTPs in the Northeast accepted Medicaid, whereas only about 42% (N=563 and N=390) of for-profit non-OTPs in the South and Midwest, respectively, accepted Medicaid. Finally, across all regions, only 24.7% (N=2,945) of non-OTPs offered buprenorphine, compared with 66% (N=843) of OTPs, and 29% (N=367) of OTPs and 23.2% (N=2,772) of non-OTPs offered injectable naltrexone.
Table 1 presents descriptive statistics for states by Medicaid expansion status. Statistics represent mean values over the study period (see
online supplement for descriptive statistics for pre- and postexpansion periods).
The number of OTPs (per 100,000 persons) accepting Medicaid was five times higher in expansion states than in nonexpansion states (0.35 vs. 0.07, p<0.01). The number of non-OTPs accepting Medicaid was slightly higher (but not significantly higher) in expansion states than in nonexpansion states (3.15 vs. 2.89). Compared with nonexpansion states, the number of OTPs and non-OTPs offering buprenorphine was significantly higher in Medicaid expansion states—2.3 times higher for OTPs and 1.4 times higher for non-OTPs (p<0.01). Likewise, the number of OTPs offering extended-release injectable naltrexone was 3.5 times higher in Medicaid expansion states, compared with nonexpansion states (p<0.01). No statistically significant difference was found in the number of non-OTPs offering extended-release injectable naltrexone.
DID–Ordinary Least-Squares Regression Results
We present all results as the number of substance use disorder treatment programs population-adjusted per 100,000 persons. As shown in
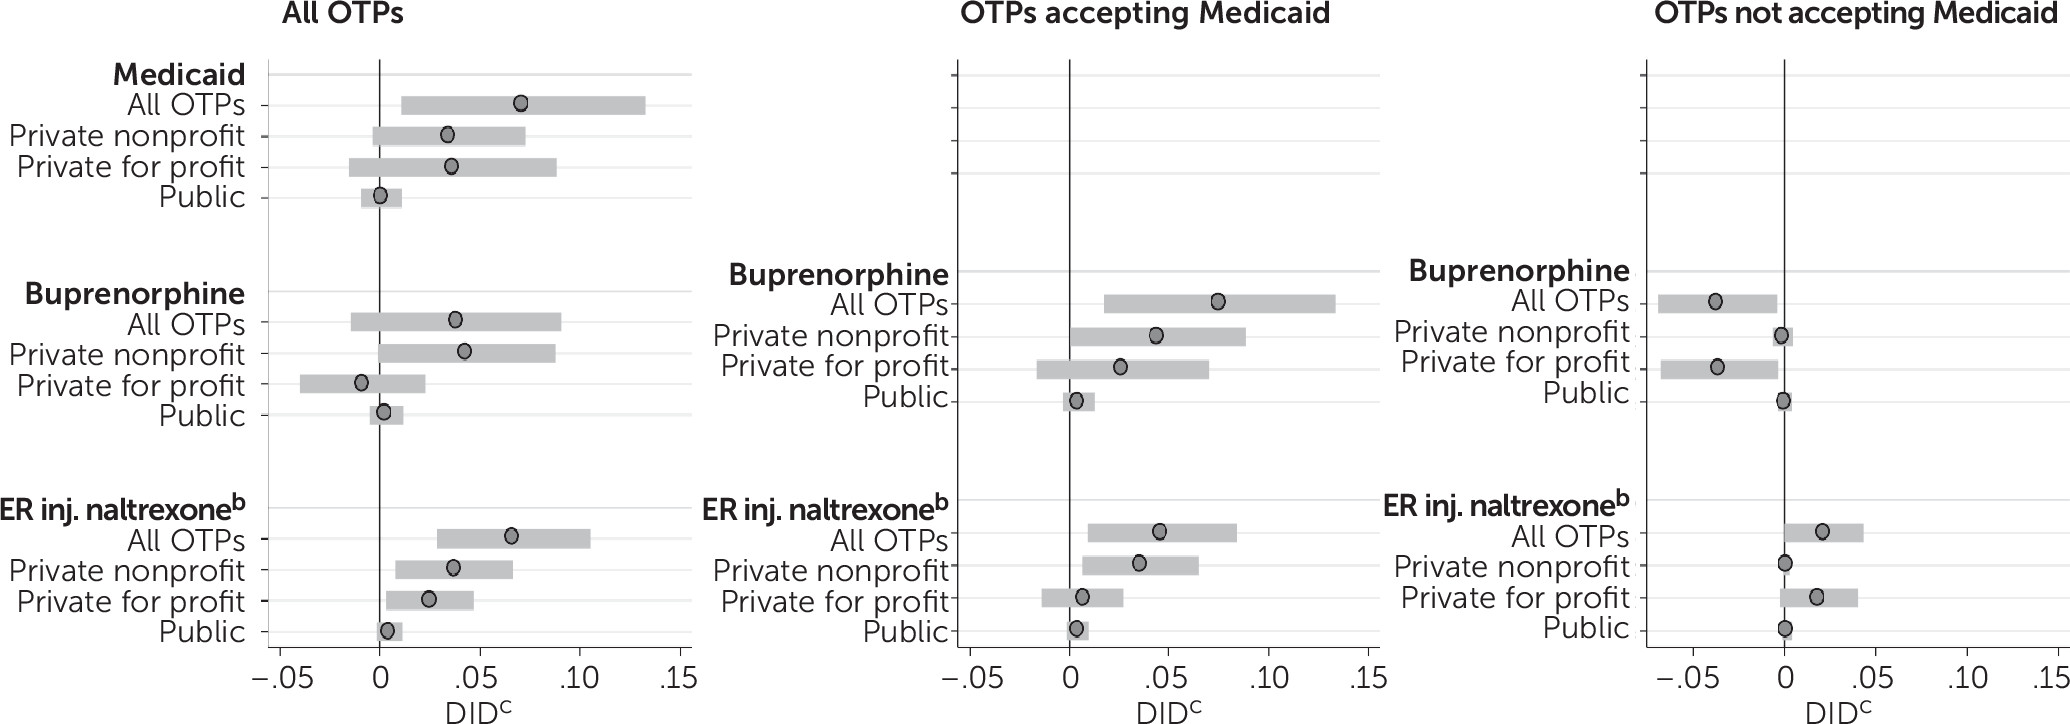
Figure 1, Medicaid expansion was associated with a 0.072 increase in the number of OTPs (per 100,000 persons) that accepted Medicaid (p<0.05) (see
online supplement for full regression results). Expansion was also associated with a 0.067 increase in the number of OTPs offering injectable naltrexone (p<0.01). No statistically significant change was noted in the number of OTPs offering buprenorphine after Medicaid expansion.
Among programs accepting Medicaid, expansion was associated with a 0.08 (per 100,000 persons) increase in the number of OTPs offering buprenorphine (p<0.05) and a 0.05 increase in the number OTPs offering injectable naltrexone (p<0.05). This translated to a 53.0% increase in the number of OTPs offering buprenorphine and a 70.3% increase in the number of OTPs offering injectable naltrexone. Among OTPs not accepting Medicaid, expansion was associated with a significant decrease in the number offering buprenorphine (−0.04, p<0.05).
Results disaggregated by program ownership type revealed that Medicaid expansion was associated with a marginally significant increase in the number of nonprofit OTPs (per 100,000) offering buprenorphine (0.04, p=0.05) and a significant increase in the number of nonprofit OTPs offering extended-release injectable naltrexone (0.04, p<0.05) (
Figure 1). Among OTPs that accepted Medicaid, its expansion was associated with a 0.043 increase in the number of nonprofit OTPs offering buprenorphine (p<0.05) and a 0.037 increase in the number of nonprofit OTPs offering extended-release injectable naltrexone (p<0.05). This translated to a 64.4% increase in the number of nonprofit OTPs offering buprenorphine and a 135.1% increase in the number of nonprofit OTPs offering injectable naltrexone.
Medicaid expansion was associated with an increase of 0.02 in the number of for-profit OTPs (per 100,000) offering extended-release injectable naltrexone (p<0.05). However, Medicaid expansion was not associated with changes in public OTPs accepting Medicaid or offering opioid use disorder medications (see leftmost graph in
Figure 1). As shown in
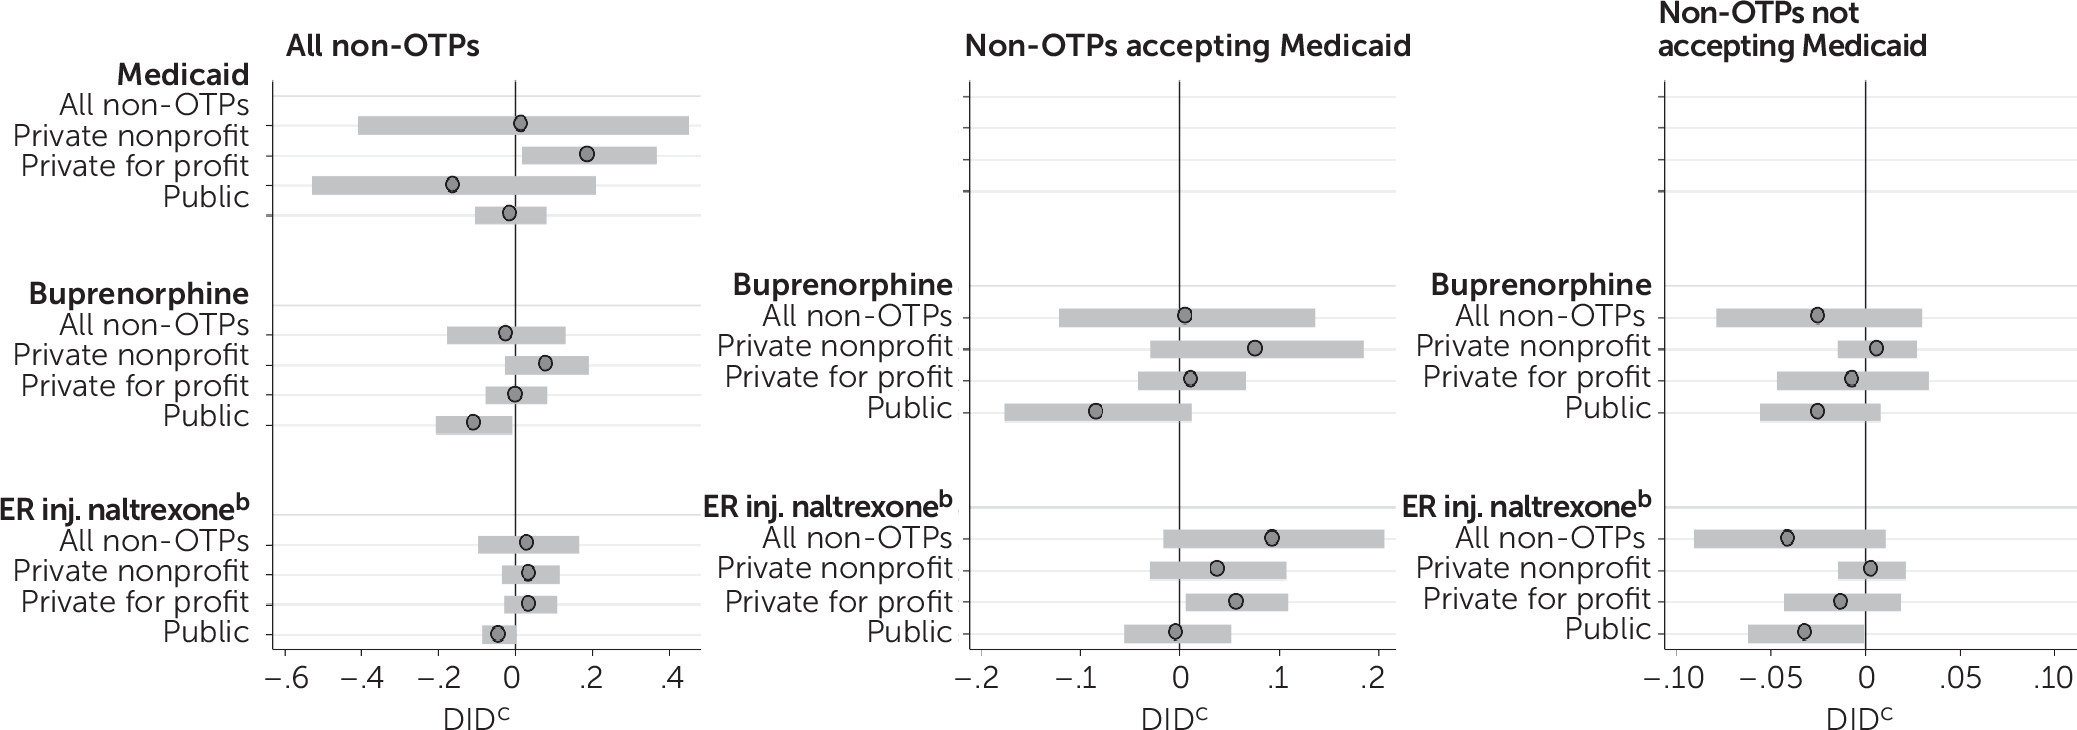
Figure 2, estimates for non-OTPs show no consistent associations between Medicaid expansion and Medicaid acceptance or opioid use disorder medication availability (see
online supplement for full regression results). Although the number of OTPs in a state accepting Medicaid increased significantly after Medicaid expansion, the overall number of non-OTPs accepting Medicaid did not change. Nonprofit non-OTPs were the exception, showing significant increases in Medicaid acceptance postexpansion. Among both OTPs and non-OTPs, no significant increases were detected in buprenorphine offerings at the 95% confidence level. For extended-release injectable naltrexone, however, the number of OTPs offering the medication increased but the number of non-OTPs offering it did not. Similarly, among Medicaid-accepting programs, more OTPs offered both buprenorphine and extended-released injectable naltrexone postexpansion, but the number of non-OTPs offering these medications did not change.
Discussion
Our findings indicate that the effects of Medicaid expansion were concentrated in OTPs. Among OTPs that accepted Medicaid, we found increases in the number of those offering buprenorphine (53% increase) and injectable naltrexone (70% increase). Furthermore, Medicaid expansion was associated with increases in the number of nonprofit and for-profit OTPs offering injectable naltrexone (135% and 58% increase, respectively). However, the effects of expansion on buprenorphine availability were limited to nonprofit OTPs (64% increase). Although these are meaningful effects, the estimated increases were limited to a very small and geographically narrow segment of the specialty substance use disorder treatment system, because only 10% of all substance use disorder treatment programs were OTPs in 2017.
Notably, the composition of the specialty system has changed dramatically over the past 15 years. Private for-profit treatment programs make up an increasing share of the market, whereas the market share of both private nonprofit and publicly owned treatment programs has steadily declined, particularly among OTPs. Thus, increased buprenorphine availability resulting from Medicaid expansion was concentrated in a notably small and shrinking sector of the specialty substance use disorder treatment system—nonprofit OTPs, which comprise only about one-third of all OTPs and <4% of all substance use disorder treatment programs.
There are several reasons that we may expect OTPs to be more responsive to Medicaid expansion than non-OTPs. OTPs are required under federal law to be accredited, which has been shown to be positively associated with both Medicaid acceptance and adoption of opioid use disorder medications (
16,
17,
22,
28–
30). OTPs are also required to provide medical services and have medical staff, which facilitates the adoption of medications (
28,
29,
31–
35). Importantly, OTPs have overcome the stigma often associated with initial provision of medications and already have a business model focused on the delivery of opioid use disorder medications.
Our findings also suggest that Medicaid expansion has been more effective in incentivizing both for-profit and nonprofit OTPs to offer injectable naltrexone, but it has been less effective in incentivizing for-profit OTPs to offer buprenorphine. For-profit OTPs may view the fixed costs associated with buprenorphine adoption as too high, or they may view buprenorphine as unprofitable because of the low Medicaid reimbursement rates or the high costs of employing or contracting with a buprenorphine-waivered provider. They may also face a local shortage of waivered providers. Thus, additional incentives are likely needed to facilitate adoption of buprenorphine by for-profit programs.
Our results suggest that the increases in buprenorphine availability among Medicaid-accepting OTPs that were observed in previous studies were driven largely by OTPs that prior to Medicaid expansion offered buprenorphine but did not accept Medicaid and began accepting Medicaid in response to expansion (
15). We did not observe independent increases in the number of programs offering buprenorphine, irrespective of Medicaid acceptance. This is disheartening—although affordability of substance use disorder treatment has improved for low-income individuals because Medicaid expansion has encouraged greater Medicaid acceptance, overall access to evidence-based medications has not substantially increased with expansion.
Our findings should be considered in light of existing geographic disparities in access to OTPs, which greatly limit the availability of methadone and other opioid use disorder medications (
19,
36,
37). OTPs are geographically concentrated in urban areas and the Northeast. Notably, opioid use disorder treatment capacity is lowest in the South and Midwest; capacity is particularly low for Medicaid enrollees in these regions (
19,
36,
38). This may be related to regional differences in program ownership and Medicaid acceptance. For example, the Northeast is the only region dominated by nonprofit OTPs, and almost all OTPs in the Northeast accept Medicaid. In contrast, the South and Midwest are dominated by for-profit OTPs, and fewer than half of these OTPs accept Medicaid.
Previous research also suggests that OTPs may lack the capacity to adequately respond to Medicaid expansion. Jones and colleagues (
38) reported that 82.0% of OTPs were already operating at 80.0% or greater capacity before Medicaid expansion. Several recent studies found that treatment capacity has not increased in response to expansion (
9,
10,
18,
23). Instead, the percentage of uninsured patients receiving treatment in specialty treatment programs has decreased and the percentage of patients receiving Medicaid-covered treatment in expansion states has increased roughly equally (
18). Therefore, even with increased rates of Medicaid acceptance and availability of opioid use disorder medications, OTPs may lack the capacity to treat additional patients.
The overall lack of response to Medicaid expansion among non-OTPs is disappointing, given that they make up 90% of the specialty treatment system and offer buprenorphine at consistently low rates. In 2017, roughly a quarter of non-OTPs offered buprenorphine, compared with almost two-third of OTPs. The failure of non-OTPs to offer buprenorphine severely limits access to this medication within the specialty treatment system for Americans who do not have access to an OTP in their community (or to an OTP that accepts their insurance if they cannot afford to pay for services out of pocket).
We note several limitations of this study. First, the data in N-SSATS represent repeated cross-sectional assessments and do not include unique program identifiers to match individual programs across study years. Therefore, we were unable to track changes within individual treatment programs over time. Second, because N-SSATS does not include the number of patients treated or consistent measures of program capacity, we could not determine whether overall treatment access has increased because of within-program capacity growth. Third, N-SSATS data are self-reported. Fourth, N-SSATS does not capture treatment outside the specialty treatment system. However, in 2017, a total of 2.5 million of the 4.0 million Americans receiving any substance use disorder treatment received it in a specialty treatment setting (
39).
Conclusions
The principal effect of Medicaid expansion on the availability of opioid use disorder treatment has been an increase in the number of OTPs accepting Medicaid and offering extended-release injectable naltrexone. Medicaid expansion has not led to substantial increases in substance use disorder treatment programs (i.e., OTPs or non-OTPs) offering buprenorphine. Results from analyses stratified by program ownership indicated that the effects of Medicaid expansion were concentrated in for-profit and nonprofit OTPs, which greatly limits improvements in opioid use disorder treatment made possible through expansion. Nonprofit OTPs, the programs most responsive to Medicaid expansion, are a shrinking sector of the specialty substance use disorder treatment system. Our findings suggest that disparities in access to opioid use disorder treatment for Medicaid enrollees will continue to grow, particularly in nonexpansion states. Ultimately, the limited impact of Medicaid expansion on the specialty system may perpetuate gaps in the accessibility and quality of opioid use disorder treatment for Medicaid enrollees and fail to reduce high rates of opioid use disorder and opioid overdose deaths in this vulnerable population.


