Demographic characteristics of 1,719 patients who received at least one antipsychotic drug prescription during the 12-month interval of the QI project are provided in
Table 1. Diagnostic information represented clinical diagnoses extracted from the EHR. Many patients had overlapping psychiatric diagnoses, in particular, diagnoses of mood and anxiety disorders; 30% of the patients (N=517) had a schizophrenia spectrum disorder. Notably, many people in the clinic without a primary psychotic disorder received antipsychotic drugs.
Metabolic Laboratory Monitoring Rates
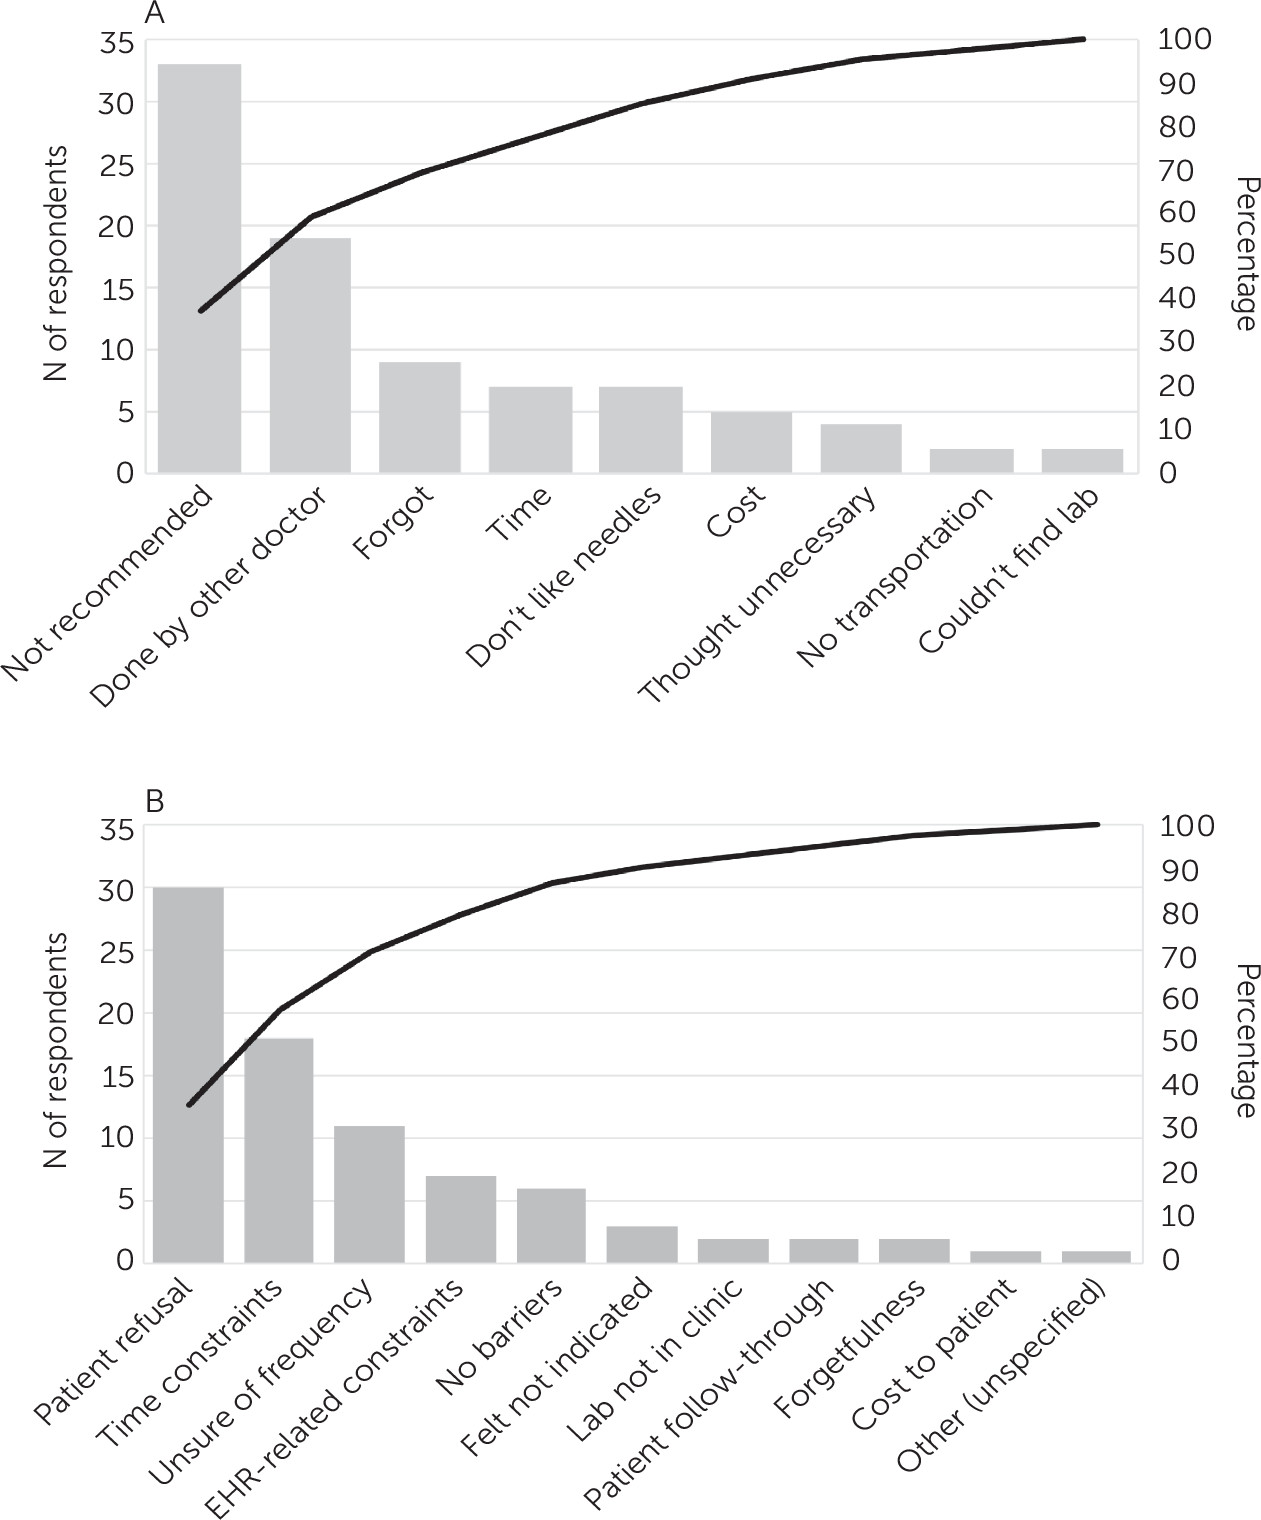
Pareto charts based on the responses to the surveys on patient- and provider-perceived barriers to cardiometabolic monitoring are shown in
Figure 1. Patients noted as the biggest monitoring barrier the fact that the monitoring was not recommended by their provider, and providers reported that some patients did not want to undergo laboratory testing.
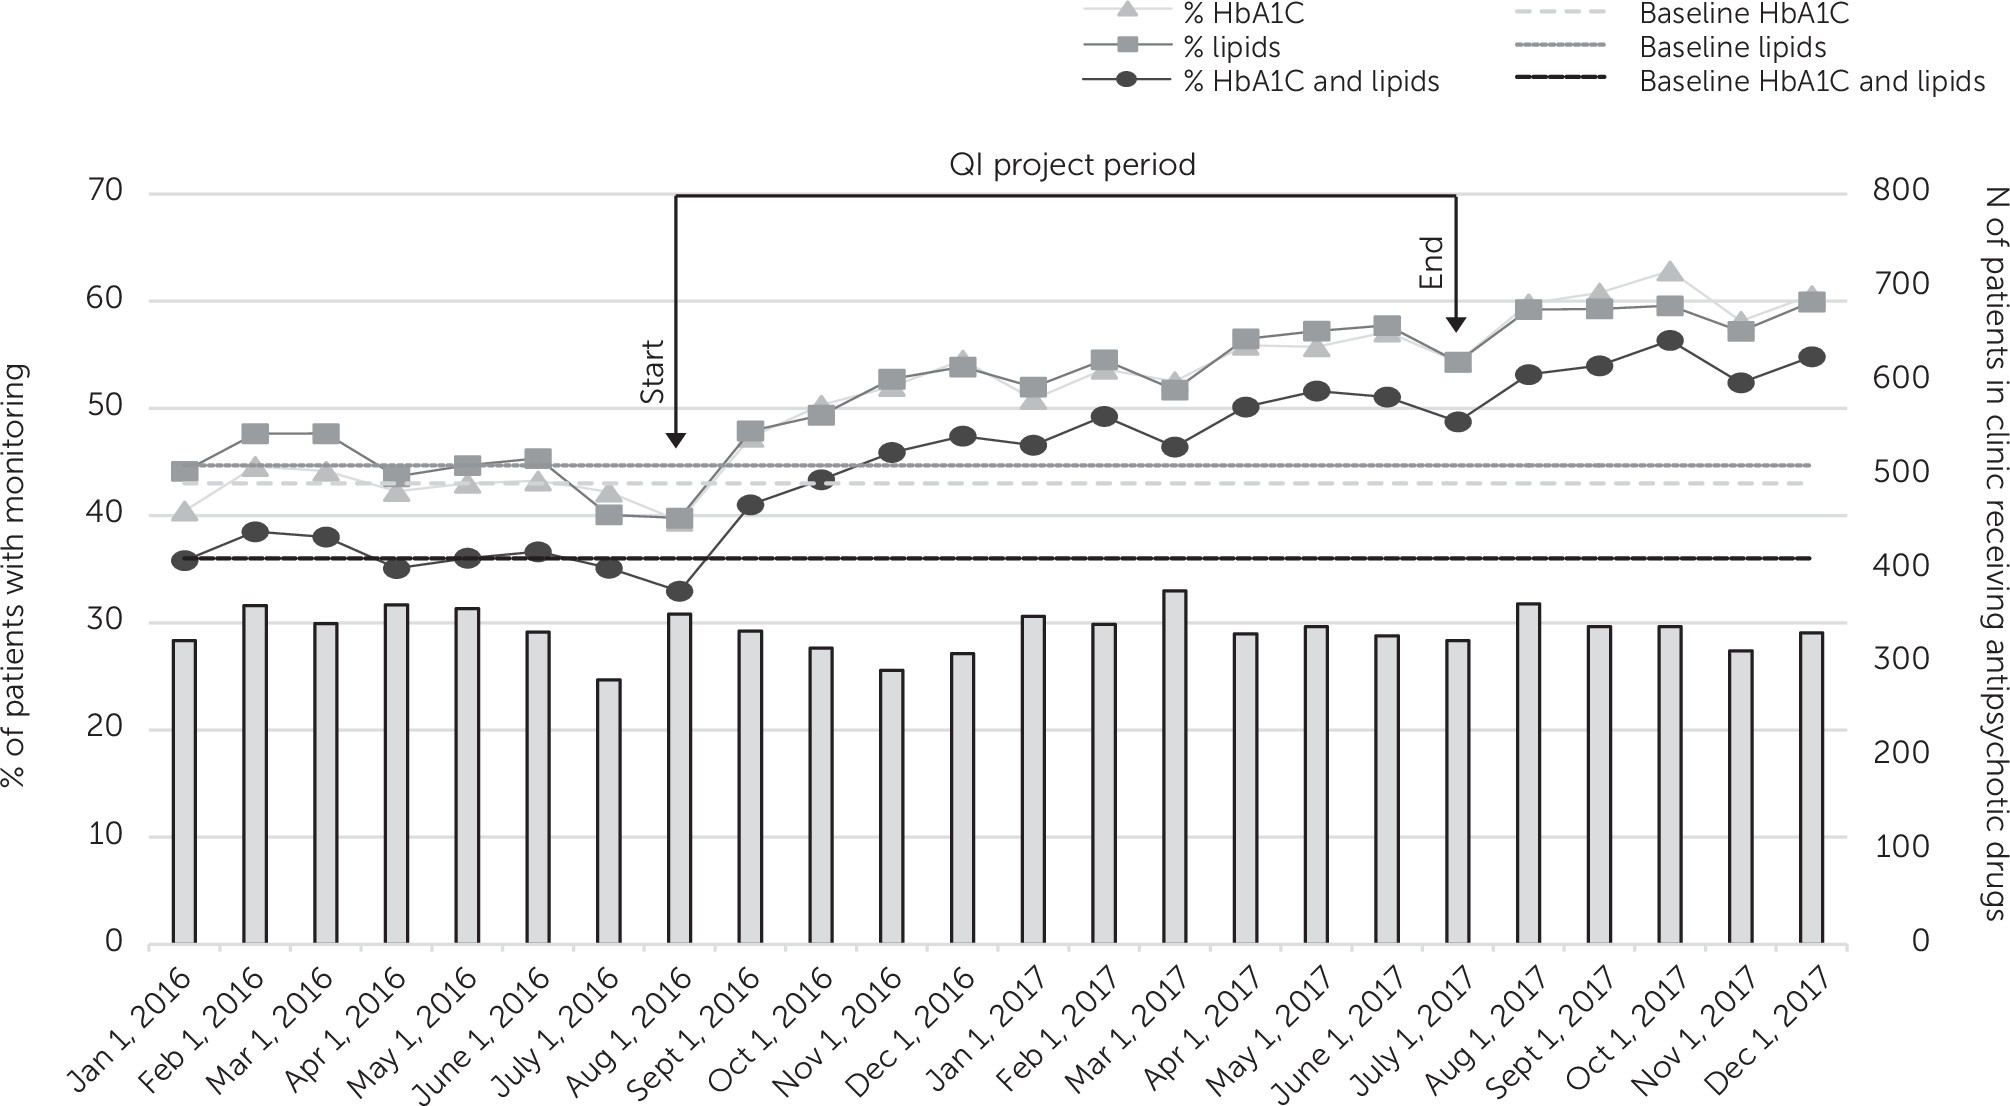
During the 6-month preintervention period, the percentage of patients taking antipsychotic drugs who received guideline-concordant metabolic monitoring ranged from 33% to 38%. The clinic had no statistically significant change in metabolic monitoring rates during this 6-month baseline period preceding the initiation of the QI intervention. During the intervention period, monitoring rates significantly increased for all three outcomes compared with baseline (HbA1C: b=0.16, z=8.9, p<0.001; lipids: b=0.12, z=7.6, p<0.001; HbA1C and lipids [primary outcome]: b=0.15, z=9.1, p<0.001). Consistent with these results, the data in
Figure 2, depicting monitoring over time, indicated a shift above the respective baseline median lines for each of the three outcome variables. Guideline-concordant monitoring of the combined measures of HbA1C and lipids increased from 33% at the beginning of the QI intervention period (August 2016) to 49% at the end of the intervention (July 2017).
To address the possibility that the change in monitoring rates could have been due to factors unrelated to the QI project, we identified a comparison clinic within the same medical system at a different geographic location that also served a large population of patients with serious mental illness receiving antipsychotic drugs, previously described by Perrin et al. (
27). The aforementioned model was applied to both the intervention clinic and the comparison clinic and analyzed as a three-way interaction among time, clinic, and QI project initiation.
At the comparison clinic, baseline rates of metabolic monitoring were lower than at the intervention clinic, ranging from 17% to 23% during the 6-month preintervention period. Furthermore, the rate of monitoring slowly increased, unlike the rate at the intervention clinic, which had a flat pre-QI baseline. Monitoring rates at the comparison clinic continued to slowly increase at approximately the same rate during the QI phase of the intervention clinic and showed no acceleration or deceleration. The analysis of the three-way interaction between clinic, time, and intervention was significant in all three models (HbA1C: b=−0.13, z=−4.4, p<0.001; lipid: b=−0.06, z=−2.3, p=0.02; HbA1C and lipids: b=−0.12, z=−4.2, p<0.001), indicating a significant change in the monitoring rate at the intervention clinic that differed from the more steady change in the rate at the comparison clinic during the QI application phase. The patient population receiving antipsychotic drugs at the two clinics remained stable over the study period.
To address the possibility that the increase in monitoring rates could be accounted for by measurement bias, we conducted chart reviews. All patients who were prescribed any antipsychotic drugs and who did not have annual HbA1C or lipid monitoring were identified. Only two instances of false positives were noted, and these were due to laboratory tests having been performed after reminders had been entered into the EHR.
Attempts at obtaining laboratory results from outside laboratories and nonaffiliated clinics proved challenging. For the first 50 forms completed, sent, and followed up with multiple phone calls, only nine laboratories and clinics returned guideline-concordant results. Given the low rate of return relative to the effort required, this clerical process was eventually discontinued. The forms remained available for use by individual providers. Providers were also instructed to provide feedback to the QI team for inappropriate monitoring reminders (i.e., EHR reminders despite evidence of completed laboratory testing). Only four such reports were received, and these were also due to laboratory tests having been performed after reminders had been entered.
The providers’ perception of burden due to the QI efforts were assessed in a postintervention survey (
Table 2). Most providers (34 of 44, 77%) did not find the reminders to be burdensome. To determine whether the improvements observed during the QI initiative were sustained, mean rates of metabolic monitoring from the 6 months immediately after the active QI phase (August 2017–January 2018) were compared with the mean rates of monitoring 22–27 months after the active QI phase (May 2019–October 2019). The monitoring rates were sustained for HbA1C (60.2% vs. 60.7%, respectively), lipids (58.9% vs. 60.3%, respectively), and both HbA1C and lipids (54.0% vs. 54.2%, respectively).


