Abstract

Objective:

The authors aimed to analyze psychiatrists’ and other physicians’ acceptance of insurance and the associations between insurance acceptance and specific physician- and practice-level characteristics.

Methods:

Using the restricted version of the National Ambulatory Medical Care Survey, January 2007–December 2016, the authors analyzed acceptance of private insurance, public insurance, and any insurance among psychiatrists compared with nonpsychiatrist physicians. Because data were considered restricted, all analyses were conducted at federal Research Data Center facilities.

Results:

The unweighted sample included an average of 4,725 physicians per 2-year time grouping between 2007 and 2016, with an average of 7% being psychiatrists. Nonpsychiatrists participated in all insurance networks at higher rates than did psychiatrists, and the acceptance gap was wider for public (Medicare and Medicaid) than private (noncapitated and capitated) insurance. Among psychiatrists, those practicing in metropolitan statistical areas and those in solo practices were significantly less likely than their peers in other locations and treatment settings to accept private, public, or any insurance. These findings were also observed among nonpsychiatrists, although to a lesser extent.

Conclusions:

In addition to general policy interventions to improve insurance network adequacy for psychiatric care, additional measures or incentives to promote insurance network participation should be considered for psychiatrists in solo practices and those in metropolitan areas.

HIGHLIGHTS

Psychiatrists were less likely than other physicians to participate in public (Medicare, Medicaid) and private (noncapitated private, capitated private) insurance networks.
Insurance acceptance gaps between psychiatrists and other physicians were more pronounced for public than for private insurance.
Among all physicians, those practicing in metropolitan areas and solo practices were less likely to participate in insurance networks than physicians practicing in other locations and settings, a finding that was more pronounced among psychiatrists.
In addition to general policy interventions to improve insurance network adequacy for psychiatric care, additional measures to promote insurance network participation should be considered for psychiatrists in solo practices and in metropolitan areas.
Despite plentiful evidence supporting effective treatments for mental disorders, access to these treatments remains limited in the United States. According to data from the Substance Abuse and Mental Health Services Administration’s 2018 National Survey on Drug Use and Health, less than half of adults diagnosed as having psychiatric disorders received treatment for their illness (1), in part because of shortages of mental health practitioners throughout much of the country, especially in underserved communities (25). In this context, primary care has increasingly become the de facto mental health care system in the United States (6), with clinicians in this setting seeing 60% of patients treated for depression (7) and prescribing 79% of antidepressant medications (7).
Mental health workforce shortages are further complicated by the relatively small proportion of psychiatrists accepting insurance for reimbursement. Using data from the National Ambulatory Medical Care Survey (NAMCS) between 2005 and 2010, one study estimated that 55.3%, 54.8%, and 43.1% of psychiatrists accepted commercial insurance, Medicare, and Medicaid, respectively (3). In comparison, the corresponding percentages for all other physicians in 2010 were 88.7%, 86.1%, and 73.0% (3).
A more recent study using NAMCS data from 2010 to 2015 found that the Medicaid expansion by the Affordable Care Act in 2014 was not associated with a change in the likelihood of psychiatrists to accept Medicaid, whereas an increased likelihood was observed for nonpsychiatrist specialists (8). Hypothesized reasons for these differences have included relatively low mental health reimbursement rates; the shortage of psychiatrists in many parts of the United States, increasing patients’ willingness to pay cash; and the large proportion of psychiatrists working in solo practices, which reduces negotiation leverage for insurance contracting and increases associated administrative costs (9).
Studies using “secret shopper” methods have reported that, even when psychiatrists are in network, only a small fraction are available to see new patients (10). Furthermore, multiple studies have found that a disproportionate share of treatment for patients with mental disorders is delivered out of network (1, 11) and that self-pay visits are more common for mental than general medical health care (12). These trends have paralleled a proliferation of nonphysician clinicians (e.g., advanced practice nurses) in the mental health workforce (13, 14).
This study aimed to use the restricted version of the NAMCS data set, which is not publicly available, to analyze acceptance of insurance among psychiatrists and nonpsychiatrists and to examine the associations between specific physician characteristics and insurance acceptance.

Methods

Data Source

This investigation used 10 years of data (January 2007–December 2016) from the restricted version of the NAMCS data set, which includes several variables that are not available in the public version. Before the data required for this project were available, a detailed proposal was reviewed and approved by the National Center for Health Statistics (NCHS). After approval, specific variables were made available to the primary investigator (A.D.C.) at secure United States Census Research Data Center locations in Seattle and Chicago. All data outputs were reviewed for disclosure risk and approved by NCHS staff before publication.
The NAMCS is conducted annually by the NCHS and includes a random sample of patient encounters with physicians who are not federally employed, not based in hospitals, younger than 85 years, and engaged in outpatient care (3, 8, 12, 15). The NAMCS incorporates a multistage sampling framework, with strata defined by geographic region and physician specialty. The primary sampling unit is the physician-patient encounter (15). The NAMCS provides physician- and visit-level weights to facilitate national estimates (15).

Study Sample

To ensure that sampling was consistent across all years of the observation period, we excluded data from providers at community health centers, and all NAMCS participants in this study were physicians (15). To remain consistent with previous studies (3), we restricted sampling to physicians accepting new patients, which varied in number across the years of the study period for both psychiatrists and nonpsychiatrist physicians. For Medicare analyses, pediatricians were excluded because few engage with Medicare beneficiaries (3).

Variables

The primary dependent variables of interest were acceptance of Medicare, Medicaid, capitated private insurance, and noncapitated private insurance. In the NAMCS, physicians are asked, “Are you currently accepting new patients into your practice?” They are then asked, “From those new patients, do you accept Medicare [Medicaid, noncapitated commercial insurance, etc.]?” with each insurer listed in a separate question item (15). In this study, these dependent variables were also categorized into public insurance (Medicare and Medicaid), private insurance (capitated private insurance and noncapitated private insurance), and any insurance. Primary independent variables included physician specialty (grouped into psychiatrists and nonpsychiatrists) and time (in groups of 2 years, from 2007 to 2016). Additionally, analyses included other independent variables of interest, such as practice setting (group vs. solo), country of medical school (United States vs. other nation), age, sex, and location (metropolitan statistical area [MSA] vs. non-MSA, according to U.S. census region). Because of the relatively small absolute counts of psychiatrists in annual NAMCS samples, age was dichotomized into physicians ages ≥45 and those ages <45.

Descriptive Statistics

First, we calculated differences between psychiatrists and other physicians included in the sample from 2007 to 2016 (in 2-year groupings) in terms of the weighted and unweighted demographic characteristics and other physician and practice characteristics. We then calculated the weighted and unweighted proportions of psychiatrists across all years and in 2-year groupings between 2007 and 2016 (both stratified by physician and practice characteristics and irrespective of these characteristics) who accepted Medicare, Medicaid, capitated private insurance, noncapitated private insurance, any private insurance, any public insurance, and any insurance. Next, we performed similar calculations for nonpsychiatrists and compared the results with those of psychiatrists. Statistical tests for significance of 2×2 comparisons (e.g., psychiatrist insurance acceptance in MSAs vs. non-MSAs) were conducted with chi-square tests, and comparisons of two means or percentages (e.g., psychiatrist vs. nonpsychiatrist Medicare acceptance in 2007–2008) were conducted by using z tests. Statistical testing of higher-order comparisons (e.g., male vs. female insurance acceptance between psychiatrists and nonpsychiatrists) was conducted with univariate logistic regression models that included interaction terms.

Analyses

All statistical analyses were weighted at the physician level. For each of the 28 statistical models in this investigation, we performed a Hosmer-Lemeshow test (16) and assessed for multicollinearity, providing generalized variance inflation factors (17) for each included variable.
First, we specified 14 logistic regression models—seven for psychiatrists and seven for nonpsychiatrists—to estimate the odds ratios of insurance acceptance over time, in 2-year groupings between 2007 and 2016. For each model, the dependent variable was a payer (e.g., Medicare), and the independent variables included time and all previously mentioned variables of interest. Next, for the time variable in each model, we calculated average marginal effects (AMEs) for each time level, relative to the first (i.e., the 2007–2008 grouping). We then used z tests to compare AMEs across comparable variables and levels in order to determine whether psychiatrists and nonpsychiatrists significantly differed in AMEs (18). We used a Bonferroni correction to account for multiple comparisons of AMEs (19), which reduced the familywide error rate of 0.050 for individual tests to 0.013. Therefore, for comparisons of AMEs in this part of the analysis, a p<0.013 was considered statistically significant.
Restricting the sample to psychiatrists only, we then specified seven logistic regression models, one for each payer or insurance category, to estimate the odds ratios of insurance acceptance among psychiatrists in aggregate across all years between 2007 and 2016. For each model, the dependent variable was a payer (e.g., Medicare), and the independent variables were all aforementioned independent variables of interest. We then specified seven similar logistic regression models for nonpsychiatrists. As above, we used z tests to compare AMEs across comparable periods (18). We again used a Bonferroni correction to account for multiple comparisons of AMEs (19), which reduced the familywide error rate of 0.050 for individual tests to 0.009. Therefore, for comparisons of AMEs in this part of the analysis, a p<0.009 was considered statistically significant. Detailed descriptions of each model described above, in addition to Hosmer-Lemeshow and multicollinearity test results, are provided in Tables S1–S4 in the online supplement to this article.

Results

Sample Characteristics

The unweighted sample included on average 4,725 physicians per 2-year time group between 2007 and 2016. On average, 307 (7%) of these physicians were psychiatrists, with counts of psychiatrists for each 2-year block ranging from 181 (2015–2016) to 479 (2011–2012), compared with 2,771 (2009–2010) to 6,885 (2013–2014) for nonpsychiatrists. Weighted and unweighted sample characteristics for psychiatrists and nonpsychiatrists across all years are shown in Table 1. Additional sample characteristics by 2-year time grouping, both weighted and unweighted, are available in Tables S5 and S6 in the online supplement.
TABLE 1. Characteristics of psychiatrists and other physicians participating in the National Ambulatory Medical Care Survey, 2007–2016a
 Unweighted %
 Weighted %Psychiatrists (N=1,535)Other physicians (N=22,092)All physicians (N=23,627)
CharacteristicPsychiatrists (N=1,535)Other physicians (N=22,092)All physicians (N=23,627)N%N%N%
Sexb         
 Male6873731,0276716,6577517,68475
 Female322728508335,435255,94325
Age (in years)c         
 <45162626232155,633255,86525
 ≥458474741,3038516,4597517,76275
Regionc         
 Northeast292021382253,727174,10917
 Midwest152121300205,472255,77224
 South283535463308,010368,47336
 West292424390254,883225,27322
Urbanicityc         
 MSA9591911,4289319,7969021,22490
 Non-MSA59910772,296102,40310
IMG statusd         
 IMG282626368244,184194,55219
 Non-IMG7274741,0046515,2366916,24069
 NA   163112,672122,83512
Practice typec         
 Group3567665443514,7656715,30965
 Solo653335921606,674307,59532
 NA   70565337233
a
IMG, international medical school graduate; MSA, metropolitan statistical area; NA, not applicable (because of missing data).
b
Weighted, p=0.002; unweighted, p<0.001.
c
Weighted, p<0.001; unweighted, p<0.001.
d
Weighted, p=0.237; unweighted, p<0.001.

Insurance Acceptance Over Time Among Psychiatrists and Nonpsychiatrists

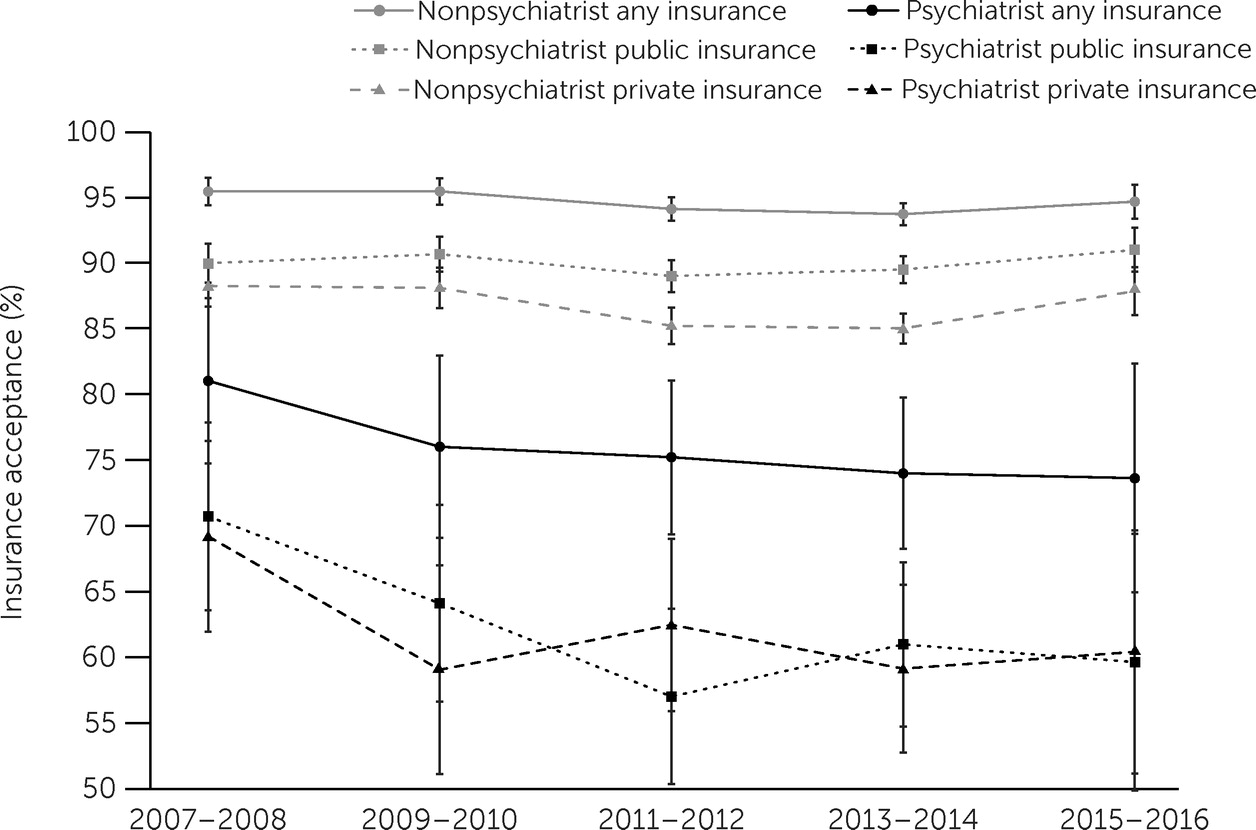
Weighted estimates for proportions of physicians accepting new patients with any private insurance, any public insurance, and any insurance in 2-year time groupings among psychiatrists and nonpsychiatrists are shown in Figure 1. For all insurer groupings and periods, nonpsychiatrists accepted insurance at higher rates than psychiatrists. The average gap between nonpsychiatrists and psychiatrists was widest for public insurance (28 percentage points). Details for individual insurers and groupings over time are shown in Table S7 in the online supplement.
FIGURE 1. Insurance network participation of psychiatrists and other physicians, by insurance type, 2007–2016
Results of time-trend logistic regression analyses of AMEs for each payer category and time grouping are shown in Table S8 in the online supplement. Differences in AMEs between psychiatrists and nonpsychiatrists were found to be largely statistically insignificant, meaning that changes in insurance network participation in each 2-year grouping relative to the baseline period (2007–2008) were similar across the two groups of physicians. However, we noted some exceptions, such as for Medicare in 2009–2010 and any public insurance in 2009–2010; in both cases, insurance network participation decreased to a greater extent for psychiatrists than for nonpsychiatrists.

Association Between Psychiatrist Characteristics and Insurance Acceptance

Adjusted ORs (AORs) for associations between physician or practice characteristics and insurance acceptance among psychiatrists across all study years are displayed in Table 2. Psychiatrists practicing in the Midwest were significantly more likely than those in the Northeast to accept private (AOR=1.25) or any insurance (AOR=1.16). In MSAs, psychiatrists were less likely than those outside of MSAs to accept any private (AOR=0.85), any public (AOR=0.78), or any insurance (AOR=0.83). The same was true for psychiatrists in solo practices, relative to those in group practices, in terms of accepting any private (AOR=0.90), any public (AOR=0.76), or any insurance (AOR=0.83). Descriptive weighted and unweighted associations between physician characteristics and insurance acceptance among psychiatrists, in addition to AORs for individual payers, are shown in Tables S9–S11 in the online supplement.
TABLE 2. Association between characteristics of psychiatrists and insurance acceptance, 2007–2016a
 Any private insuranceAny public insuranceAny insurance
CharacteristicAOR95% CIpAOR95% CIpAOR95% CIp
Female sex (reference: male sex).94.86–1.02.1591.00.92–1.08.995.98.91–1.06.630
Age ≥45 years (reference: age <45)1.03.93–1.15.5361.07.97–1.20.1841.07.97–1.18.171
Region (reference: Northeast)         
 Midwest1.251.13–1.38<.0011.09.98–1.21.1261.161.06–1.27.001
 South1.09.99–1.21.0811.07.97–1.18.1871.06.97–1.16.173
 West1.06.95–1.18.268.95.86–1.06.3471.07.97–1.18.185
MSA (reference: non-MSA).85.74–.98.021.78.71–.86<.001.83.78–.87<.001
IMG (reference: U.S. medical school)1.03.95–1.13.4791.121.04–1.22.0051.121.04–1.20.002
Solo practice (reference: group practice).90.84–.98.010.76.71–.82<.001.83.78–.88<.001
a
AOR, adjusted OR; IMG, international medical school graduate; MSA, metropolitan statistical area.

Association Between Psychiatrist and Nonpsychiatrist Characteristics and Insurance Acceptance

Comparisons of AMEs for acceptance of any insurance among psychiatrists and nonpsychiatrists for all physician and practice characteristics are displayed in Table 3. We noted statistically significant differences in insurance acceptance between psychiatrists and nonpsychiatrists for MSA practice settings (p<0.001), indicating that the difference in likelihood of insurance acceptance between psychiatrists in MSAs and psychiatrists outside of MSAs—with those in MSAs being less likely to accept insurance—was larger than the corresponding difference for nonpsychiatrists. Similarly, all types of physicians working in solo practices were less likely to accept insurance than physicians in other settings, although nonacceptance was more likely for psychiatrists and this setting (p<0.001). Of note, these findings held after Bonferroni correction. Descriptive weighted and unweighted associations between physician characteristics and insurance acceptance among psychiatrists and nonpsychiatrists, in addition to AME comparisons for individual payers, are shown in Tables S12–S16 in the online supplement.
TABLE 3. Average marginal effects (AMEs) for any insurance acceptance across characteristics among psychiatrists and other physicians, 2007–2016a
 PsychiatristsOther physicians   
VariableAMESEAMESEDifferencez scorep
Female sex (reference: male sex)−.05.04−.02.01−.03−.76.223
Age ≥45 years (reference: <45 years).09.05−.01.01.102.25.988
Region (reference: Northeast)       
 Midwest.11.04.01.01.102.29.989
 South.03.04.00.01.03.76.775
 West.02.05−.04.01.061.24.893
MSA (reference: non-MSA)−.20.04−.02.01−.18−4.99<.001
IMG (reference: U.S. medical school).11.03.01.01.102.99.999
Solo practice (reference: group practice)−.20.03−.01.01−.19−6.13<.001
a
z tests were used to assess statistical significance of differences in AMEs between psychiatrists and nonpsychiatrists. To account for multiple comparisons, a Bonferroni correction was applied, which reduced the familywide error rate of 0.05 to 0.009 for individual tests. IMG, international medical school graduate; MSA, metropolitan statistical area.

Discussion

To our knowledge, this study is among the first to use variables available only in the restricted version of the NAMCS in order to analyze physicians’ acceptance of insurance. Our findings build on those of previous studies that used the public version of the NAMCS to address similar questions. This study is the first to report broad insurance acceptance trends for psychiatrist and nonpsychiatrist physicians between 2007 and 2016. The percentages among nonpsychiatrists who accepted all sources of payment were higher than among psychiatrists. The gap in insurance acceptance between nonpsychiatrists and psychiatrists was wider for public than for private insurance. Among psychiatrists, those practicing in MSAs and those with solo practices were significantly less likely to accept private, public, or any insurance. These same trends were observed among nonpsychiatrists, although to a lesser extent.
Our finding that psychiatrists accepted insurance at rates notably lower than the rates among nonpsychiatrist physicians corroborates findings from previous studies, which found that psychiatrists’ insurance acceptance rates were lower for Medicare, Medicaid, and noncapitated private insurance between 2005 and 2010 (3) and that self-pay was disproportionately represented in psychiatric relative to nonpsychiatric outpatient visits (12). In our time-trend analyses, we found that differences in insurance acceptance between psychiatrists and nonpsychiatrists, with few exceptions, were largely stable over time. Although we did not specifically evaluate Medicaid expansion, our results largely corroborate the finding from a recent study indicating that Medicaid expansion did not have a major impact on Medicaid acceptance among psychiatrists (8). However, our results also differed from those of the same study in that we did not find that the gap in Medicaid acceptance between psychiatrists and nonpsychiatrist physicians has widened significantly (although we evaluated the 2007–2016 time frame, whereas the other study evaluated the 2010–2015 period) (8). Most notably, we found that, although all physicians working in solo practices and those in MSAs were less likely to accept insurance than their counterparts in group practices and outside of MSAs, these trends were more pronounced among psychiatrists.
Much has been written about the individual and contextual factors that underpin psychiatrists’ lack of insurance acceptance and disproportionate acceptance of self-pay patients, relative to nonpsychiatrists. Hypothesized explanations include the relatively low reimbursement rates (20) for mental health services (often lower than rates for nonpsychiatrist physicians for the same service [21]), comparatively arduous administrative burden due to a lack of insurance parity enforcement (20), the shortage of psychiatrists in many U.S. areas, and the low start-up costs associated with entering and competing in the mental health delivery market.
Our findings did not directly support any of these hypotheses or propose alternative explanations, but they have provided a higher-resolution description of the phenomenon, which may improve understanding of this problem. Our finding that psychiatrists in solo practices were less likely to accept health insurance than nonpsychiatrists practicing in the same type of setting was not surprising. Mental health reimbursement rates from insurers are comparatively low, and psychiatrists working individually have little administrative support or negotiation leverage with payers. Furthermore, relatively low supply and high demand in many areas of the United States provide a favorable environment for psychiatrists, who often quickly reach patient capacity through nascent cash-only practices without accepting patients from lower-reimbursing payers like Medicare or Medicaid.
Our finding that psychiatrists practicing in MSAs were less likely than nonpsychiatrists in the same areas to accept insurance was also not surprising. Current market conditions are especially favorable for psychiatrists in urban areas. Demand has soared while supply and insurance reimbursement for behavioral health care have failed to keep pace. Outside of MSAs, market forces remain favorable for psychiatrists because of high demand and extremely low supply, although perhaps not to the same extent as in urban areas.
Of note, in analyses with psychiatrists only, we confirmed the results of a previous study that psychiatrists in the Midwest region are more likely than those in the Northeast to accept any private insurance or any insurance (3). Broadly, the psychiatrist-only analyses yielded findings similar to those comparing psychiatrists and nonpsychiatrists. For example, findings for psychiatrists in MSAs mirrored those in the analysis comparing psychiatrists and nonpsychiatrists in MSAs, indicating that practice in an MSA is one of the physician characteristics that was most consistently associated with insurance nonacceptance. Similarly, our results suggest that psychiatrists working in solo practices were substantially less likely than psychiatrists working in a group practice to accept insurance, a finding consistent with a previous study (3). Further, when coupled with the results comparing psychiatrists with nonpsychiatrists, this finding suggests that physicians in solo practices and those in MSAs are generally less likely to accept insurance, although this difference is especially pronounced for psychiatrists.
The reluctance of psychiatrists to participate in insurance networks substantially threatens mental health access, equity, and public health. Although our findings highlight this problem more clearly than have previous studies, our observations cannot directly inform an overarching strategy to mitigate the deleterious market forces that have led to the inequities and inadequacies in the contemporary U.S. mental health care delivery system. We believe that the most effective solutions to this challenge could leverage the economic concepts of competition and regulation (22). Specifically, the United States needs many additional mental health providers to increase competition, thereby reducing treatment prices and incentivizing insurance network participation. With current and projected shortages of psychiatrists, it is likely that such a supply increase would be driven by advanced practice nurses and physician assistants, especially for patients with common, low-acuity mental health problems. Indeed, this pattern has been shown in recent studies (13, 14). It is also likely that primary care providers (PCPs) will continue to see most patients with behavioral health problems. Consequently, psychiatrists should be incentivized to use evidence-based approaches such as the collaborative care model to provide adequate training, consultation, and support to PCPs taking on this burden (23).
On the regulatory side, federal and state governments should enforce parity legislation (1). Payers would be held accountable for disparities in network adequacy between behavioral and general medical health care. This step would, in turn, lead to partial mitigation of factors, such as comparatively low reimbursement rates and disproportionately arduous nonquantitative treatment limitations (e.g., prior authorizations) that drive psychiatrists away from insurance networks (1). Nevertheless, we note that psychiatrists will continue to have lower market entry costs than nonpsychiatrists and will therefore still have powerful incentives to practice individually and outside of insurance networks to maximize revenue and reduce administrative burden.
This study had several limitations. First, we had no data on why physicians did or did not choose to accept insurance. Therefore, our results were intended to characterize the extent of payment source disparities between psychiatrists and nonpsychiatrists, as opposed to explaining precisely why these disparities occur. Additionally, the sample in this investigation included only physicians and excluded those practicing in hospitals, federal medical facilities, or community health centers. That said, the physicians surveyed in the NAMCS represented those who conduct approximately 90% of outpatient encounters in the United States each year (3). Finally, the results of this study were limited by the relatively small number of psychiatrists surveyed in the NAMCS. Although our findings were weighted by using complex survey design methods to provide national estimates, the counts of psychiatrists were much lower than those for nonpsychiatrists.

Conclusions

Psychiatrists were less likely than other physicians to participate in insurance networks between 2007 and 2016, with larger differences for public than for private insurance. Among all physicians, those practicing in MSAs and those in solo practices were less likely than their counterparts to participate in insurance networks, although these trends were more pronounced among psychiatrists. In addition to general policy interventions to improve insurance network adequacy for psychiatric care across dimensions, additional measures to promote insurance network participation should be considered for psychiatrists in solo practices and in metropolitan areas.

Supplementary Material

File (appi.ps.202100669.ds001.pdf)

References

1.
Carlo AD, Barnett BS, Frank RG: Behavioral health parity efforts in the US. JAMA 2020; 324:447–448
2.
Heisler EJ: The Mental Health Workforce: A Primer. Washington, DC, Congressional Research Service, 2018. https://fas.org/sgp/crs/misc/R43255.pdf
3.
Bishop TF, Press MJ, Keyhani S, et al: Acceptance of insurance by psychiatrists and the implications for access to mental health care. JAMA Psychiatry 2014; 71:176–181
4.
Wang PS, Lane M, Olfson M, et al: Twelve-month use of mental health services in the United States: results from the National Comorbidity Survey Replication. Arch Gen Psychiatry 2005; 62:629–640
5.
Satiani A, Niedermier J, Satiani B, et al: Projected workforce of psychiatrists in the United States: a population analysis. Psychiatr Serv 2018; 69:710–713
6.
Rotenstein LS, Edwards ST, Landon BE: Adult primary care physician visits increasingly address mental health concerns. Health Aff 2023; 42:163–171
7.
Barkil-Oteo A: Collaborative care for depression in primary care: how psychiatry could “troubleshoot” current treatments and practices. Yale J Biol Med 2022; 86:139–146
8.
Wen H, Wilk AS, Druss BG, et al: Medicaid acceptance by psychiatrists before and after Medicaid expansion. JAMA Psychiatry 2019; 76:981–983
9.
Cummings JR: Rates of psychiatrists’ participation in health insurance networks. JAMA 2015; 313:190–191
10.
Blech B, West JC, Yang Z, et al: Availability of network psychiatrists among the largest health insurance carriers in Washington, DC. Psychiatr Serv 2017; 68:962–965
11.
Xu WY, Song C, Li Y, et al: Cost-sharing disparities for out-of-network care for adults with behavioral health conditions. JAMA Netw Open 2019; 2:e1914554
12.
Benjenk I, Chen J: Trends in self-payment for outpatient psychiatrist visits. JAMA Psychiatry 2020; 77:1305–1307
13.
Oh S, McDowell A, Benson NM, et al: Trends in participation in Medicare among psychiatrists and psychiatric mental health nurse practitioners, 2013–2019. JAMA Netw Open 2022; 5:e2224368
14.
Cai A, Mehrotra A, Germack HD, et al: Trends in mental health care delivery by psychiatrists and nurse practitioners in Medicare, 2011–19. Health Aff 2022; 41:1222–1230
15.
About the Ambulatory Health Care Surveys—National Ambulatory Medical Care Survey. Hyattsville, MD, National Center for Health Statistics, 2021. https://www.cdc.gov/nchs/ahcd/about_ahcd.htm. Accessed Sept 21, 2022
16.
Paul P, Pennell ML, Lemeshow S: Standardizing the power of the Hosmer-Lemeshow goodness of fit test in large data sets. Stat Med 2013; 32:67–80
17.
Fox J, Monette G: Generalized collinearity diagnostics. J Am Stat Assoc 1992; 87:178–183
18.
Mize TD, Doan L, Long JS: A general framework for comparing predictions and marginal effects across models. Sociol Methodol 2019; 49:152–189
19.
VanderWeele TJ, Mathur MB: Some desirable properties of the Bonferroni correction: is the Bonferroni correction really so bad? Am J Epidemiol 2019; 188:617–618
20.
Wilk JE, West JC, Narrow WE, et al: Access to psychiatrists in the public sector and in managed health plans. Psychiatr Serv 2005; 56:408–410
21.
Mark TL, Olesiuk W, Ali MM, et al: Differential reimbursement of psychiatric services by psychiatrists and other medical providers. Psychiatr Serv 2018; 69:281–285
22.
McGuire TG: Achieving mental health care parity might require changes in payments and competition. Health Aff 2016; 35:1029–1035
23.
Carlo AD, Barnett BS, Unützer J: Harnessing collaborative care to meet mental health demands in the era of COVID-19. JAMA Psychiatry 2021; 78:355–356

Information & Authors

Information

Published In

Go to Psychiatric Services
Psychiatric Services
Pages: 25 - 31
PubMed: 37424301

History

Received: 23 November 2021
Revision received: 1 October 2022
Revision received: 13 February 2023
Accepted: 19 April 2023
Published online: 10 July 2023
Published in print: January 01, 2024

Keywords

  1. Insurance
  2. Outpatient treatment
  3. Public policy issues
  4. Community mental health services
  5. Mental health systems

Authors

Details

Andrew D. Carlo, M.D., M.P.H. [email protected]
Meadows Mental Health Policy Institute, Dallas (Carlo); Department of Psychiatry and Behavioral Sciences (Carlo, Jordan) and Center for Health Services and Outcomes Research, Institute for Public Health and Medicine (Jordan), Northwestern University Feinberg School of Medicine, Chicago; Departments of Pharmacy, Health Services, and Economics (Basu) and Department of Psychiatry and Behavioral Sciences (Unützer), University of Washington, Seattle.
Anirban Basu, Ph.D., M.S.
Meadows Mental Health Policy Institute, Dallas (Carlo); Department of Psychiatry and Behavioral Sciences (Carlo, Jordan) and Center for Health Services and Outcomes Research, Institute for Public Health and Medicine (Jordan), Northwestern University Feinberg School of Medicine, Chicago; Departments of Pharmacy, Health Services, and Economics (Basu) and Department of Psychiatry and Behavioral Sciences (Unützer), University of Washington, Seattle.
Jürgen Unützer, M.D., M.P.H.
Meadows Mental Health Policy Institute, Dallas (Carlo); Department of Psychiatry and Behavioral Sciences (Carlo, Jordan) and Center for Health Services and Outcomes Research, Institute for Public Health and Medicine (Jordan), Northwestern University Feinberg School of Medicine, Chicago; Departments of Pharmacy, Health Services, and Economics (Basu) and Department of Psychiatry and Behavioral Sciences (Unützer), University of Washington, Seattle.
Neil Jordan, Ph.D.
Meadows Mental Health Policy Institute, Dallas (Carlo); Department of Psychiatry and Behavioral Sciences (Carlo, Jordan) and Center for Health Services and Outcomes Research, Institute for Public Health and Medicine (Jordan), Northwestern University Feinberg School of Medicine, Chicago; Departments of Pharmacy, Health Services, and Economics (Basu) and Department of Psychiatry and Behavioral Sciences (Unützer), University of Washington, Seattle.

Notes

Send correspondence to Dr. Carlo ([email protected]).
This research was presented in part at a virtual session of the American Psychiatric Association Annual Meeting, May 1–3, 2021.

Competing Interests

Dr. Carlo reports working as a consultant for Otsuka. Dr. Basu reports working as a consultant with Salutis Consulting. The other authors report no financial relationships with commercial interests.

Funding Information

This study was supported by NIMH (award 6T32 MH-073553-15 to Dr. Carlo). Funding for the restricted data used in this investigation was provided through the National Center for Health Statistics (NCHS)/Academy Health National Health Policy Fellowship Program. The authors thank the NCHS, Research Data Center, United States Census Bureau, and Academy Health for their support with this project.

Metrics & Citations

Metrics

Citations

Export Citations

If you have the appropriate software installed, you can download article citation data to the citation manager of your choice. Simply select your manager software from the list below and click Download.

For more information or tips please see 'Downloading to a citation manager' in the Help menu.

Format
Citation style
Style
Copy to clipboard

View Options

View options

PDF/EPUB

View PDF/EPUB

Login options

Already a subscriber? Access your subscription through your login credentials or your institution for full access to this article.

Personal login Institutional Login Open Athens login
Purchase Options

Purchase this article to access the full text.

PPV Articles - Psychiatric Services

PPV Articles - Psychiatric Services

Not a subscriber?

Subscribe Now / Learn More

PsychiatryOnline subscription options offer access to the DSM-5-TR® library, books, journals, CME, and patient resources. This all-in-one virtual library provides psychiatrists and mental health professionals with key resources for diagnosis, treatment, research, and professional development.

Need more help? PsychiatryOnline Customer Service may be reached by emailing [email protected] or by calling 800-368-5777 (in the U.S.) or 703-907-7322 (outside the U.S.).

Figures

Tables

Media

Share

Share

Share article link

Share