AD by MMSE-Based Severity Subgroup
We considered two possible outcomes of the comparisons of prevalence across severity groups at baseline. The first was that endorsement rates would be higher for individuals with worse cognitive status as representative of their higher impairment. This was observed for physical signs of anxiety, crying, agitation, irritability, uncooperativeness, restlessness, misidentification of things, and beliefs that TV characters are real and that people are in the house (items ;ns2, 5, 19, 20, 21, 24, 35, 40, and 41).
The other possible outcome was that endorsement rates would be lower for individuals with worse cognitive status because they would be unable to perform or exhibit the behaviors. Notably, endorsement rates on repetitiveness (item ;ns30) were significantly higher for subjects with higher MMSE scores, and endorsement rates on this item alone tended to decrease as MMSE scores decreased.
For the majority of items, however, we observed no significant differences in endorsement across MMSE- based domains for BRSD items. In fact, we do not see evidence strongly in support of either of these alternative hypotheses; we have not found evidence that cognitive status corresponds strictly to behavioral symptomatology in this analysis. Lower MMSE scores were not uniformly associated with either higher or lower endorsement rates; nor did we see BRSD items that reflect particular functional domains, such as speech or physical movement, endorsed less and less as MMSE scores dropped off. Endorsement rates for the behavioral items were, in some cases, very low across AD strata; in other cases the endorsement rates increased in parallel with decreasing MMSE (except for item ;ns30, repetitiveness), or were very low or absent for higher MMSE but relatively high for subjects with lower MMSE.
From a purely descriptive perspective, we also saw that on some items endorsement was highest for middle strata (hopelessness, feels life is not worth living, social withdrawal; items ;ns4, 8, and 31) or that it was lowest for middle strata and highest for lowest/highest MMSE scores (sad appearance, excessive physical complaints, sudden changes in emotion, visual hallucinations; items ;ns3, 16, 18, and 45). However,
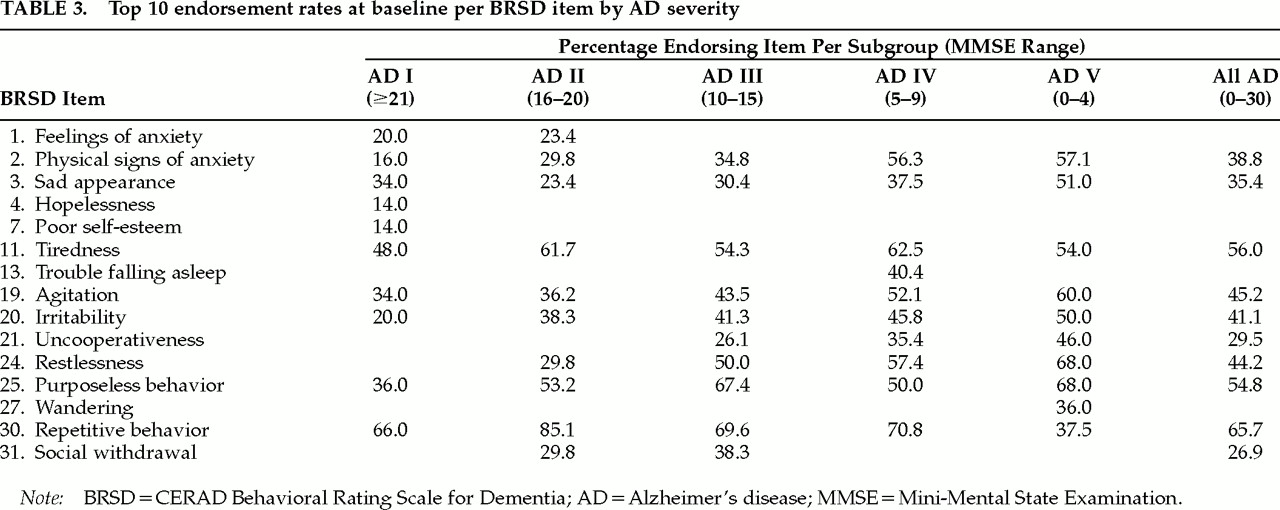
Table 3 shows that the most frequently endorsed items tend to be relatively homogeneous across the AD levels. This implies that there may be a core set of behaviors that are likely to be observed over the course of AD (physical signs of anxiety, sad appearance, tiredness, agitation, irritability, uncooperativeness, restlessness, purposeless behavior, and repetitive behavior; items ;ns2, 3, 11, 19, 20, 21, 24, 25, and 30).
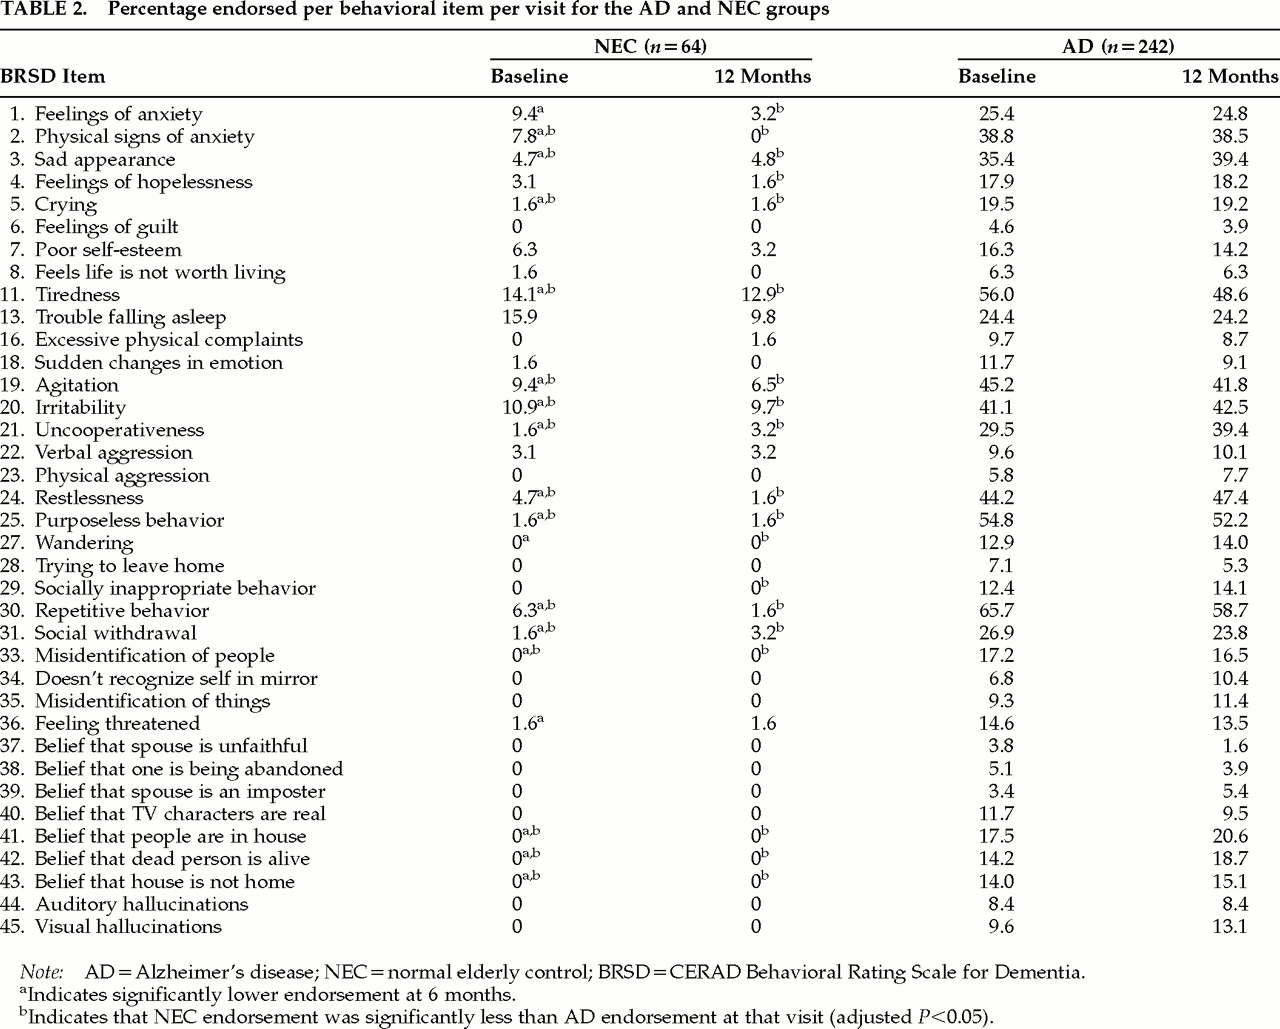
The majority of these nine symptoms appear to be more prevalent as dementia severity increases cross-sectionally; we saw, however, that over 12 months endorsement rates were essentially stable over all subjects (see
Table 2), although there was some decrease for tiredness (item ;ns11), and some increase in uncooperativeness (item ;ns21).
Although there is analytic support for BRSD subscores,
4,7 this set of nine behaviors includes at least one symptom each from the Depression, Behavioral Dysregulation, Inertia, and Irritability/Aggression domains, as well as two symptoms (sad appearance and repetitiveness, items ;ns3 and 30) not in any subscore. Analysis of all BRSD items, rather than total or subscores, may therefore be important to fully describe behavioral disturbance in persons with AD in both research and clinical applications.
Mack et al.
7 describe a “short form” of the BRSD that includes items ;ns3, 4, 8, 19, 20, 22, 24, 25, 27, 30, 41, 43, and 45 (see
Table 2), plus four other BRSD items not analyzed here (items ;ns9, 10, 12, and 14: loss of enjoyment, loss of initiative, change in sleep pattern, change in appetite). The short form comprises the 16 BRSD items that met one or more of the following criteria: high loading on a BRSD subscale factor; high average frequency; high proportion of ratings of 1–4; high number of ratings of 3 or 4 (high frequency); or high correlation with MMSE.
7 The subset of items derived from
Table 3 and the BRSD short-form subset have considerable overlap (items ;ns3, 19, 20, 24, 25, and 30; sad appearance, agitation, irritability, restlessness, purposeless behavior, repetitive behavior). Given the different criteria for the establishment of these two BRSD subsets, their similarity supports the possibility that there may be a core set of behavioral symptoms in AD.
General Discussion
One of the purposes of this analysis was to determine if normal elderly control subjects endorsed any of the items on the BRSD, and if so, whether or not these endorsement rates were uniformly and significantly lower than those for AD. We defined endorsement as frequency of at least 3 days in the past month. We found 3 of 37 items with endorsement rates for NEC near or above 10% (tiredness, sleep problems, easily irritated); 14/37 items were endorsed for 3% to 15% of NEC at some point over our study (see
Table 2). Mega et al.
6 reported a 12.5% prevalence rate for any one (or two, in one case) of 10 possible noncognitive behaviors in their normal group. Although the least frequent rating allowed by Mega et al. (less than once per week) was classified as “absent” in the present study, our reported prevalence rates for NEC are similar.
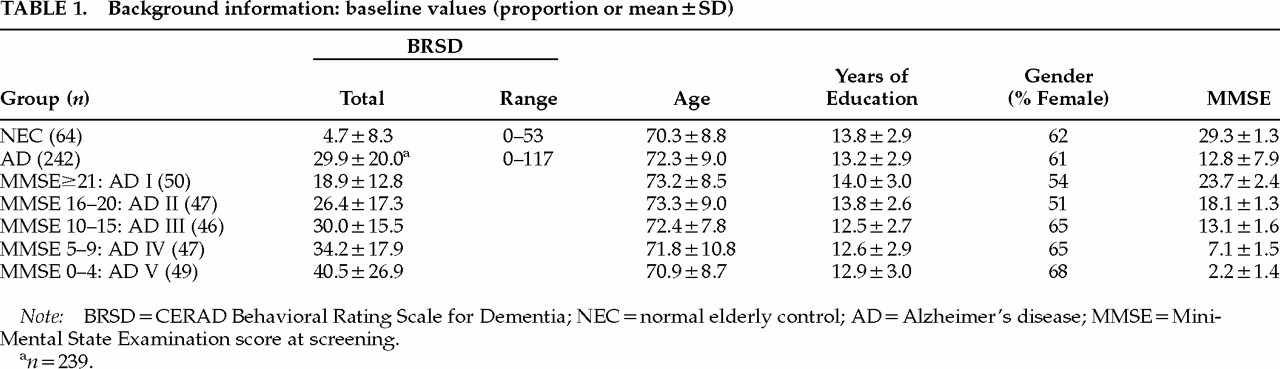
If, in the present study, the endorsement rates for NEC had been all zero, then a “normal” total weighted score on the BRSD could have been taken as zero. However, the range of scores for NEC was at its widest (0– 53 out of a possible 167) at baseline, and at its narrowest (0–34) at 6 months (maximum at 12 months was 37). Although both the mean and the maximum BRSD total scores for the NEC were considerably smaller than those of the AD patients, there was some overlap (see
Table 1). The implication is that AD patients with total weighted BRSD scores at or below about 50 may, in fact, be “normal” in terms of their behavioral symptomatology. Therefore, it may not be appropriate to label AD patients “behaviorally disturbed” if their total BRSD scores fall within the range demonstrated by these NEC. Further, in clinical trials where the objective is to normalize a patient’s total BRSD score, BRSD scores upon enrollment would need to be outside of the range observed for the normal elderly control subjects here. Endpoints would then be scores within this normal range, rather than at zero—which could have implications for power calculations.
An alternative approach is to define the limit of the “normal” range as the upper bound on the 95% confidence interval for the mean of the baseline total score (6.77, corresponding to 7 points, based on the NEC data presented here). This establishes a “normal” range as scores from 0 to 7, which will include the mean NEC BRSD total score 95% of the time—even though this approach does not address the actual distribution of the scores of normal subjects, namely, that they can reach upwards of 50 points.
Prevalence rates for NEC on any of the 37 items reported here would also represent “normal limits.” Similarly, changes over time or during a study that leave the item and total scores within the ranges observed for NEC would be characterized as “normal fluctuation” and would not be attributed to treatment effects or even disease progression.
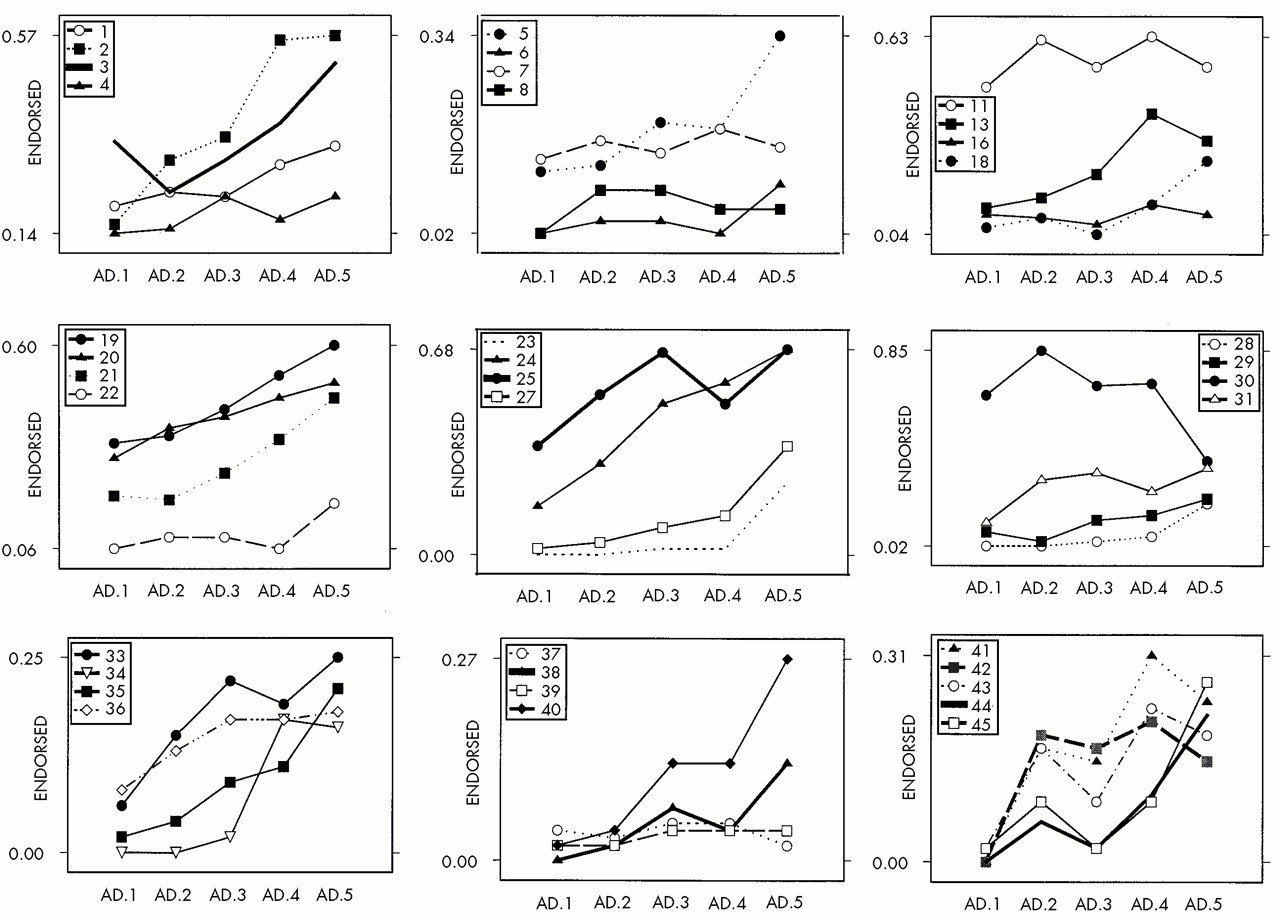
There were several symptoms (restlessness, purposeless activity, repetitiveness; items ;ns24, 25, and 30) where NEC endorsement was extremely low while AD endorsement was upwards of 40%; these were three of the six items with the highest AD endorsement rates. These items may be particularly informative with respect to differentiating AD and NEC; the plots in
Figure 1 suggest the need for closer study of the relationship between the responses to these items and MMSE score or the course of AD.
Although these three symptoms were among the most prevalent in this AD patient sample, ranging in endorsement rates from 44.2% to 65.7% (
Table 3), they were present only in about 38% of the AD sample reported by Mega et al.
6 We also found slightly lower baseline prevalence rates than did Mega and colleagues for hallucinations (8.4%–9.6% vs. 10% in their sample) and delusions (3.8%–17.5% vs. 22% in their sample). However, the BRSD provides separate ratings for different kinds of hallucination and delusion; if instead there were only one item apiece, “any hallucination” or “any delusion,” our prevalence rates might be higher than the individual item–based rates we observed.
The difference in reported prevalence rates across the Mega et al. study and the present one may also be due, at least in part, to the makeup of our respective subject groups: whereas the Mega et al.
6 sample focused on consecutive outpatients visiting a single clinic for assessment of dementia, our sample included nearly five times as many subjects who were enrolled in a multisite clinical study.
A second purpose of this study was to use an item- level approach to investigate the relationship between cognitive functioning and behavioral symptomatology in community-dwelling AD patients. We found that physical signs of anxiety, restlessness, misidentification of things, and thinking people on TV are present (items ;ns2, 24, 35, and 40) had fairly linear relationships with MMSE (
Figure 1). However, many symptoms, such as hopelessness, feeling life isn’t worth living, physical complaints, and delusions that one’s spouse is unfaithful or an imposter (items ;ns4, 8, 16, 37, and 39) did not appear to be associated with MMSE.
We plan to follow up this analysis by focusing on the subset of BRSD items that is maximally descriptive of the total BRSD score, with the best power to discriminate AD patients from NEC. In its current form, the BRSD includes a complex set of behavioral symptoms, and we have attempted to establish “normal limits” for both the set (total score) and the component items. Item-level analyses of the BRSD may be an important source of information; prevalence rates of these items, as well as change over time, in normal elders must be taken into account in long-term studies of behavioral symptoms in AD.