However, the diagnosis of burnout as a description of the final stage of the process of getting burned-out is still a difficult one. The major reason is that there are no—or at least few—objective positive neurobiological markers for burnout syndrome. Moreover, DSM-IV
3 does not provide for the diagnosis of burnout. Instead and only based on one major symptom of burnout, namely the prolonged and medically unexplained fatigue, burnout patients are to be diagnosed as suffering from unspecified somatoform disorder. The ICD-10
4 includes burnout as a separate diagnosis but provides no diagnostic criteria. Despite the lack of criteria for burnout in the field of psychiatry, researchers and clinicians over the previous 40 years have proposed that burnout syndrome can be described as an exhaustion syndrome accompanied by affective symptoms such as general feeling of malaise, irritability, cynicism and depersonalization; especially emotional exhaustion has been frequently mentioned in the burnout literature.
5 –
7 High scores on exhaustion and depersonalization and a low score on personal accomplishment on the Maslach Burnout Inventory
8 became generally accepted to be an indication for burnout. Most definitions of burnout share five common elements. First, there is a predominance of fatigue symptoms such as mental or emotional exhaustion, tiredness, and depression. Second, various atypical physical symptoms of distress may occur. Third, these symptoms are work-related. Fourth, the symptoms manifest themselves in “normal” persons who did not suffer from psychopathology before. And finally, decreased effectiveness and impaired work performance occurs because of negative attitudes and behaviors.
6When used in the context of a disorder, burnout shows some overlap with major depressive episode (with atypical features) and with chronic fatigue syndrome. It has to be acknowledged that atypical depression and chronic fatigue are difficult to distinguish from burnout syndrome,
9 and finding electrophysiological differences that characterize burnout patients might help to establish whether burnout is identical to major depressive episodes, chronic fatigue syndrome, or a separate or even unique syndrome and, if so, in the validity of the concept of burnout syndrome.
We investigated brain functioning in burnout patients in an explorative study by analyzing the EEG and neuropsychological performance considering the mentioned similarities of burnout with atypical depression and chronic fatigue syndrome. More specifically, we were wondering whether we can find differences with depression-like or chronic fatigue syndrome-like changes in the EEG of burnout patients. Therefore, the following four EEG-based hypotheses were explored. Both frontal asymmetry and reduced amplitude of the P300 have been associated with depression.
10 –
14 We investigated whether burnout patients show frontal asymmetry and reduced amplitude of the P300. The third measure is alpha peak frequency. Alpha peak frequency is the frequency within the alpha range with the largest power. Alpha peak frequency is reduced in chronic fatigue syndrome patients and correlates negatively with subjective ratings of fatigue.
15 We therefore investigated whether alpha peak frequency is reduced in burnout patients similar to chronic fatigue syndrome patients. The last paradigm, a comparison of alpha and beta power with eyes open and closed, yields a global picture of possible compromised brain functioning in burnout patients.
MATERIALS AND METHODS
Participants
Thirteen patients diagnosed with burnout syndrome (mean age=48.2, range=26–55) and 13 comparison subjects participated in the study and were assessed at the laboratory of Brainclinics Diagnostics in Nijmegen. Matched comparison subjects were recruited through advertisements in local newspapers. Exclusion criteria for comparison subjects and patients were the use of psychoactive medication, excessive drug or alcohol use, schizophrenia in first grade family members, and other psychological, psychiatric, or neurological complaints.
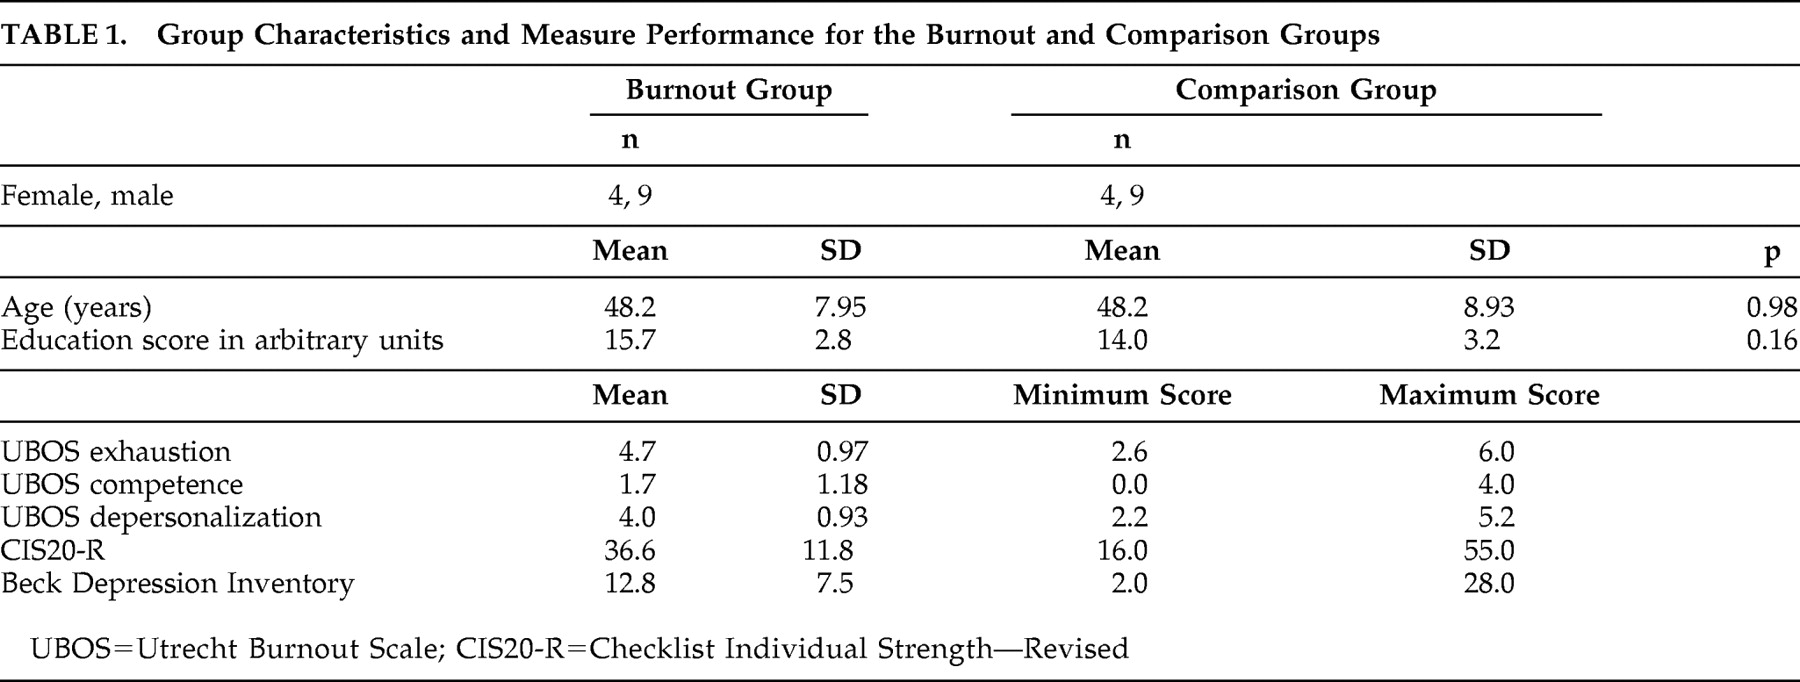
Table 1 shows the group characteristics of the burnout and the comparison group. Recruitment of burnout patients took place at the HSK-group, an outpatient treatment center specializing in the diagnosis and treatment of burnout syndrome. The following instruments were administered during intake of the burnout patients. The Dutch adaptation
16 of the Anxiety Disorder Interview Schedule (ADIS-NL)
17 is a semistructured interview for the classification of affective disorders according to DSM-IV. The section on somatoform disorders of the Structured Clinical Interview for DSM-IV (SCID-D) was added since undifferentiated somatoform disorder is not included in the ADIS-NL. The SCID is a semistructured interview for the classification of all axis I disorders of DSM-IV.
18 A positive classification of undifferentiated somatoform disorder was deemed necessary in order to be included as burnout. The Dutch version
16 of Beck’s Depression Inventory (BDI) consists of 21 items ranging from 0 (absence of symptoms) to 3 (severe symptoms). Total scores range from 0 to 63. The Dutch version of the Checklist Individual Strength—Revised (CIS20-R)
19 consists of 20 items regarding subjective feeling of fatigue and physical fitness, activity level, motivation, and concentration over the previous 14 days. The items are scored on a 7-point Likert scale. High total scores indicate high levels of fatigue symptoms. The Dutch version of the Maslach Burnout Inventory General Survey, called the Utrecht Burnout Scale (UBOS),
20 consists of 16 items, comprising three subscales, exhaustion, depersonalization, and reduced professional competence, which are scored on a 7-point Likert scale ranging from 1 (never) to 7 (always). High scores indicate a high level of burnout symptoms. The questionnaires are well validated Dutch versions that have shown reasonable to good reliability.
The following criteria had to be met in order to be included in the burnout group: a positive diagnosis of undifferentiated somatoform disorder according to the SCID-I including the criterion that the symptoms (medically unexplained fatigue) are present for at least 6 months; high scores on the subscales emotional exhaustion (mean score >2.21) and depersonalization (mean score >2.21) and low scores on the competence subscale (mean score <3.50) of the UBOS as proposed by Brenninkmeijer et al.
21 to identify patients suffering from clinical burnout; interviewer and patient had to view the symptoms as clearly work-related; due to the symptoms, the subject worked 50% or less of his or her usual working hours for at least 3 months. Criterion 3 and 4 were established and noted down during intake. The scores of the subjects of the burnout group on the UBOS, BDI, and CIS20-R are presented in
Table 1 .
All subjects gave written informed consent before entering the study. Medical ethical approval was obtained (Commissie Mensgebonden Onderzoek nr. 2002/009). Subjects were required to refrain from caffeine, alcohol, and smoking for at least 2 hours prior to electrophysiological and neuropsychological testing.
Electroencephalographic Data Acquisition
Participants were seated in a sound and light attenuated room, controlled at an ambient temperature of 22°C. EEG data were acquired from 26 channels: Fp1, Fp2, F7, F3, Fz, F4, F8, FC3, FCz, FC4, T3, C3, Cz, C4, T4, CP3, CPz, CP4, T5, P3, Pz, P4, T6, O1, Oz and O2 (Quikcap; NuAmps; 10–20 electrode International System). Data were referenced to linked mastoids (offline). Horizontal eye-movements were recorded with electrodes placed 1.5 cm lateral to the outer canthus of each eye. Vertical eye movements were recorded with electrodes placed 3 mm above the middle of the left eyebrow and 1.5 cm below the middle of the left bottom eyelid. Skin resistance was <5 KOhm and >1 KOhm for all electrodes. A continuous acquisition system was employed and EEG data were EOG corrected offline.
22 The sample rate of all channels was 500 Hz. A low-pass filter with attenuation of 40 dB per decade above 100 Hz was employed prior to digitization.
The EEG data were recorded for 2 minutes during eyes open and eyes closed conditions. Subjects were asked to sit quietly either with eyes open and fixed on a red dot presented on a computer screen or, in eyes closed condition, with eyes closed.
The P300 was recorded in the oddball task: subjects were presented with a series of high and low tones, at 75 dB and lasting for 50 ms, with an interstimulus interval of 1 second. Rise and fall times of the tones were 5 ms. Subjects were instructed to press a button with the index finger of each hand in response to “target” tones (presented at 1,000 Hz). They were asked not to respond to “background”’ tones (presented at 500 Hz). Speed and accuracy of response were equally stressed in the task instructions. The background and target tones were presented in a quasi-random order, with the only constraint being that two targets cannot appear consecutively. Probability of the target stimulus was 15%. The duration of the auditory oddball task was approximately 6 minutes. Conventional event-related potential (ERP) averages were calculated at each recording site. The peaks (amplitude and latency) of the P300 for the target waveforms of the ERP component were identified (relative to a prestimulus baseline average of −300 to 0 msec) at each of the 26 sites. Data from this paradigm were used to describe the P300 amplitude and latency and test whether there would be a difference between the two groups.
Neuropsychological Data Acquisition
Participants were seated in a sound and light attenuated room, controlled at an ambient temperature of 22°C, behind a touch screen monitor and were assessed on neuropsychological measures of attention, memory and executive function. More specifically, visual span of attention, digit span (forward and reverse), word interference test (equivalent to the Stroop test), switching of attention test part A and B (equivalent to the WAIS Trails A and B), working memory test and the behavioral outcomes of the oddball task were used as a measure of sustained attention.
23,
24 All tests were fully computerized and subjects’ responses were recorded via touch-screen presses.
Electroencephalographic Variables
After EOG correction, average power spectra were computed for each condition (eyes open, eyes closed). The 2-minute epochs were divided into intervals of 4 seconds. Power spectral analysis was performed on each interval by first applying a Welch window to the data, followed by a Fast Fourier Transform (FFT). Next, an averaged power spectrogram was made. The power was calculated in four frequency bands for eyes open and closed: delta (1.5–3.5 Hz), theta (4–7.5 Hz), alpha (8–13 Hz), and beta (14.5–30 Hz). The data were transformed in order to fulfill the normal distributional assumption required for parametric statistical analysis, as was previously done.
25,
26 Conventional grand average ERP was determined from the recordings from the oddball task. The amplitude and latency of the P300 ERP component elicited by the target were identified (relative to a prestimulus baseline average of −300 to 0 msec) at each site.
Neuropsychological Variables
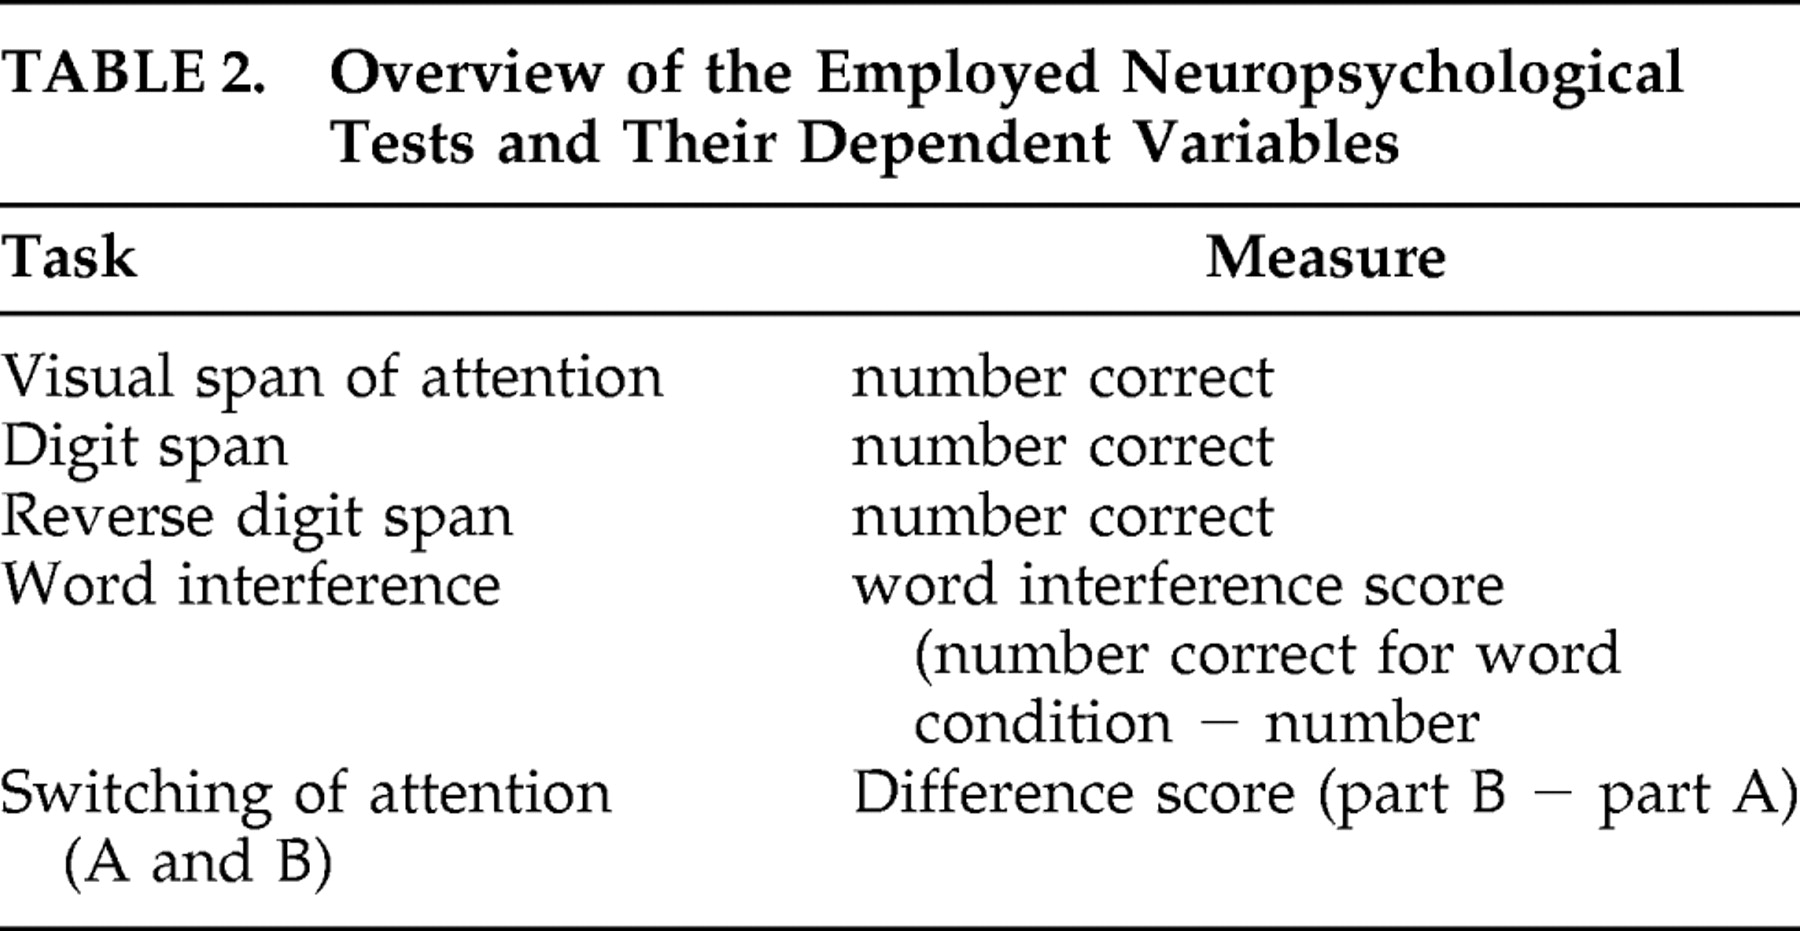
The neuropsychological variables as measured by each test are presented in
Table 2 . The results for the different measures were clustered in the following manner: memory span was defined as the number correct for digit span (forward and reverse) and visual span of attention; reaction time was defined as the average reaction time from working memory and oddball task; attention was defined as the interference score in word interference test and difference score for switching of attention part B–part A.
Statistical Analysis
Differences between groups in age and education were tested using a t test for independent groups; gender differences were tested using the Kruskal-Wallis nonparametric statistic.
The EEG and ERP data from the scalp electrodes were categorized (except for establishing frontal asymmetry) into six functional regions in order to reduce the chance of a type II error): left frontal=Fp1, F7, F3, Fc3; right frontal=Fp2, F8, F4, Fc4; midline=Fz, Fcz, Cz, Cpz, Pz; left parietal=T3, T5, C3, Cp3, P3; right parietal=T4, T6, C4, Cp4, P4; and occipital=O1, Oz, O2. Frontal asymmetry was assessed by the difference scores of F3−F4, F7−F8, and Fc3−Fc4.
A repeated measures ANOVA was used with asymmetry score as a dependant variable, electrode location as “within-subject” factor with three levels (F3−F4, F7−F8 and Fc3−Fc4), condition as “within-subject” factor with two levels (eyes open, eyes closed) and group (burnout, comparison) as “between-subject” factor. Alpha peak frequency, alpha peak power, beta power, amplitude and latency of the P300 were also analyzed with this three-way ANOVA, but now the factor electrode location had six levels.
Multivariate analysis of variance (MANOVA) (Pillai’s trace) was used to test for group differences in scores on the different neuropsychological domains with group as “between-subject” factor and neuropsychological domain as “within-subject” factor. Univariate ANOVAs were then used to test differences between groups on individual tests.
DISCUSSION
The most important outcome of this study is that this sample of burnout patients diagnosed according to strict criteria, who could not be diagnosed as depressed and whose symptoms were clearly work-related and therefore the diagnosis of chronic fatigue was less likely, show clear differences in EEG derived parameters as compared to a matched healthy comparison group. Furthermore, in contrast to what burnout patients subjectively report, no differences in neuropsychological function could be found on standard measures such as memory span, attention and reaction times. It can be acknowledged that some studies report impaired attention in burnout patients as measured with a short sustained attention to response or auditory and visual continuous performance task,
27,
28 but not in a 75-minute sustained attention vigilance type of task (Keijsers et al., unpublished manuscript). It is important to look for those aspects of attention that are disturbed in burnout patients and to find the most sensitive dependent variable in paradigms that measure different aspects of attention.
This is the first study in which EEG related findings are described in burnout patients, and this might contribute to an ascertained description of the burnout syndrome. Although the number of participants was small and a replication with more subjects is needed, the outcomes might, if replicated, contribute to the differential diagnosis of burnout, depression, and chronic fatigue syndrome since burnout patients showed differences in brain activity as compared to depressive patients based on findings in the literature. Finally, the outcomes might contribute to the validation of the concept of burnout. It needs to be emphasized that we used rather strict inclusion and exclusion criteria; therefore, our sample is rather selective. However, in this sample EEG derived EEG changes were found.
As mentioned, it is difficult to distinguish burnout from (atypical) depression and chronic fatigue syndrome; therefore, we used findings of EEG research with depressed patients and patients with chronic fatigue syndrome as a starting point for analyzing the EEG of burnout patients. Three possible abnormalities in the EEG, known from research with patients with depression or chronic fatigue syndrome, have been proposed: frontal asymmetry, known to exist in depressed patients; decreased P300 amplitude, also commonly found in patients with depression; and a lowered alpha peak frequency, found to correlate with experienced fatigue severity. The major outcome is that there were indeed quantitative differences in EEG-derived parameters even with a relatively small sample size.
The first hypothesis, that burnout patients have relative left-frontal inactivation as compared with healthy comparison subjects, was rejected. No asymmetry was found to exist in the electroencephalographic activity of our sample of burnout patients, in contrast to what has been found in depressive patients.
29 Relative left-frontal inactivation is associated with depressive symptomatology.
30 However, the absence of frontal asymmetry may contribute to the differential diagnosis of burnout and depression. This is in agreement with conclusions from reviews that suggest that burnout is similar yet not identical to depression.
21,
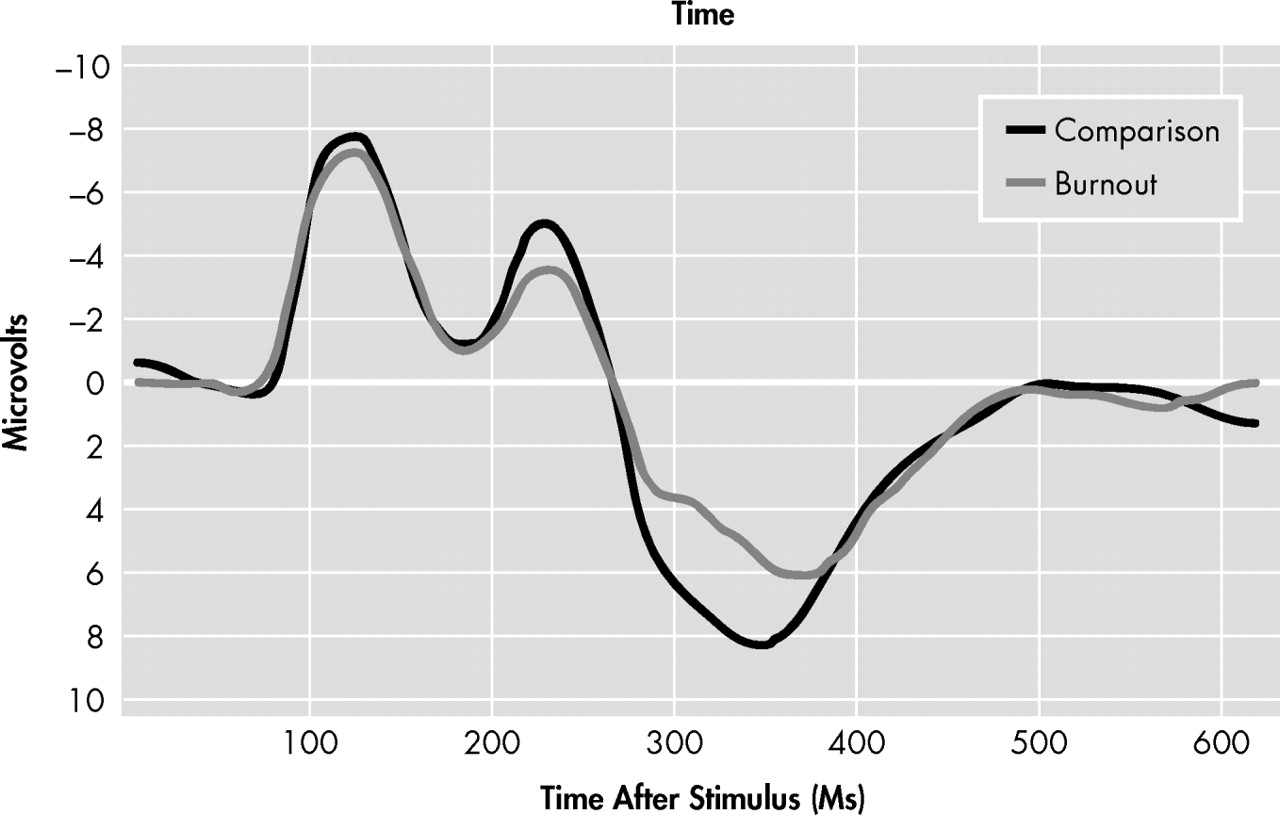
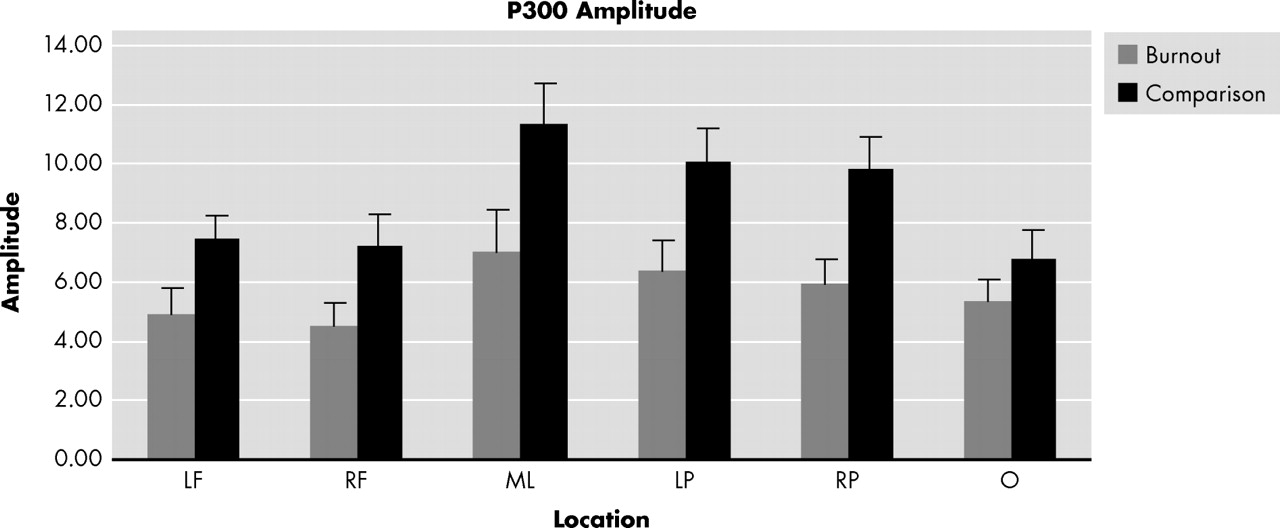
31The second hypothesis concerned the P300. The decreased P300 amplitude, as found here in burnout patients, is related to cognitive impairment and has been shown to exist in a wide variety of psychopathologies, especially depression.
30 One study argues that the probable neural generators of the P300 are mostly cortical (mesial temporal area, superior temporal area, and inferior parietal area), but they might also be located in the hippocampus and the amygdala.
32 As burnout seems to emerge after a period of prolonged stress, which is associated with hippocampal dysfunction, the flattened P300 amplitude might be a result of changes in hippocampal function, in which chronic elevation of the activity of the HPA axis might be involved.
33Many studies have shown decreased P300 amplitudes in depressed individuals as compared with healthy comparison subjects.
11,
12,
30 Although the majority of studies examining P300 characteristics in depressed patients show reduced P300 amplitudes, some do not,
34 and some also find prolonged latencies.
35 Houston et al.
36 argue that these differences are probably largely due to heterogeneity of the disorder itself and the samples examined. Interestingly, several studies investigated P300 alterations in chronic fatigue syndrome patients, but P300 amplitude and latency were found to be normal in all of these studies.
37 –
39The P300 component of the ERP is elicited after unexpected, task relevant stimuli requiring a motor response or cognitive decision. The P300 is commonly associated with memory updating and attention allocation.
40,
41 The decreased P300 amplitude could also be seen as a contributing factor to or as an objective physiological confirmation of attention and memory problems in burnout patients.
9 However, from our neuropsychological findings no differences were found on measures such as attention, memory-span and reaction times.
The ERP of the burnout group showed the existence of a P300A and a P300B. The P300A is associated with frontal activation and can be seen as a “novelty potential.”
42 Others consider the P300A to reflect the orientation to the stimulus evaluation, whereas the P300B reflects response-related processes.
43 The presence of both P300A and P300B only in burnout patients suggests a qualitative difference in both components in comparison with the comparison subjects. The existence of the P300A and P300B might indicate that the burnout group is still processing the stimuli as being “novel” whereas the comparison group is not. This indicates that the burnout group is still processing the stimuli in a controlled rather then automated manner.
44 However, more research is needed, not only to confirm our data, but to extend them and to investigate whether burnout patients differ from comparison subjects in automated or in controlled tasks.
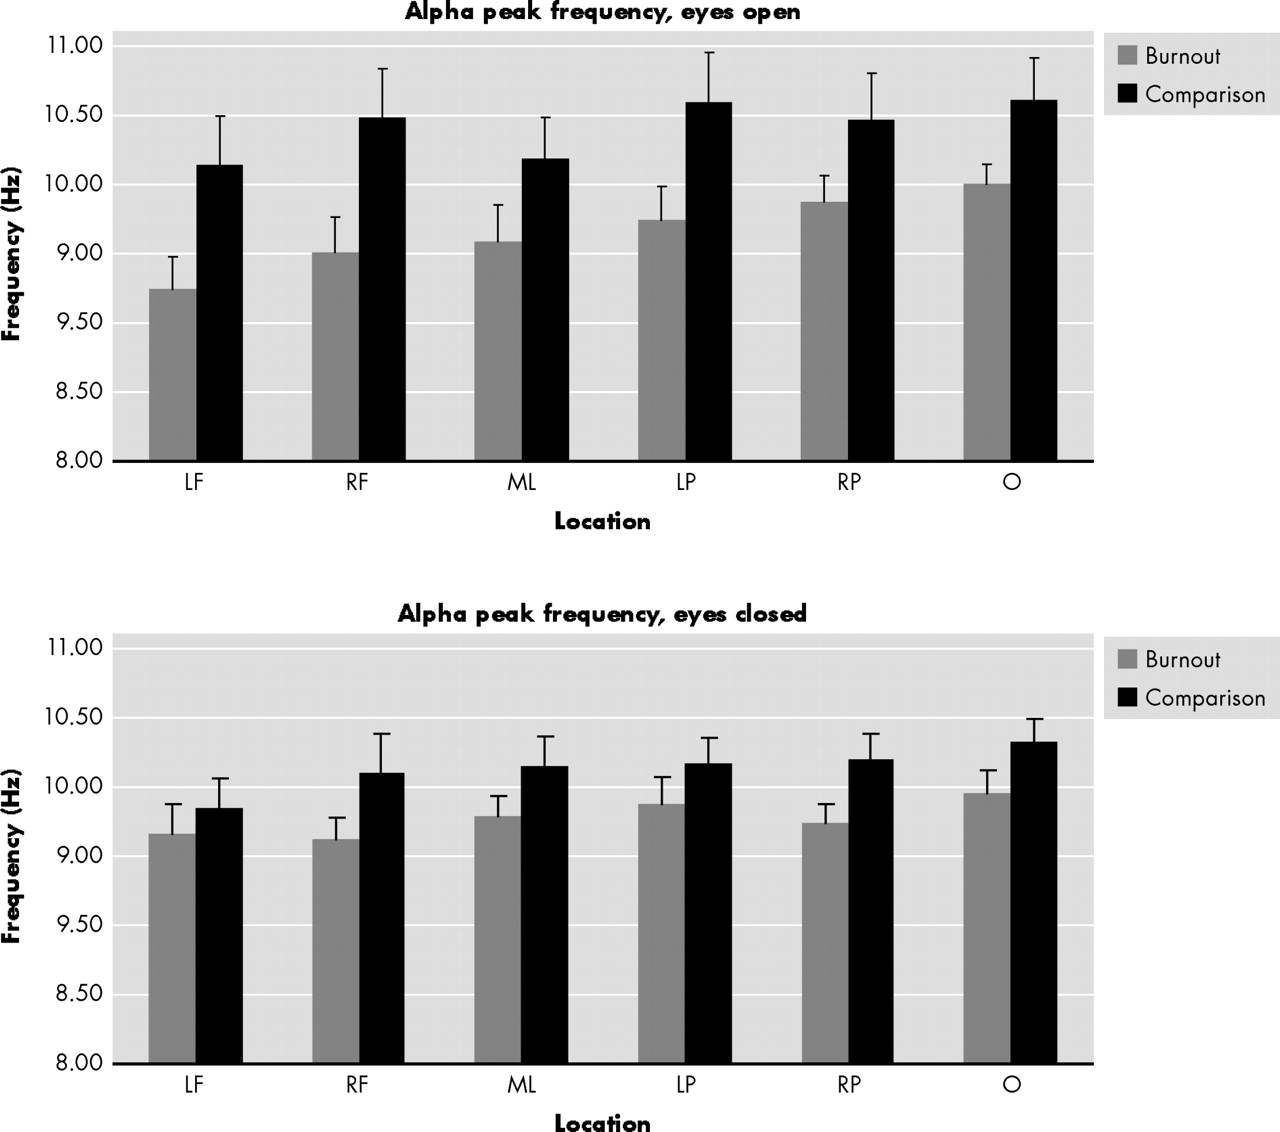
The third hypothesis was that burnout patients exhibit a lower alpha peak frequency. This study confirmed that burnout patients indeed have a lower alpha peak frequency and they share this characteristic with chronic fatigue patients. Moreover, alpha peak frequency correlates negatively with the subjective ratings of “fatigue today” and “total fatigue.”
15 The alpha peak frequency has consistently been shown to be associated with reduced cerebral blood flow and reduced brain oxygenation.
45 The alpha peak frequency has also been proposed as an index of “cognitive preparedness”
46 since a decrease in the alpha peak frequency is related to decreased performance on memory tasks.
47 Interestingly, the fatigue as reported during daytime and the mild cognitive changes in CSF patients might be explained by a poor basic sleep drive.
48The last finding, a decrease in beta power, was present at all derivations, during eyes open as well as during eyes closed, suggesting that it was a robust phenomenon. The lower power of beta and even more of the alpha band during the eyes open condition is a classical observation in EEG studies. The interpretation of the reduced power in the beta band in burnout patients is more difficult. Some studies in mild to severe stages of cognitive deterioration have shown decreases in alpha and beta frequencies and reductions in alpha peak frequency, but these changes were accompanied by marked increase in delta activity. The latter were not found here. Higher EEG frequencies (beta and gamma) have been associated with increased perfusion in the underlying cortex.
49 Given the fact that beta rhythms are mainly cortical, the decrease in beta power may suggest an overall decreased cortical perfusion. The nature of this finding requires further investigation.
To summarize, burnout patients showed clear EEG abnormalities which did not match biomarkers for either depression or chronic fatigue syndrome but rather seem to be a combination. Based on this EEG-based evidence obtained in a relatively small group of well defined patients, it might be possible in the future to consider burnout as a separate diagnostic entity with a unique combination of EEG related changes. Our EEG data give a first objective biological indication for this view. It is of interest that a biological treatment (bright light) was recently successfully administered to a group of burnout patients.
50 The decreased amplitude of the P300, the existence of a P300A and P300B in the absence of clear cognitive deficiencies as measured in the neuropsychological part of our assessment and the changes in specific frequency bands merit further studies toward biological markers for burnout.
