Employment has become a central goal of mental health treatment for people with serious mental illnesses (
1,
2 ). Attention focuses on competitive employment for several reasons. First, competitive employment resonates with personal accounts and many definitions of recovery (
3,
4,
5,
6 ). Second, competitive employment not only improves an individual's income, but it also enhances self-esteem and quality of life (
7 ). Third, a specific vocational intervention—supported employment—has been demonstrated over the past 20 years to be an evidence-based practice for persons with serious mental illnesses. Methodologically rigorous studies show that supported employment is nearly three times as effective as other interventions for helping persons with psychiatric disabilities to achieve competitive employment, increase the number of hours worked, and accomplish other vocational outcomes (
8,
9,
10,
11,
12 ). Fourth, follow-up studies show that participants in supported employment tend to maintain or increase employment outcomes over four to 12 years, despite findings that participants relied on vocational services less over time (
13,
14,
15,
16,
17,
18 ). One-third to three-quarters of the participants in supported employment became steady workers over these longer intervals (
13,
17 ).
Although Social Security Administration disability programs—Supplemental Security Income and Social Security Disability Insurance—clearly save money when beneficiaries return to work, the long-term impact of employment on mental health costs has not been clear, partly because most studies follow people only for one or two years while they are in and out of initial jobs and learning to become steady workers (
19 ). Nevertheless, the long-term impact on mental health costs is the critical issue of concern for mental health authorities in government and managed care, because they must anticipate downstream costs for planning purposes (
20,
21,
22 ).
The aim of this study was to examine the temporal pattern of service use and costs among clients participating in the New Hampshire Dual Diagnosis Study (
23 ). Because these participants had co-occurring substance use disorder and serious mental illness, they were heavy service users at baseline. They were identified by their interest in co-occurring disorders services rather than in employment services. However, many were exposed to supported employment during the ten years of follow-up, because New Hampshire implemented this service widely during the 1990s (
24 ). From a previous analysis, we were aware that competitive employment increased steadily over the ten years of the study (
23 ). In this article, we describe patterns of employment, outpatient and institutional (hospital, jail, or prison) service use, and mental health costs in relation to competitive employment.
Methods
Study sample
From seven New Hampshire mental health catchment areas, we admitted to the study 223 participants who met the following criteria: long-term psychotic illness (schizophrenia, schizoaffective disorder, or bipolar disorder), active substance use disorder within the past six months, and absence of mental retardation. After complete description of the study, participants gave written informed consent. The study was approved and monitored by the Dartmouth and New Hampshire Division of Behavioral Health institutional review boards.
The original participants were predominantly male (N=165, 74%), young (average age was 34 years), and unmarried (N=198, 89%). A total of 214 (96%) were Caucasian, five (2%) were black, and four (2%) were of other races. According to DSM-III-R criteria, 119 (53%) had schizophrenia, 50 (22%) had schizoaffective disorder, and 54 (24%) had bipolar disorder. All were diagnosed as having co-occurring substance use disorders: 167 (75%) with alcohol use disorder and 91 (41%) with at least one drug use disorder.
A number of participants were observed intermittently over the ten years of follow-up. For this study we established an inclusion criterion based on the rate of data missing for the primary variable, hours worked in competitive jobs. Because the first step in analysis involved classifying each participant into a latent group based on hours worked in each of the ten years of follow-up, we included only those who had at least five annual data points over ten years, yielding 187 participants for analysis.
Measures
To identify latent trajectory groups, we examined hours in competitive jobs for each year from baseline to year 10 of follow-up, except for year 4 because we had no data for that year. Competitive jobs included any paid position in the regular job market. For each job, participants indicated the number of weeks since the previous interview that they worked and the average number of hours that they worked weekly. We added the results for all jobs to yield total hours worked.
Providers of outpatient mental health services identified by participants provided service utilization data from billing and administrative reporting data in their management information systems. We summed direct service hours, including therapy, medication checks, day treatment, case management, and mental illness management services, for the baseline and follow-up years. Participants reported days spent in psychiatric hospitals and jails using the residential timeline follow-back calendar (
25 ).
We combined outpatient service hours and institutional days into a single measure by estimating the cost of each. For institutional days, we included incarceration in jails or prisons along with hospitalization, because we assumed that incarceration was often substituted for hospitalization during this time. The study spanned 1989 to 2001, but we calculated each year's cost using more recent unit costs. This represented the pattern and cost of services at current rates using more easily verifiable cost data. This is equivalent to a cost analysis based on present discounted value if the rate of increase of future costs equals the discount rate. With one exception, we used fiscal year 2007 (July 2006 to June 2007) cost data. For outpatient services, we averaged unit costs from two centers in the study using a survey by the state mental health center association (Moses AM, Riverbend Community Mental Health, personal communication, 2008). For one center, we had data from fiscal year 2005 only. The 2005 figures were adjusted by the increase in the Consumer Price Index U.S. medical care services item between June 2005 and June 2007 (9.4%). We estimated psychiatric hospital daily cost using the 2007 state hospital cost report (
26 ). We estimated jail costs using daily cost in the state prison from the 2007 corrections department annual report (
27 ).
Baseline measures
Research psychiatrists established co-occurring diagnoses of severe mental illnesses and substance use disorders using the Structured Clinical Interview for DSM-III-R (
28 ). The Alcohol Use Scale and Drug Use Scale are clinician-rated 5-point scales based on
DSM-III-R criteria for severity of disorder: 1, abstinence; 2, use without impairment; 3, abuse; 4, dependence; and 5, severe dependence (
29 ). The Substance Abuse Treatment Scale is a clinician-rated 8-point scale that indicates progressive involvement in treatment and movement toward remission from a substance use disorder according to Osher and Kofoed's (
30 ) model of treatment and recovery: 1–2, early and late stages of engagement; 3–4, stages of persuasion; 5–6, stages of active treatment; and 7–8, stages of relapse prevention and recovery (
31 ). A team of three independent raters, blind to study condition, established consensus ratings that were based on consideration of all available data on substance use disorders (from interview rating scales, clinician ratings, and urine drug screens) (
32 ). Symptom severity is the total score on the expanded Brief Psychiatric Rating Scale (
33 ), which assesses current psychiatric symptoms. Possible scores on the scale range from 24 to 168, with higher scores indicating greater symptom severity. Interrater reliability between the two study interviewers was high (intraclass correlation coefficient=.96)
Statistical analyses
We conducted a three-step analysis. First, we identified latent trajectory groups using hours in competitive jobs over ten years. Second, we tested possible trajectory group differences with respect to baseline characteristics. Third, we tested trajectory group differences with respect to longitudinal time-varying covariates of interest—outpatient service utilization, stays in institutions (hospitals, jails, or prisons), and costs—controlling for baseline differences identified in the second step.
To identify latent trajectory groups, we used a group-based modeling approach (
34 ), latent-class growth analysis technique (
35 ), which is a simpler version of more general growth mixture models (
36 ). The objective is to classify individuals into subgroups (latent classes) with distinctive trajectories. We identified latent groups with an "unconditional model," using SAS Proc TRAJ software (
37 ), and we replicated the results with Mplus software (
38 ). We were missing work hours data for 5% to 14% of participants across years, which we assumed were missing completely at random. Therefore, the latent trajectory analysis procedure that used this variable included participants with missing values.
The work hours variable was positively skewed with 50% or more zeros. We conducted a log transformation on this variable and applied a censored normal model that assumes the left side of the data is censored at zero. We added a constant (
1 ) to each person's work hours to avoid ln(0).
Identifying latent trajectory groups requires a dynamic model-fitting process, determining the optimal number of subgroups and trajectory shape for each group. The model with an optimal number of trajectory groups can be determined on the basis of several considerations: formal statistical testing, classification quality indicated by average posterior probabilities for each group, and subjective judgment from knowledge of the domain or usefulness of the latent trajectory classes in practice (
35 ).
We examined the relationship between the latent groups and longitudinal outpatient service utilization, institutional stay, and cost variables over ten years using mixed-effects linear models implemented in SAS PROC MIXED (continuous variables) and generalized mixed-effects models implemented in SAS PROC GLIMMIX (categorical variables) (
39 ). We also checked for group differences in baseline characteristics. Outpatient service hours were missing for 1% to 18% of participants across years. Institutional days were missing for 3% to 12%. If data for either outpatient service hours or institutional days were missing for a participant in a particular year, that person's cost for the year was considered missing, resulting in a range from 4% to 26% with missing cost data. The mixed-effects modeling approach also accommodates missing values, assuming they are missing at random.
Results
Latent trajectory groups
The latent trajectory estimation procedure yielded several models, varying in the values of the growth parameters for each group and the number of latent trajectory groups. For this analysis, all the criteria used to evaluate the solutions favored a three-class solution.
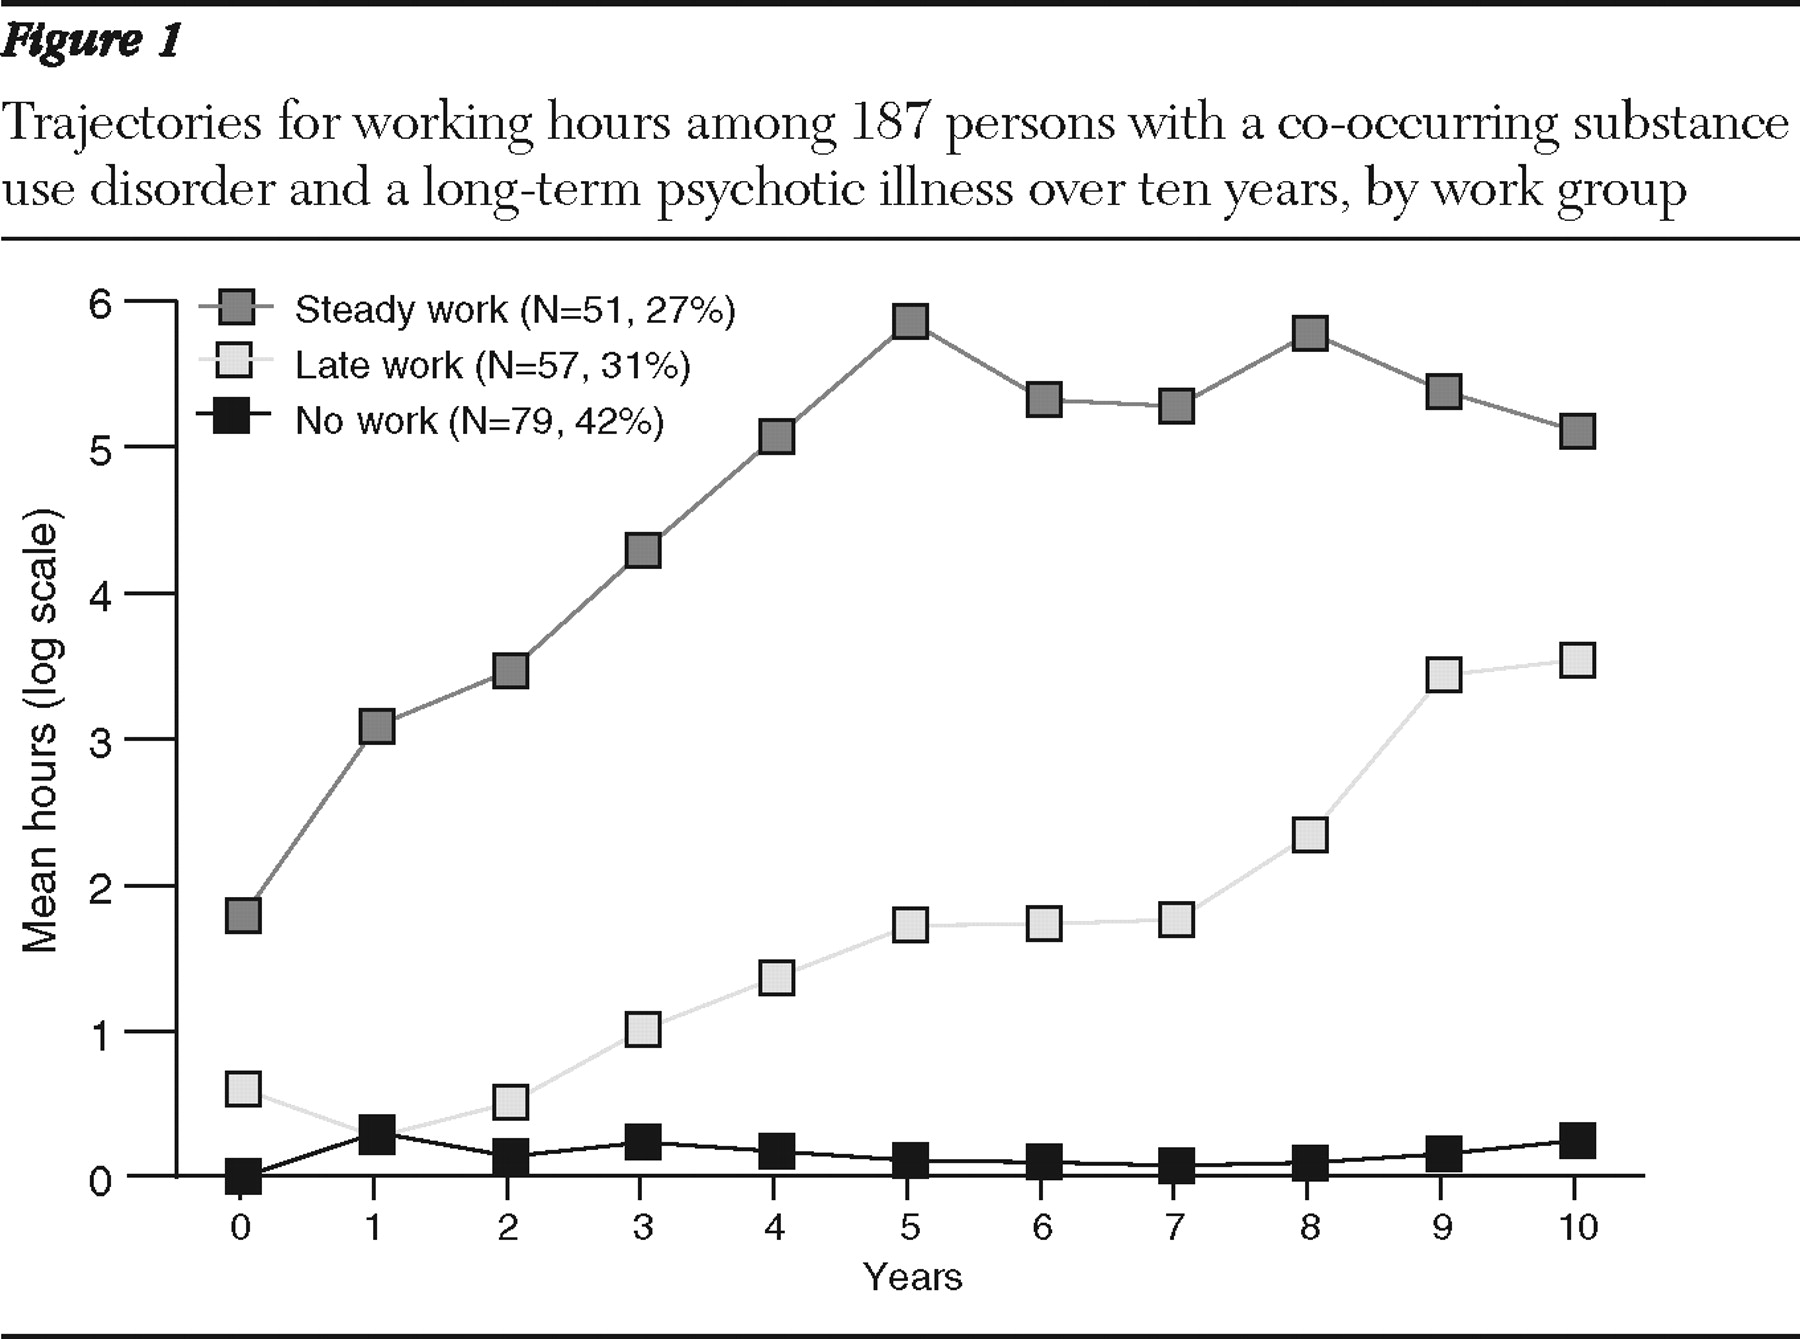
Figure 1 depicts this solution, showing estimates of the proportion of each subgroup among participants and the trajectories for the three subgroups. We labeled the groups the no-work group, the late-work group, and the steady-work group. The no-work group (N=79, 42%) was the largest. Its trajectory was flat because individuals in this group rarely worked. The late-work group (N=57, 31%) showed few work hours over three years of follow-up but progressed somewhat thereafter. The steady-work group (N=51, 27%) included some individuals with jobs at the start of the study. The group's work hours increased rapidly until year five and then stabilized. The trajectory groups were derived based on log-transformed work hours.
Initially, we compared the three latent trajectory groups with respect to outpatient service, institutional stay, and cost variables. The results showed no significant differences between the no-work group and the late-work group. Therefore, we combined these groups, labeling the combined group the minimum-work group (N=136). The minimum-work group averaged 411±654 hours worked over ten years, whereas the steady-work group worked 5,060±3,993 hours. We conducted further analysis by comparing the minimum-work group and the steady-work group.
Baseline characteristics
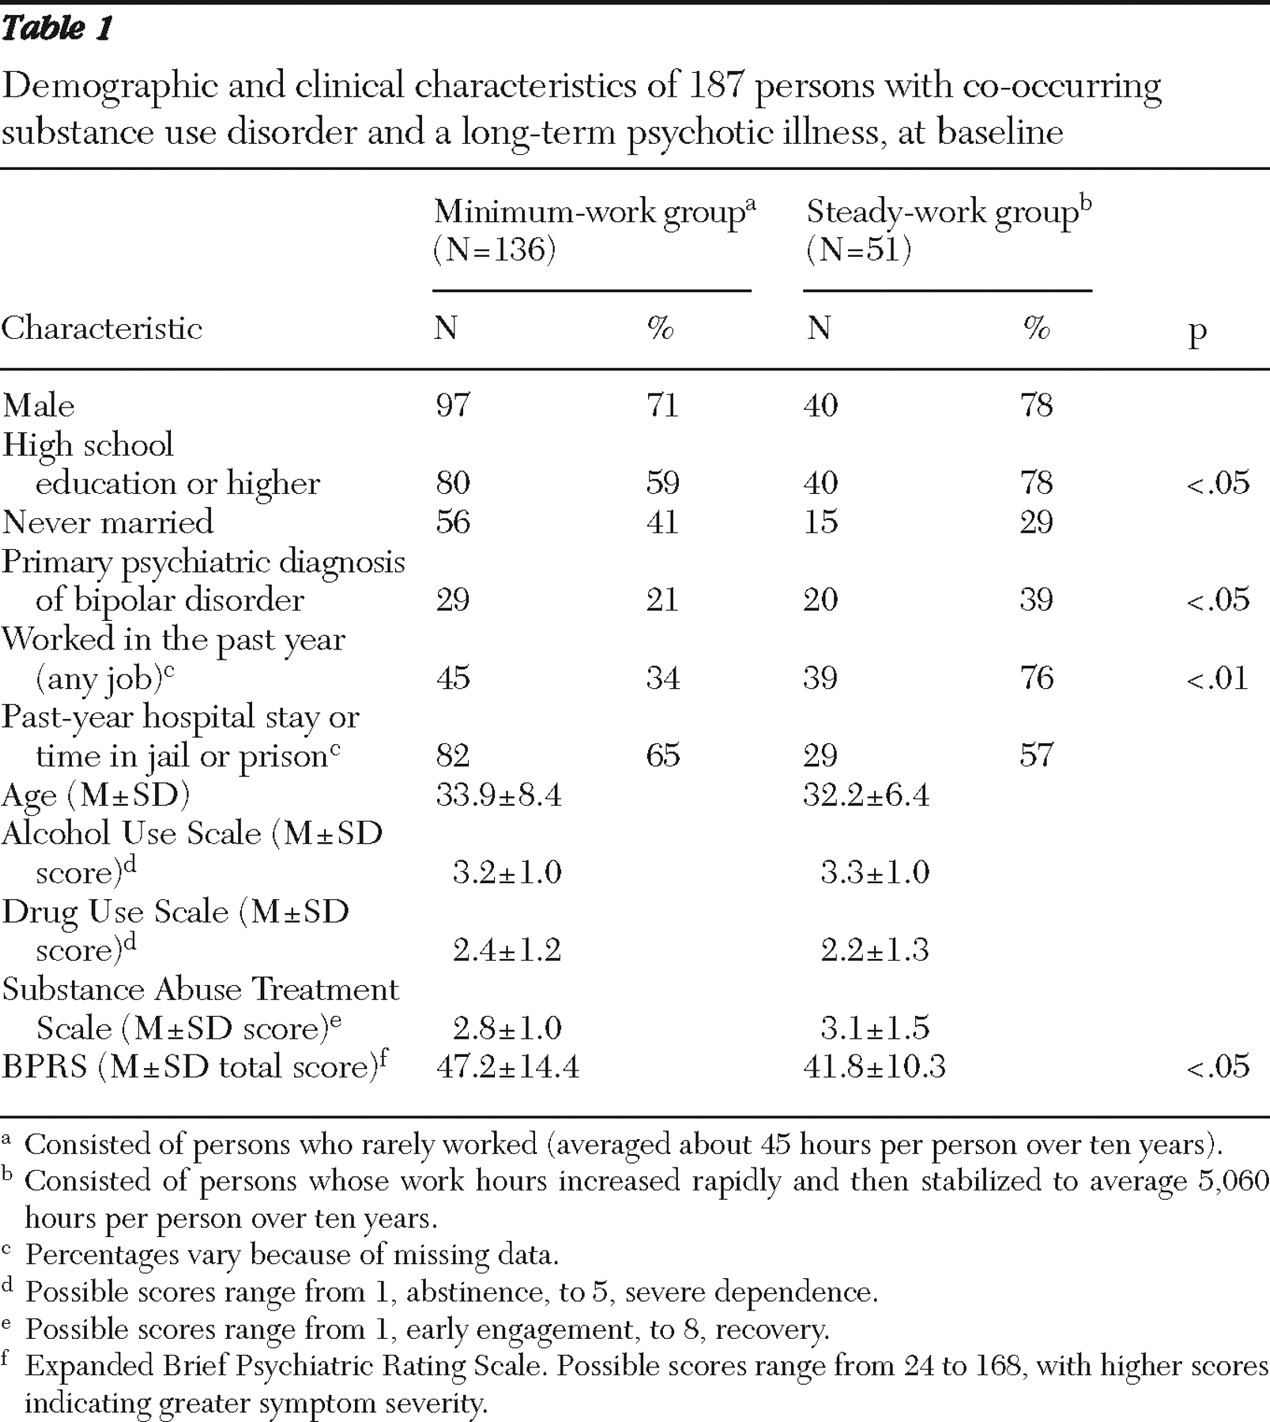
We compared the two groups (see
Table 1 ) with regard to demographic characteristics (age, sex, education, and marital status), primary psychiatric diagnosis (schizophrenia or schizoaffective disorder versus bipolar disorder), total symptom scores, employment in the past year, stays in a psychiatric hospital, jail, or prison in the past year, and substance use, using chi square tests for dichotomous variables and t tests for continuous variables. Among these, the steady-work group had significantly more education, was more likely to have worked in the past year, had a greater likelihood of having bipolar disorder, and had lower total symptom scores.
Longitudinal patterns
Longitudinal patterns of work and the utilization and cost outcomes for the minimum-work and the steady-work groups are summarized in
Table 2 and
Figure 2 .
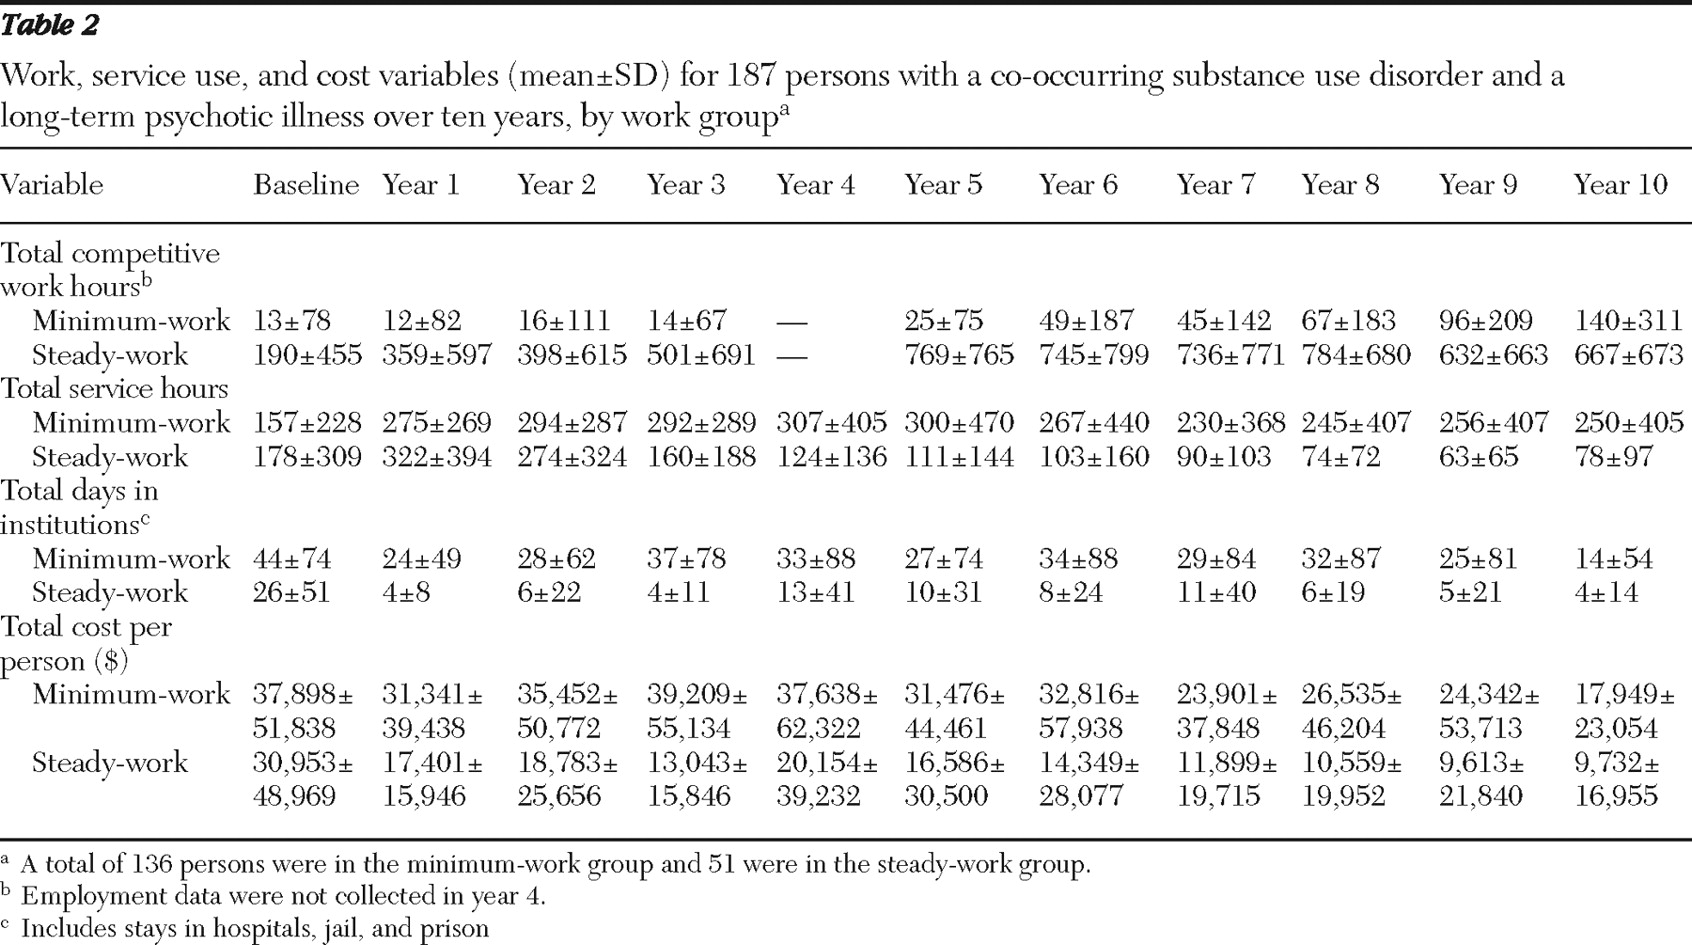
Table 2 reports means and standard deviations for work hours, outpatient service hours, institutional days, and cost.
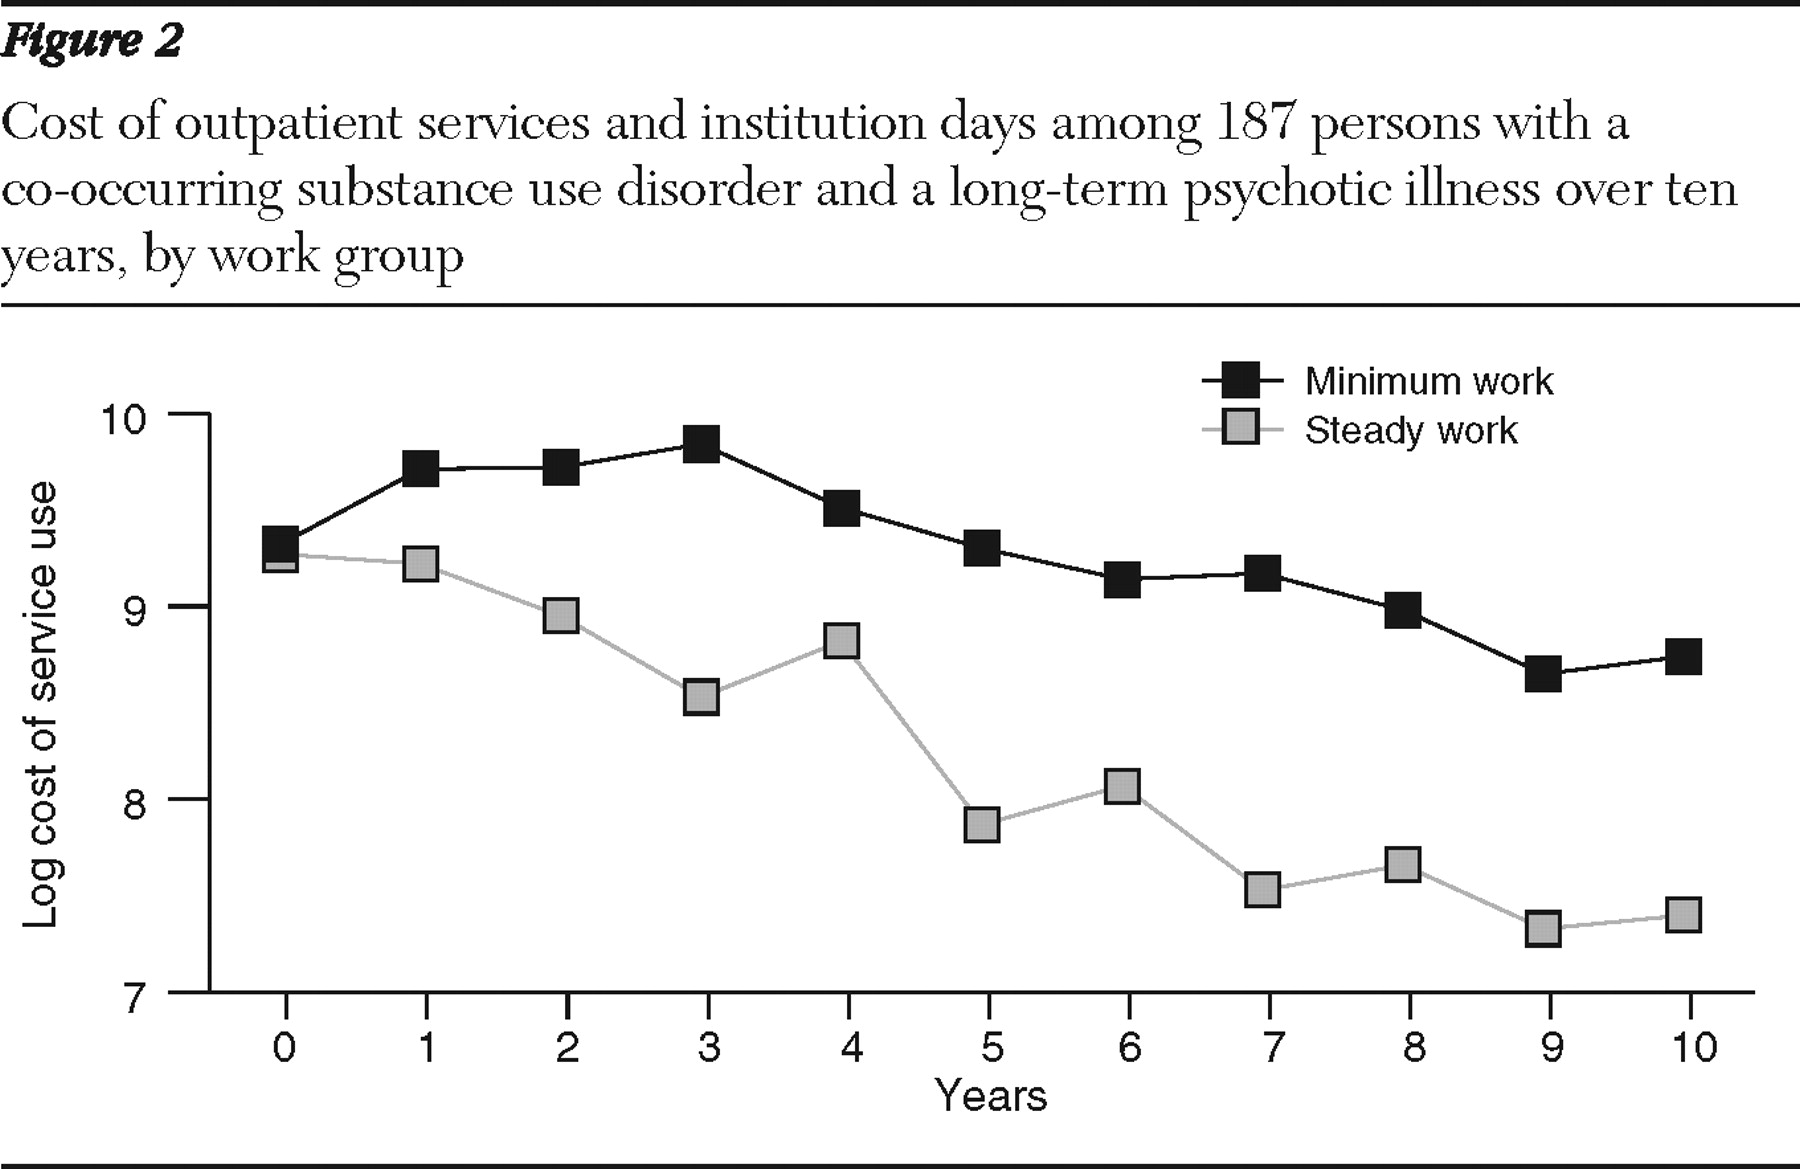
Figure 2 shows log-transformed cost data, corresponding to the data used for longitudinal analysis. (Raw cost data are presented in
Table 2 .) [Two figures showing log-transformed data for services and proportion with institutional stays are available as an online supplement at
ps.psychiatryonline.org .]
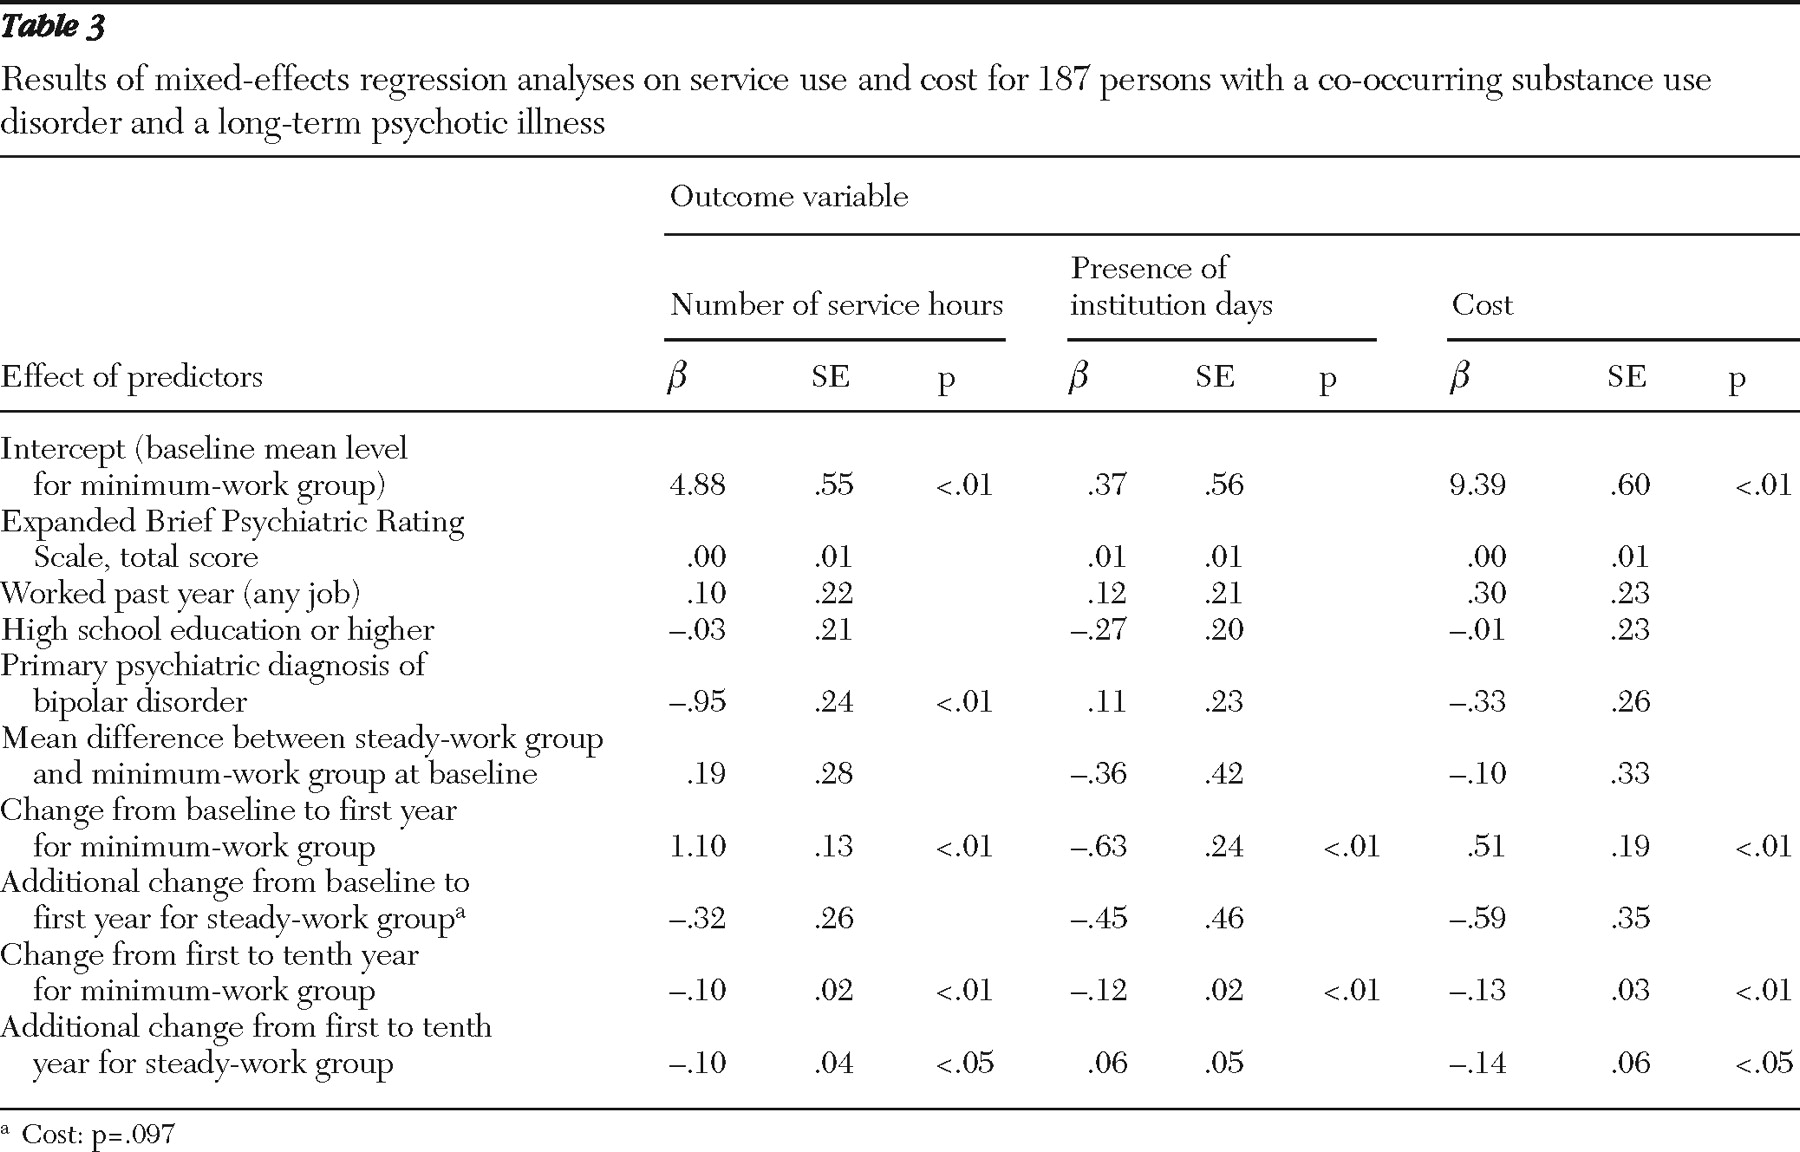
Table 3 reports mixed-effects regression analyses on service use and cost.
As depicted in the supplemental figures available online, outpatient services and institutional stays had a nonlinear trend over ten years. There were rapid changes during the first year and gradual changes thereafter. Therefore, we fit piece-wise mixed-effects models that examined baseline year to year 1 separately from year 1 to year 10. We included baseline differences as covariates in the models for all three outcomes.
As shown in
Table 3, for log-transformed outpatient service utilization, of the four baseline covariates only primary psychiatric diagnosis had a significant effect (
β =-.95, p<.01), with clients having bipolar disorder using less service. After adjustment for the effects of all covariates, there was no significant difference between the two groups at baseline (
Table 3 ). From the baseline year to year 1, services increased for both groups (
β =1.10 for the minimum-work group, and 1.10–.32=.78 for the steady-work group), with no significant difference between the two groups. From years 1 to 10, services declined for both groups, with significantly greater decline for the steady-work group. The rate of the decline for the minimum-work group was -.10 per year (p<.01), and the additional decline for the steady-work group was -.10 per year (p<.05).
We analyzed institutional stays as a dichotomous variable (that is, in an institution during the year or not) using a generalized linear mixed model.
Table 3 shows a downward trend for both groups between baseline and year 1 and between year 1 and year 10, but no significant differences were seen between the two groups at baseline or in rate of change over time. [The second supplemental figure also shows this downward trend and is available as an online supplement at
ps.psychiatryonline.org .] None of the covariates has a significant effect.
The average annual cost of outpatient services and institutional days for the minimum-work group over ten years of follow-up was $31,108±29,451 per year, more than two times that of the steady-work group total of $14,473±13,258. Over the ten years, cost in the minimum-work group exceeded that in the steady-work group by $166,350 per person. Because the cost data were skewed, statistical analyses were conducted on log-transformed data.
Figure 2 and
Table 3 show that initial cost for the two groups was about the same after adjustment for the effects of all covariates. In terms of change in cost over time, the minimum-work group had a significant upward trend from baseline to year 1 (.51, p<.01); in contrast, the steady-work group had a slight downward trend over the same period relative to the minimum-work group, but the difference was not significant. From year 1 to year 10, cost for both groups declined significantly, and the cost for the steady-work group declined significantly more than the cost for the minimum-work group. Rate of decline for the minimum-work group was -.13 per year (p<.01) from year 1 to year 10. The additional decline for the steady-work group was -.14 (p<.05). Again, none of the covariates had a significant effect for this outcome.
Supported employment services
In only one mental health center were we able to distinguish supported employment services from other outpatient mental health services. We observed that use of supported employment services for the steady-work group (N=7) was highest in years 1 to 5 and it was highest for the late-work group (N=5) in years 4 to 6. These periods corresponded to the period in which work hours increased for these two groups. The no-work group (N=7) received few supported employment services and worked minimally. The number of participants was too small for statistical testing.
Discussion
As expected, clients in this study increased outpatient service utilization and decreased their use of institutions dramatically during the first year of the study after entering treatment programs for co-occurring disorders. Those who became steady workers increased their work hours steadily over the first five years of follow-up and then maintained their employment trajectories for the next five years. After the first year, mental health outpatient utilization and service costs decreased dramatically for the steady workers, much more than for the minimal workers. These results support the potential for significant cost reductions over time among high users of mental health services who become workers. The most parsimonious explanation for this finding, consistent with many stories of recovery (
6 ), is that clients who develop independent vocational lives outside of the mental health system decrease their use of the mental health system.
Our findings raise two important questions. First, is there a causal relationship? It could be that clients enter employment and reduce levels of service utilization because they are less ill, have better motivation, or respond better to mental health treatments. We cannot rule out these explanations because our data are correlational, but several arguments make these alternative explanations less likely. First, statistical controls for education, age, previous work, and illness severity did not eliminate or even strongly affect the observed relationships. Second, cost reductions followed engagement in employment temporally. Third, many clients reported that working enabled them to manage their symptoms better and to leave the mental health system (
40 ). Fourth, employment outcomes in this study were minimally related to mental illness or substance abuse outcomes over time (
22 ). This suggests that factors such as a changed self-definition as "worker" rather than "mental health services consumer" may do more to reduce service utilization and cost than improved treatment outcomes.
Another question concerns whether participants' use of supported employment services was related to their becoming steady workers. Because management information system data from most of the centers did not consistently distinguish vocational services from other mental health services, we cannot answer this question definitively, either. However, in the one mental health center that was able to provide vocational service data for the study interval, those who worked were clearly the consumers of supported employment services.
In this study, more education, fewer symptoms, past employment, and a bipolar disorder diagnosis (versus schizophrenia or schizoaffective disorder) predicted membership in the steady-work group. However, a meta-analysis of previous studies indicates that providing evidence-based supported employment services produces better competitive employment outcomes than other vocational programs, regardless of background demographic, clinical, and employment factors (
41 ).
The largest barrier to implementation of supported employment has been financing (
42,
43 ). Even though the cost of supported employment services is minimal (
44 ), public insurers like Medicaid and Medicare have been reluctant to view supported employment as a "medically necessary" treatment, while the federal and state Vocational Rehabilitation programs have been historically wary of funding services for people with psychiatric disabilities (
7,
45,
46 ). Supported employment programs are cost-effective because they produce better outcomes than other vocational service programs for similar costs (
19 ). Nevertheless, despite significant exceptions (
47 ), supported employment has not been disseminated in proportion to need or scientific evidence. Part of the delay may be that, unlike innovations that spread rapidly (
48 ), supported employment programs produce no profit for industry. Further, traditional psychiatric rehabilitation programs may lose funding as people gain employment and leave services (
49 ). Nonetheless, long-term mental health cost reductions should motivate insurers to see the benefits of providing supported employment.
Several limitations in this study warrant attention. These include the relatively small study group, the selection of clients with co-occurring disorders who were therefore high users of mental health services, and the lack of data on employment services. The use of self-report to estimate days spent in institutions is a limitation, although analysis comparing self-report to mental health center and hospital records in the first two years of this study showed high concordance (
50 ).