Abstract

Objective:

The authors examined recent trends in incidence of psychotic disorders, demographic characteristics, and comorbid psychiatric and medical conditions among six racial/ethnic groups.

Method:

A retrospective cohort study design was used to examine the incidence of psychotic disorders across race/ethnicity groups and comorbid psychiatric and medical conditions among members of Kaiser Permanente Northern California from 2009 to 2019 (N=5,994,758). Poisson regression was used to assess changes in annual incidence, and Cox proportional hazards and logistic regression models adjusted for age and sex were used to test correlates and consequences.

Results:

Overall, the incidence of nonaffective psychotic disorders decreased slightly over the study period. Compared with White members, the risk of nonaffective psychosis diagnosis was higher among Black (hazard ratio=2.13, 95% CI=2.02–2.24) and American Indian or Alaskan Native (AIAN) (hazard ratio=1.85, 95% CI=1.53–2.23) members and lower among Asian (hazard ratio=0.72, 95% CI=0.68–0.76) and Hispanic (hazard ratio=0.91, 95% CI=0.87–0.96) members, as well as those whose race/ethnicity was categorized as “other” (hazard ratio=0.92, 95% CI=0.86–0.99). Compared with White members, the risk of affective psychosis diagnosis adjusted for age and sex was higher among Black (hazard ratio=1.76, 95% CI=1.62–1.91), Hispanic (hazard ratio=1.09, 95% CI=1.02–1.16), and AIAN (hazard ratio=1.38, 95% CI=1.00–1.90) members and lower among Asian (hazard ratio=0.77, 95% CI=0.71–0.83), Native Hawaiian or other Pacific Islander (hazard ratio=0.69, 95% CI=0.48–0.99), and “other” (hazard ratio=0.86, 95% CI=0.77–0.96) members. Psychotic disorders were associated with significantly higher odds of suicide (odds ratio=2.65, 95% CI=2.15–3.28), premature death (odds ratio=1.30, 95% CI=1.22–1.39), and stroke (odds ratio=1.64, 95% CI=1.55–1.72) and lower odds of health care utilization (odds ratio=0.44, 95% CI=0.42–0.47).

Conclusions:

This study demonstrates racial and ethnic variation in incident psychotic disorder diagnoses in the United States, compared with non-Hispanic Whites. Individuals diagnosed with psychosis face a greater burden of other negative health outcomes and lower odds of health care utilization, reflecting personal and economic impacts. Identifying risk factors for elevated rates and protective influences in subgroups can inform strategies for prevention and interventions to ameliorate severe consequences of psychotic syndromes.
According to a meta-analysis that included 101 estimates of prevalence rates of psychosis published between 1990 and 2015, the pooled median point prevalence and 12-month prevalence rates of a psychotic disorder diagnosis were 3.89 and 4.03 per 1,000 persons, respectively (1). A 2014 review found that Black patients were three to four times more likely, and Hispanic patients three times more likely, than White patients to be diagnosed with a psychotic disorder (2). Black-White differences in risk of psychotic disorders contrast with the differences in risk of common mental disorders, which have traditionally been observed to occur less often in racial and ethnic minority groups despite a greater stress burden (3). Possible explanations for racial disparities in psychosis include causal explanations, centered on social disadvantage and other effects of systemic and interpersonal racism, and noncausal explanations, such as clinical bias, including failure to identify affective disorders, and differential health care access and utilization among Black individuals (47).
Psychotic disorders and symptoms have been associated with younger age, being unmarried, urban residence, low income, drug use, trauma, social dysfunction, and depressive and neurotic symptoms (811). Psychotic disorders and symptoms have also been associated with negative health consequences and physical and mental comorbidities, including earlier death from suicide, accidents, cardiovascular disorders, metabolic disorders, cancers, and infectious diseases (1216). Compared with individuals in the general population, patients with schizophrenia have two to three times the likelihood of developing diabetes mellitus (17), have higher rates of obesity (18), and are more likely to be smokers (19, 20). Furthermore, patients with first-episode schizophrenia have been noted to be at higher risk of sexually transmitted infection, including HIV and syphilis (21).
Although disparities in rates of psychosis have been well documented in European samples (22, 23), there are fewer studies of racial and ethnic differences among U.S. population-based samples (e.g., 24). Additional research, using recent data, is needed on the incidence of nonaffective and affective psychotic disorders and associated risk factors and negative outcomes among diverse U.S. population-based samples. Understanding patterns of psychosis diagnoses in racial and ethnic groups in the United States is important for informing strategies to reduce higher rates among those who are disproportionately affected by these disorders and to increase recognition and treatment among those for whom these disorders are underdiagnosed. Here, we used data from a large sample of Kaiser Permanente Northern California (KPNC) enrollees to provide updated information on the treated incidence of psychosis among multiple racial and ethnic groups.
We conducted a retrospective cohort study investigating trends in diagnosis of psychotic disorders among persons who identified as African American or Black, American Indian or Alaskan Native, Pacific Islander, Latino or Hispanic, non-Hispanic White, Asian American, or a race/ethnicity categorized as “other” and received care at KPNC between January 1, 2009, and December 31, 2019. Because previous findings identified underdiagnosis of affective disorders among Black patients (4), we distinguished between nonaffective and affective psychoses. Our aims were to quantify the incidence of nonaffective and affective psychotic disorder diagnoses among different racial and ethnic groups over time; to estimate disparities in incidence by race/ethnicity; and to demonstrate the negative health burden associated with psychotic disorders generally, including psychiatric and medical comorbidities and causes of death. On the basis of previous research, we hypothesized that African American or Black persons would have higher rates of psychosis diagnosis, although we did not have a priori hypotheses about other racial and ethnic groups. We also hypothesized that individuals with psychosis diagnoses would have a greater burden of other mental disorder diagnoses and physical health outcomes.

Methods

Data Source

The primary sample consisted of members who received care at KPNC any time between January 1, 2009, and December 31, 2019. A retrospective cohort was constructed (N=5,994,758), for which at least 1 year of continuous enrollment was required. Follow-up started on January 1, 2009, or after 1 year of continuous enrollment, whichever came later. Individuals who received a psychotic disorder diagnosis before the follow-up period were excluded. Incidence was calculated by using the date of the first diagnosis as the date of onset. KPNC is a large, integrated health care delivery system that provides comprehensive medical care to more than 4 million individuals. The population of KPNC members is generally representative of the overall regional population, although income distribution extremes may be underrepresented (25). The study design was reviewed and approved by the KPNC institutional review board and included a waiver of informed consent, because the research involved no more than a minimal risk to participants.

Measures

Electronic health records were used to extract demographic and clinical information, including age at study entry, sex, race/ethnicity, address, body mass index, marital status, employment status, service utilization, psychiatric diagnoses, and negative outcomes or comorbidities identified during outpatient and inpatient visits. Race and ethnicity were self-identified and categorized for analysis as African American or Black (hereafter “Black”), American Indian or Alaskan Native (hereafter “AIAN”), Native Hawaiian or other Pacific Islander (hereafter “NHPI”), Latino or Hispanic (hereafter “Hispanic”), non-Hispanic White (hereafter “White”), Asian American (hereafter “Asian”), or “other” (which included multiple races or races that do not fit well in any other category and instances where race and ethnicity were not reported). Psychiatric and physical comorbidities were identified based on diagnostic codes from outpatient and inpatient visits. We calculated a dichotomous variable for whether participants had one or more health care visits (inpatient or outpatient) during the year prior to entering the study as a measure of health care access (26). Because individual-level indicators of socioeconomic status were not available (KPNC does not request information about socioeconomic status or parental education), a census-tract-level neighborhood deprivation index (NDI), created by Messer et al. (27), was calculated based on the member’s address using eight census indicators from the 2019 American Community Survey, with higher NDI values indicating greater deprivation or lower neighborhood socioeconomic status. Demographic characteristics were continually updated in the KPNC system until the data were extracted, and thus the temporal ordering of covariates in relation to outcomes was unknown.
We identified psychotic disorder diagnoses from inpatient and outpatient encounters based on ICD-9 and ICD-10 diagnostic codes recorded in the KPNC system, including nonaffective psychotic disorders (ICD-10: F20.x, F22.x, F23.x, F24.x, F25.x, F28.x, and F29.x; ICD-9: 295.x, 297.x, and 298.x) and affective psychotic disorders (ICD-10: F30.2, F31.2, F31.5, F31.64, F32.3, and F33.3; ICD-9: 296.04, 296.14, 296.24, 296.34, 296.44, 296.54, and 296.64). These case definitions are similar to those used in previous population-based registry studies (28) and were intentionally broad (e.g., unspecified diagnoses were included) to capture the full range of psychosis illness. Diagnosis of psychotic disorders in the KPNC system is typically based on medical history, chief concerns, mental status examination, functional ability, and a clinical interview with a qualified, licensed mental health clinician, which included a history of present illness, psychiatric review of systems, psychiatric history, family psychiatric history, substance use history, and social history. Although diagnoses in the KPNC system may be made by various types of health care providers, a pilot study conducted among 100 randomly selected patients with at least five psychotic disorder diagnoses found that 97% of diagnoses were made by a licensed mental health practitioner (results available upon request).

Statistical Analysis

We estimated annual incidence of affective and nonaffective psychotic disorders, diagnosed by licensed mental health clinicians, among race/ethnicity groups for each year in the study period (2009–2019). Unadjusted Poisson regression models with a log-link function were used to assess overall linear changes in annual incidence rates over time and linear changes by race/ethnicity during the study period. The statistical significance of these trends was tested with Wald tests.
Multivariable Cox proportional hazards regression analyses were conducted to estimate hazard ratios for outcomes of incident diagnosis of affective and nonaffective psychotic disorders by race/ethnicity (with White participants serving as the reference group because they represented >40% of cases) and other demographic factors. We first present the association between each demographic covariate and psychosis, adjusted for age and sex only (referred to as model 1). In addition to age and sex, model 2 also adjusted for marital status, employment status, health care utilization, and neighborhood deprivation. We then present logistic regression results that assessed the association of incident psychotic disorder diagnosis with other psychiatric diagnoses, including depressive, bipolar, anxiety, personality, and alcohol and drug use disorders, posttraumatic stress disorder (PTSD), and pervasive developmental disorders, occurring at any time during the study period. Incident psychotic disorder diagnosis was the predictor in these models, and each comorbid diagnosis was modeled as a separate outcome. Model 1 was adjusted for age and sex only. Model 2 was also adjusted for other psychiatric diagnoses occurring during the study period. Model 3 was further adjusted for race/ethnicity, marital status, employment status, and NDI.
Finally, we examined associations of psychotic disorder diagnosis with health consequences and comorbidities, including premature death (defined as death occurring before the average age of death in the U.S. population), obesity, diabetes, smoking status, sexually transmitted infection, HIV, stroke, coronary artery disease, myocardial infarction, and service utilization, by using logistic regression analyses with psychotic disorder diagnosis as the predictor. Model 1 was adjusted for demographic characteristics, including age at study entry, sex, race/ethnicity, marital status, employment status, and NDI. Model 2 was further adjusted for psychiatric comorbidities, including depressive, bipolar, anxiety, psychotic, personality, alcohol use, and drug use disorders, PTSD, and pervasive developmental disorders.
Statistical analyses were performed with SAS, version 9.4 (SAS Institute, Cary, N.C.). The p values from both multivariable Cox proportional hazards models and logistic regression models were calculated based on Wald chi-square statistics. Multiple comparisons were not accounted for, and therefore nominal p values are reported. A two-sided p value less than 0.05 was considered significant.

Results

Sample Characteristics

Table 1 shows the distribution of demographic characteristics and psychiatric comorbidities by psychotic disorder diagnosis. Among 5,994,758 KPNC members cared for between January 1, 2009, and December 31, 2019, 0.22% (N=13,303) were diagnosed with a nonaffective psychotic disorder, and 0.098% (N=5,888) were diagnosed with an affective psychotic disorder.
TABLE 1. Incidence of nonaffective and affective psychotic disorder diagnosis among 5,994,758 members of Kaiser Permanente Northern California, followed from 2009 to 2019a
CharacteristicNonaffective Psychotic DisordersAffective Psychotic Disorders
N%Person-YearsRatebN%Person-YearsRateb
Total13,303100.037,413,1373.565,888100.037,440,5771.57
Age (years)
 <184,25332.010,418,0754.081,66428.310,427,9031.60
 18–241,2379.32,227,4385.554086.92,230,7501.83
 25–341,47211.15,443,5002.7080813.75,445,8711.48
 35–441,42210.75,446,5302.6192515.75,448,6181.70
 45–541,43910.85,633,1712.5596716.45,634,8731.72
 55–641,0788.14,510,5962.3963810.84,512,2541.41
 ≥652,40218.13,733,8286.434788.13,740,3091.28
Sex
 Female6,58949.519,383,9963.403,63461.719,395,1991.87
 Male6,71450.518,029,1413.722,25438.318,045,3781.25
Race/ethnicity
 Asian1,63812.36,705,1682.4480713.76,708,5881.20
 Black2,02015.22,700,8917.4874612.72,705,7112.76
 Hispanic2,49818.87,756,3473.221,31622.47,760,3431.70
 NHPI840.6275,7233.05290.5275,8981.05
 AIAN1110.8176,6246.28380.6176,8582.15
 Other9687.32,980,0473.253896.62,982,2201.30
 White5,98445.016,818,3383.562,56343.516,830,9601.52
Marital status
 Divorced or separated1,1648.71,695,6876.865839.91,697,8453.43
 Married or partner3,16423.813,821,9532.291,89732.213,826,6261.37
 Single7,06153.113,929,2415.072,85148.413,945,2222.04
 Widowed1,1528.71,448,2237.952494.21,451,3451.72
 Unknown7625.76,518,0321.173085.26,519,5390.47
Employment status
 Employed2,55019.210,670,3942.391,52625.910,674,2881.43
 Retired3,09423.35,299,0535.8498316.75,306,1911.85
 Student9637.21,490,5426.464698.01,492,4843.14
 Unemployed5,17338.910,002,3785.172,20837.510,013,9252.20
 Unknown1,52311.49,950,7691.5370211.99,953,6880.71
Depressive disorder
 No5,04837.930,891,8581.6362210.630,908,3750.20
 Yes8,25562.16,521,28012.665,26689.46,532,2028.06
Bipolar disorder
 No8,82166.336,729,3622.403,24055.036,749,2460.88
 Yes4,48233.7683,77565.552,64845.0691,33138.30
Anxiety disorder
 No3,17423.926,152,9921.2165811.226,161,2370.25
 Yes10,12976.111,260,1469.005,23088.811,279,3394.64
Personality disorder
 No11,04983.136,772,9823.004,43875.436,796,9631.21
 Yes2,25416.9640,15635.211,45024.6643,61322.53
Alcohol use disorder
 No10,48778.835,818,9852.934,59878.135,840,7271.28
 Yes2,81621.21,594,15217.661,29021.91,599,8498.06
Drug use disorder
 No8,3876335,871,7302.343,91966.635,888,8361.09
 Yes4,916371,541,40731.891,96933.41,551,74112.69
Posttraumatic stress disorder
 No9,11568.532,408,9372.813,15553.632,431,1750.97
 Yes4,18831.55,004,2008.372,73346.45,009,4025.46
Pervasive developmental disorder
 No12,73695.737,139,7583.435,73597.437,165,3141.54
 Yes5674.3273,38020.741532.6275,2625.56
a
AIAN, American Indian or Alaskan Native; NHPI, Native Hawaiian or other Pacific Islander.
b
Rate of disorders is presented as the number of cases per 10,000 person-years.

Incidence of Psychotic Disorder Diagnoses
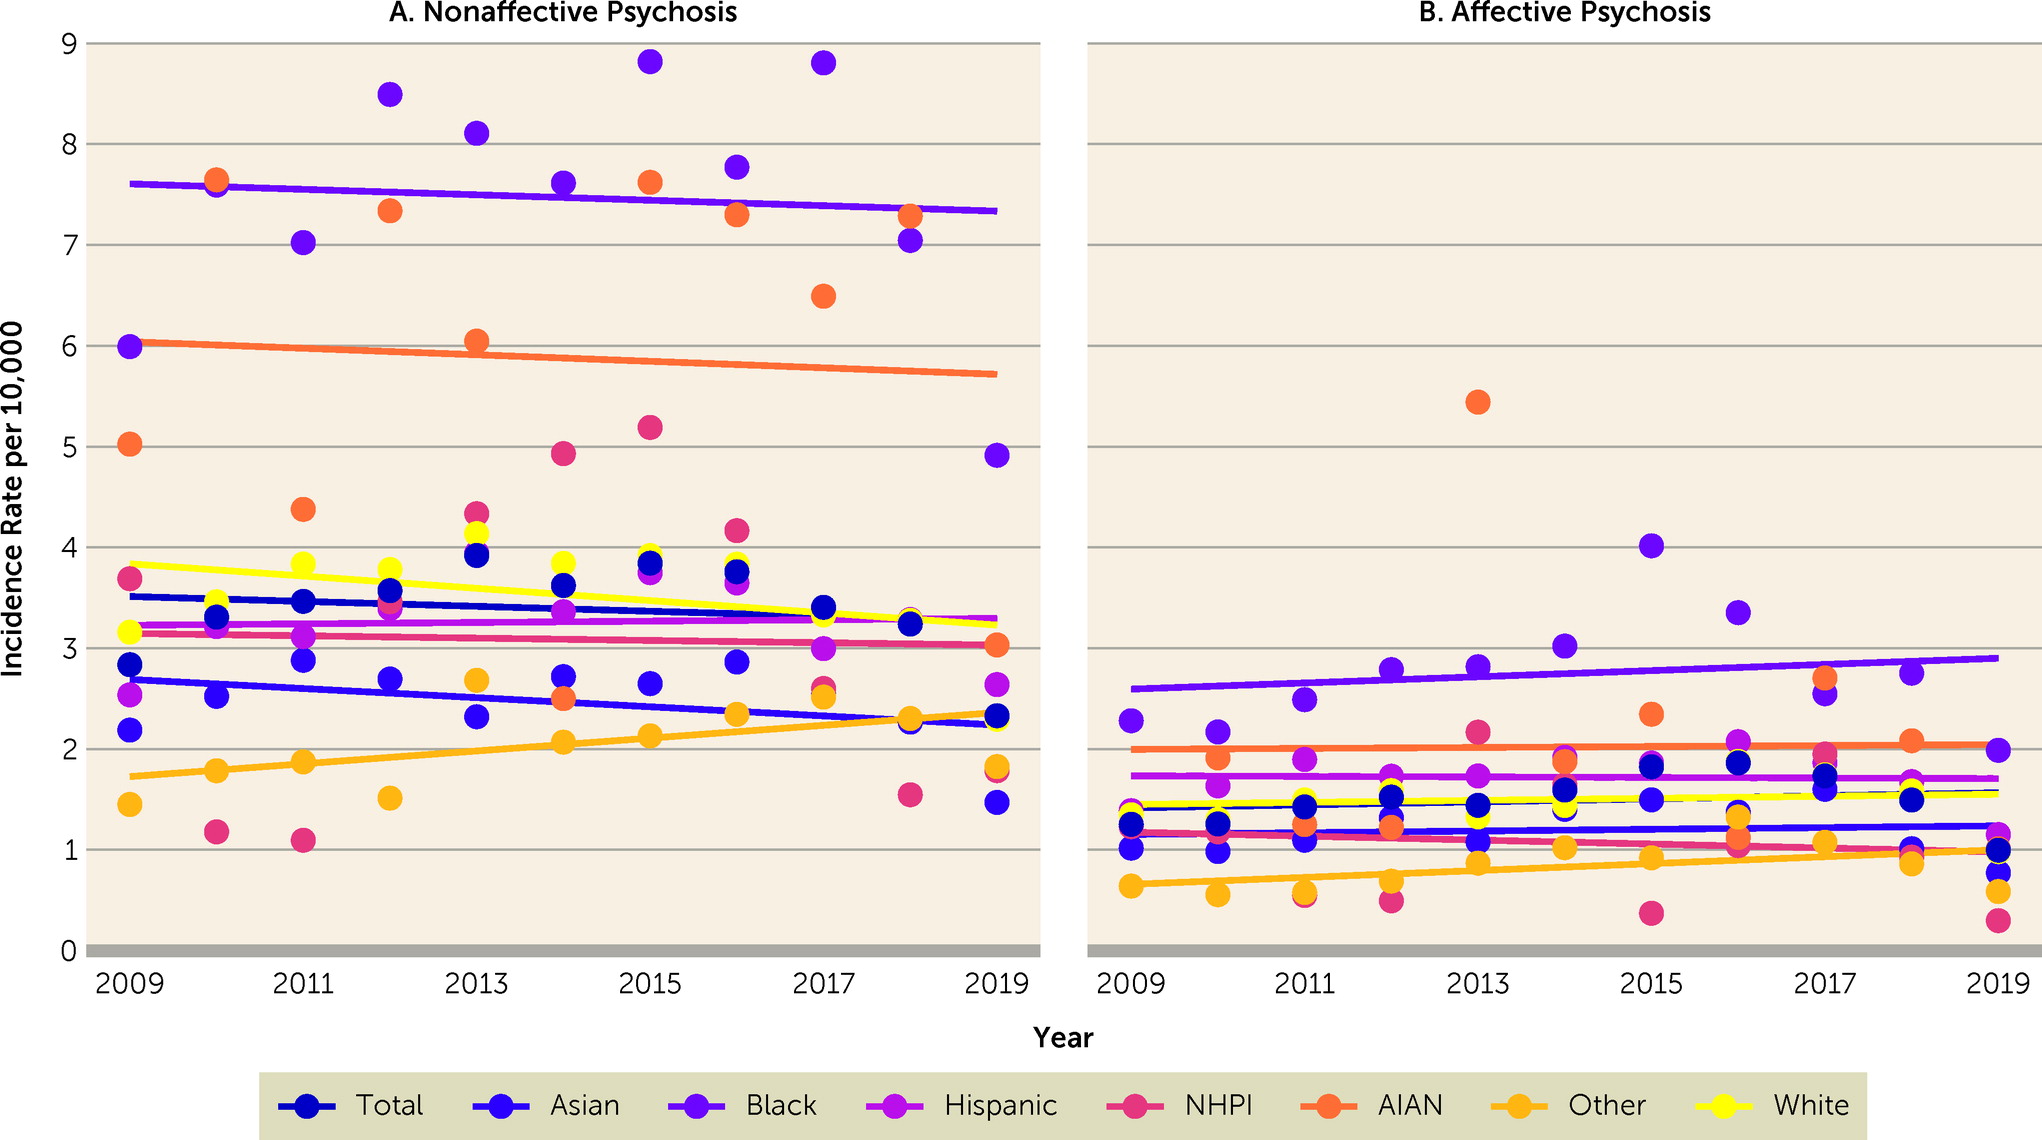
The overall incidence of nonaffective psychosis diagnosis (N=13,303) per 10,000 person-years was 2.84 in 2009 and 2.33 in 2019, with a peak of 3.92 in 2013, and the overall incidence of affective psychosis diagnosis (N=5,888) per 10,000 person-years was 1.25 in 2009 and 1.00 in 2019, with a peak of 1.86 in 2016. Figure 1 shows yearly incidence rates of nonaffective and affective psychosis diagnoses over the study period for each racial/ethnic group. Black participants generally had the highest incidence rates, and Asian participants had the lowest incidence rates, of both nonaffective and affective psychosis diagnoses throughout the study period. Specifically, the incidence of nonaffective psychosis diagnosis per 10,000 person-years among Black participants was 5.99 in 2009 and 4.91 in 2019, with a peak of 8.82 in 2015, and the incidence of affective psychosis diagnosis per 10,000 person-years among Black participants was 2.28 in 2009 and 1.99 in 2019, with a peak of 4.02 in 2015. The incidence of nonaffective psychosis diagnosis per 10,000 person-years among Asian participants was 2.19 in 2009 and 1.47 in 2019, with a peak of 2.88 in 2011, and the incidence of affective psychosis diagnosis per 10,000 person-years among Asian participants was 1.02 in 2009 and 0.77 in 2019, with a peak of 1.60 in 2017.
FIGURE 1. Incidence rates of psychotic disorders among members of Kaiser Permanente Northern California followed from 2009 to 2019, stratified by race/ethnicitya
aLinear smoothers have been added to show trends over time. AIAN, American Indian or Alaskan Native; NHPI, Native Hawaiian or other Pacific Islander.
Overall, there was evidence for a slightly decreasing linear trend in incidence of nonaffective psychosis diagnosis over time (incidence rate ratio=0.990, 95% CI=0.98–1.00, p=0.0002), which was also observed among White (incidence rate ratio=0.981, 95% CI=0.97–0.99, p≤0.0001) and Asian (incidence rate ratio=0.976, 95% CI=0.96–0.99, p=0.00198) members. Overall, no linear trend in incidence of affective psychosis over time was observed (incidence rate ratio=1.006, 95% CI=0.99–1.01, p=0.1188). Among members whose race/ethnicity was categorized as “other,” there was evidence for slightly increasing linear trends in diagnosis of both nonaffective psychosis (incidence rate ratio=1.033, 95% CI=1.05–1.05, p=0.0009) and affective psychosis (incidence rate ratio=1.043, 95% CI=1.01–1.08, p=0.0063). No other significant linear trends were observed.

Association Between Demographic Characteristics and Incident Psychotic Disorder Diagnoses

Table 2 shows associations between demographic characteristics and incident nonaffective and affective psychosis diagnosis: model 1 adjusted for age and sex, and model 2 adjusted for age, sex, race/ethnicity, neighborhood deprivation, marital status, employment status, and health care utilization. Note that these covariates may capture mechanisms for racial and ethnic differences in health, such as socioeconomic status. Furthermore, because the demographic information in the KPNC system was continually updated, temporal ordering between some covariates and other study variables is unknown. We therefore focus our interpretation on model 1, although model 2 results are also provided for readers interested in associations accounting for other covariates. In model 1, compared with White participants, both Black and AIAN participants had a higher risk of nonaffective psychosis diagnosis (Black: hazard ratio=2.13, 95% CI=2.02–2.24, p<0.001; AIAN: hazard ratio=1.85, 95% CI=1.53–2.23, p<0.001). In contrast, Hispanic, Asian, and “other” participants had lower risk compared with White participants (Hispanic: hazard ratio=0.91, 95% CI=0.87–0.96, p<0.001; Asian: hazard ratio=0.72, 95% CI=0.68–0.76, p<0.001; “other”: hazard ratio=0.92, 95% CI=0.86–0.99, p=0.018). Risk of diagnosis among NHPI participants did not significantly differ from that of White participants (hazard ratio=0.85, 95% CI=0.69–1.06, p=0.152). In model 2, associations for Asian (hazard ratio=0.78, 95% CI=0.74–0.83, p<0.001), Black (hazard ratio=1.73, 95% CI=1.64–1.82, p<0.001), NHPI (hazard ratio=0.82, 95% CI=0.66–1.02, p=0.074), and AIAN (hazard ratio=1.67, 95% CI=1.38–2.02, p<0.001) participants were similar to those calculated with model 1, but slightly reduced in magnitude. The lower risk of diagnosis among Hispanic participants compared with that among White participants was slightly higher in model 2 (hazard ratio=0.85, 95% CI=0.81–0.90, p<0.001), and the risk among “other” participants was not significantly different from that among White participants (hazard ratio=1.03, 95% CI=0.96–1.10, p=0.453).
TABLE 2. Hazard ratios of incident nonaffective and affective psychotic disorder diagnosis among 5,994,758 members of Kaiser Permanente Northern California followed from 2009 to 2019a
CharacteristicNonaffective Psychotic DisordersAffective Psychotic Disorders
Model 1Model 2Model 1Model 2
Hazard Ratio95% CIpHazard Ratio95% CIpHazard Ratio95% CIpHazard Ratio95% CIp
Race/ethnicity
 Asian0.720.68, 0.76<0.0010.780.74, 0.83<0.0010.770.71, 0.83<0.0010.840.78, 0.92<0.001
 Black2.132.02, 2.24<0.0011.731.64, 1.82<0.0011.761.62, 1.91<0.0011.431.32, 1.56<0.001
 Hispanic0.910.87, 0.96<0.0010.850.81, 0.90<0.0011.091.02, 1.160.0161.010.94, 1.080.786
 NHPI0.850.69, 1.060.1520.820.66, 1.020.0740.690.48, 0.990.0460.670.47, 0.970.035
 AIAN1.851.53, 2.23<0.0011.671.38, 2.02<0.0011.381.00, 1.900.0481.260.91, 1.740.159
 Other0.920.86, 0.990.0181.030.96, 1.100.4530.860.77, 0.960.0061.000.90, 1.120.947
 Whiteb1.001.001.001.00
Marital status
 Divorced or separated1.341.24, 1.44<0.0011.161.08, 1.25<0.0011.521.38, 1.69<0.0011.311.18, 1.45<0.001
 Married or with a partner0.450.43, 0.48<0.0010.430.40, 0.45<0.0010.620.57, 0.66<0.0010.560.52, 0.60<0.001
 Singleb1.001.01.01.00
 Widowed1.111.02, 1.200.0150.950.87, 1.030.2110.910.78, 1.060.2290.750.64, 0.88<0.001
 Unknown0.230.22, 0.25<0.0010.330.30, 0.35<0.0010.230.20, 0.25<0.0010.340.30, 0.38<0.001
Employment status
 Employedb1.01.01.01.00
 Retired2.522.32, 2.73<0.0012.402.21, 2.61<0.0012.262.02, 2.54<0.0012.211.97, 2.48<0.001
 Student4.384.02, 4.77<0.0013.823.51, 4.16<0.0015.044.46, 5.69<0.0014.443.94, 5.02<0.001
 Unemployed3.403.21, 3.60<0.0013.523.32, 3.73<0.0012.852.64, 3.08<0.0012.962.74, 3.19<0.001
 Unknown0.610.57, 0.65<0.0010.740.69, 0.79<0.0010.510.47, 0.56<0.0010.670.61, 0.74<0.001
Health services use (past year)
 <1 visitb1.001.001.001.00
 ≥1 visit1.191.13, 1.25<0.0010.950.90, 1.010.0751.671.52, 1.83<0.0011.311.19, 1.43<0.001
Neighborhood deprivation index1.201.18, 1.22<0.0011.111.09, 1.13<0.0011.181.15, 1.21<0.0011.101.07, 1.13<0.001
a
Model 1 was adjusted for age and sex. Model 2 was adjusted for age, sex, and all other variables in the table. AIAN, American Indian or Alaskan Native; NHPI, Native Hawaiian or other Pacific Islander.
b
This group was used as the reference group.
Results for affective psychosis diagnosis were similar in direction to results for nonaffective psychosis diagnosis for Black (model 1: hazard ratio=1.76, 95% CI=1.62–1.91, p<0.001; model 2: hazard ratio=1.43, 95% CI=1.32–1.56, p<0.001), Asian (model 1: hazard ratio=0.77, 95% CI=0.71–0.83, p<0.001; model 2: hazard ratio=0.84, 95% CI=0.78–0.92, p<0.001), and “other” (model 1: hazard ratio=0.86, 95% CI=0.77–0.96, p=0.006; model 2: hazard ratio=1.00, 95% CI=0.90–1.12, p=0.947) participants compared with White participants. However, the higher risk among Black participants compared with White participants was less pronounced for affective psychoses than for nonaffective psychoses, based on nonoverlapping confidence intervals. Risk of affective psychosis diagnosis was significantly higher in model 1, but not in model 2, for Hispanic (model 1: hazard ratio=1.09, 95% CI=1.02–1.16, p=0.016; model 2: hazard ratio=1.01, 95% CI=0.94–1.08, p=0.79) and AIAN (model 1: hazard ratio=1.38, 95% CI=1.00–1.90, p=0.048; model 2: hazard ratio=1.26, 95% CI=0.91–1.74, p=0.159) participants, and the risk was lower among NHPI participants (model 1: hazard ratio=0.69, 95% CI=0.48–0.99, p=0.046; model 2: hazard ratio=0.67, 95% CI=0.47–0.97, p=0.035).

Associations Between Other Psychiatric Disorders and Incident Psychotic Disorder Diagnoses

Table 3 shows associations between incident psychosis diagnosis and other psychiatric disorders occurring at any time during the study period. When the model was adjusted for age and sex (model 1), patients with psychotic disorder diagnoses had higher odds of receiving any of the other psychiatric diagnoses assessed here, with odds ratios ranging from 4.83 (95% CI=4.45–5.25) for pervasive developmental disorder to 38.58 (95% CI=37.35–39.86) for bipolar disorder. After additional adjustment for the other psychiatric diagnoses (model 2), odds ratios were greatly reduced in magnitude, but still elevated, for all diagnoses. The largest odds ratios were observed for bipolar disorder (odds ratio=7.54, 95% CI=7.25–7.84), drug use disorder (odds ratio=3.26, 95% CI=3.13–3.39), and depressive disorder (odds ratio=3.00, 95% CI=2.88–3.12). Further adjustment for demographic characteristics (model 3) slightly changed the magnitude of odds ratios without altering inferences.
TABLE 3. Associations of incident psychotic disorder diagnosis with other mental disorder diagnoses among 5,994,758 members of Kaiser Permanente Northern Californiaa
Mental DisorderModel 1Model 2Model 3
Odds Ratio95% CIpOdds Ratio95% CIpOdds Ratio95% CIp
Depressive disorder15.1114.62, 15.62<0.0013.002.88, 3.12<0.0012.982.86, 3.10<0.001
Bipolar disorder38.5837.35, 39.86<0.0017.547.25, 7.84<0.0017.677.37, 7.98<0.001
Anxiety disorder13.3112.82, 13.81<0.0012.582.46, 2.69<0.0012.652.54, 2.77<0.001
Personality disorder16.9416.28, 17.63<0.0011.481.41, 1.55<0.0011.491.42, 1.56<0.001
Alcohol use disorder8.007.70, 8.31<0.0011.151.10, 1.20<0.0011.191.13, 1.240.035
Drug use disorder16.8716.34, 17.41<0.0013.263.13, 3.39<0.0013.072.94, 3.20<0.001
Posttraumatic stress disorder4.934.77, 5.09<0.0011.201.16, 1.24<0.0011.171.13, 1.21<0.001
Pervasive developmental disorder4.834.45, 5.25<0.0011.971.80, 2.16<0.0011.881.71, 2.06<0.001
a
Odds ratios are reported for associations with other mental disorder diagnoses occurring at any time during the study period (from 2009 to 2019). Model 1 was adjusted for age at study entry and sex. Model 2 was adjusted for age, sex, and the other mental disorders evaluated. Model 3 was adjusted for age, sex, race/ethnicity, marital status, employment status, neighborhood deprivation index, and the other mental disorders evaluated.

Associations Between Incident Psychotic Disorder Diagnoses and Negative Outcomes

Table 4 shows associations between incident psychosis diagnosis and negative outcomes occurring at any time during the study period. In the model adjusted for age and sex only, individuals with psychotic disorder diagnoses had higher odds of all outcomes investigated. After additional adjustment for psychiatric comorbidities (model 2), significant positive associations were observed for death by suicide (odds ratio=2.51, 95% CI=2.03–3.10, p<0.001), premature death (odds ratio=1.53, 95% CI=1.43–1.63, p<0.001), stroke (odds ratio=1.94, 95% CI=1.84–2.04, p<0.001), coronary artery disease (odds ratio=1.28, 95% CI=1.20–1.36, p<0.001), myocardial infarction (odds ratio=1.30, 95% CI=1.20–1.41, p<0.001), obesity (odds ratio=1.13, 95% CI=1.09–1.17, p<0.001), and diabetes (odds ratio=1.36, 95% CI=1.30–1.43, p<0.001). In contrast, significant negative associations were observed for smoking (odds ratio=0.76, 95% CI=0.73–0.79, p<0.001) and service utilization (odds ratio=0.50, 95% CI=0.48–0.53, p<0.001). Further adjustment for other demographic characteristics (model 3) altered the magnitude of some odds ratios but did not change inferences.
TABLE 4. Associations of psychotic disorder diagnosis with negative outcomes among 5,994,758 members of Kaiser Permanente Northern Californiaa
OutcomePsychosis
NoYesModel 1Model 2Model 3
N%N%Odds Ratio95% CIpOdds Ratio95% CIpOdds Ratio95% CIp
Accident10,0530.2910.52.482.02, 3.06<0.0011.160.94, 1.430.1741.090.88, 1.350.411
Suicide3,2130.11000.610.918.93, 13.33<0.0012.512.03, 3.10<0.0012.652.15, 3.28<0.001
Homicide1,0590.0290.12.811.46, 5.420.0021.310.66, 2.590.4401.020.52, 2.030.948
Premature death127,0152.11,0676.12.802.62, 2.99<0.0011.531.43, 1.63<0.0011.301.22, 1.39<0.001
HIV13,8000.21100.63.532.92, 4.27<0.0010.980.81, 1.190.8630.870.71, 1.050.150
STI299,6325.01,5528.92.101.99, 2.22<0.0010.980.93, 1.040.5520.990.94, 1.050.814
Stroke250,0124.22,36113.53.393.22, 3.58<0.0011.941.84, 2.04<0.0011.641.55, 1.72<0.001
CAD246,8564.11,5558.92.001.89, 2.13<0.0011.281.20, 1.36<0.0011.111.04, 1.180.001
MI114,4151.97604.31.931.78, 2.08<0.0011.301.20, 1.41<0.0011.131.05, 1.230.002
Obesity1,833,88830.78,30647.42.312.24, 2.39<0.0011.131.09, 1.17<0.0011.101.06, 1.14<0.001
Diabetes519,6118.72,57714.71.801.72, 1.88<0.0011.361.30, 1.43<0.0011.151.09, 1.20<0.001
Smoking1,344,53822.56,06634.72.102.03, 2.18<0.0010.760.73, 0.79<0.0010.780.75, 0.81<0.001
Utilization5,039,05984.315,55588.91.371.31, 1.44<0.0010.500.48, 0.53<0.0010.440.42, 0.47<0.001
a
Odds ratios are reported for associations with negative outcomes occurring at any time during the study period (from 2009 to 2019). Model 1 was adjusted for age at study entry and sex. Model 2 was further adjusted for psychiatric comorbidities, including depressive, bipolar, anxiety, personality, alcohol use, and drug use disorders, posttraumatic stress disorder, and pervasive developmental disorders. Model 3 was further adjusted for all demographic characteristics evaluated, including race/ethnicity, marital status, employment status, and neighborhood deprivation index. Utilization was defined as at least one visit per year during the study period. CAD, coronary artery disease; MI, myocardial infarction; STI, sexually transmitted infection.

Discussion

Main Findings

In this study of over 5 million KPNC health plan members, we found evidence for a slightly decreasing linear trend in the incidence of treated psychosis between 2009 and 2019, although the underlying trends may be curvilinear. The incidence rates confirm those reported from several other large studies of both community and hospital samples in U.S. and European registries (29) and confirm a lack of consistent changes in incident psychotic disorder diagnosis rates over previous time periods in the United States (30). We found that Black participants generally had the highest rates of incident psychotic disorder diagnosis throughout the 10-year study period. In contrast to some previous U.S.-based studies (3133), Hispanic participants had a lower risk of incident nonaffective psychotic disorder diagnosis compared with White participants, and Asian participants had the lowest rates of incident psychotic disorders. Likewise, schizophrenic disorders were more common among Black participants and less common among Hispanic participants, compared with White participants, prior to adjustment for current sociodemographic characteristics in the Epidemiologic Catchment Area study, a direct interview study of a nationally representative sample of the United States conducted over 30 years ago (34). Our study is the first to show that, compared with White participants, AIAN participants are at higher risk of incident nonaffective psychosis and that Asian participants are at lower risk of affective and nonaffective psychosis. Although Black participants had the highest risk of both nonaffective and affective psychosis, the excess risk compared with that of White participants was less pronounced for affective psychosis compared with nonaffective psychosis, consistent with previous findings that Black participants are more likely to be diagnosed with nonaffective psychosis and less likely to be diagnosed with affective illness (5).

Interpretation

This study of treated incidence cannot address whether disparities in diagnosis reflect true differences in the risk of psychotic disorder, noncausal factors, such as misdiagnosis and differential treatment access and utilization, or a combination of the two. In addition, the relative influence of these factors may differ across the groups considered. With respect to noncausal factors, although differences in treatment access related to insurance status might be minimized among KPNC members, enabling resources may be unequally distributed among groups, and differences in attitudes toward mental health treatment and expression of emotional distress may lead to lower rates of clinical diagnosis among some groups. Racial/ethnic differences could also reflect bias in the perception of symptoms across patients of different races (3537), the underdiagnosis of mood disorders among Black patients (38), or the unconscious bias that has been documented in studies evaluating the influence of a clinician’s race (39).
Furthermore, true differences in the risk of psychotic disorder may exist. As recently reviewed by Anglin et al. (7), systemic racism in the United States has resulted in the unequal distribution of social, economic, and health-related disadvantages across racial and ethnic groups, resulting in greater exposure to risk factors for psychosis among Black Americans. Indeed, racism has been proposed as a fundamental cause of health inequalities that operates largely, but not entirely, through racial inequalities in socioeconomic status (40). Similarly, explanations for higher risk of psychosis among immigrant and ethnic minority groups in Europe have centered on the effects of social disadvantage, rather than noncausal explanations such as clinical bias (22, 23, 41). Such explanations deserve greater attention in the U.S.-based literature given the pervasive and cross-cutting nature of health disparities in the U.S. context.
Our results regarding comorbidity of psychotic disorders across all diagnostic categories were consistent with patterns of comorbidity in community-based samples (9). Some of the “comorbidity” observed here may more accurately reflect heterotypic continuity, clinical phenomena that occur during earlier stages of illness before the disorder fully manifests (42). Nonetheless, the pervasive comorbidity and association between comorbid conditions with poorer outcomes document the need for comprehensive care across mental health, medical, and substance abuse domains.
Our findings of increased suicide, premature death, cardiovascular disease, and diabetes and lower odds of health care utilization, even after adjustments for comorbidities, confirm the results of previous population-based studies documenting the excessive morbidity and mortality associated with a psychotic disorder diagnosis (43, 44). The fact that outcomes such as premature death, stroke, coronary artery disease, and diabetes, in this study and in previous research (45), exhibit racial and ethnic disparities in the United States further underscores the unequal health burden faced by some disadvantaged groups. Our finding of lower odds of smoking among patients with a psychotic disorder diagnosis, after adjustment for other psychiatric comorbidities, does not confirm the consistent association between smoking and schizophrenia observed in clinical data. The link between smoking and psychosis in previous research could reflect the influence of other psychiatric conditions that were not controlled for in those studies (20).

Strengths and Limitations

The strengths of this study include the availability of comprehensive clinical information and the large sample size that provided the power to examine ethnic and racial subgroups included in this uniquely diverse Northern California population. Nevertheless, a key limitation of this study is the use of broad racial and ethnic groups that may mask important differences between smaller groups (46). In addition, we did not have direct measures of disorder onset and instead relied on administrative records, which do not constitute validated cases. We also cannot rule out possible bias in our estimates due to informative censoring. Furthermore, our sample was derived from a single health care system in a specific U.S. state, and the findings may not generalize to other regions. Previous work has shown that the overall racial/ethnic composition of KPNC members does not differ from nonmember residents of California, although there is a lower percentage of Latinas among women (25). Very-low-income and high-income Californians were also underrepresented in the KPNC system, and KPNC members had higher average education and were more likely to be employed than nonmembers (25). Thus, some of the racial and ethnic differences we observed could potentially be attributed to lower case ascertainment among those with lower socioeconomic status. Because demographic information is continually updated in the KPNC system, we were unable to determine temporal ordering between psychosis and covariates that change over time, such as employment status. We also lacked information that could have enriched the study, such as measures of acculturation, immigrant status, and experiences of discrimination. Finally, a comprehensive investigation of racial and ethnic differences in diagnosis across the domains of mental and physical health disorders was beyond the scope of this study; however, such comparisons may be useful in evaluating explanations for differences in rates of diagnosis.

Conclusions

Our findings on the stability of incident psychosis in a large registry, the pervasive comorbidity, and the negative health consequences, particularly suicide and premature death, highlight the urgency of preventive interventions for individuals presenting with psychosis in health settings. Our findings also add to the evidence base for higher risk of psychosis diagnosis among Black participants in the United States. Although drivers of this risk are likely multifactorial, consistently elevated rates of psychosis among Black populations across the United States and Europe (47) highlight the importance of social factors shared across settings, including racism and other forms of social disadvantage. Future research should consider the extent to which amelioration of such social forces might reduce the excess burden of psychosis among disproportionately impacted individuals.

References

1.
Moreno-Küstner B, Martín C, Pastor L: Prevalence of psychotic disorders and its association with methodological issues: a systematic review and meta-analyses. PLoS One 2018; 13:e0195687
2.
Schwartz RC, Blankenship DM: Racial disparities in psychotic disorder diagnosis: a review of empirical literature. World J Psychiatry 2014; 4:133–140
3.
Breslau J, Kendler KS, Su M, et al: Lifetime risk and persistence of psychiatric disorders across ethnic groups in the United States. Psychol Med 2005; 35:317–327
4.
Veling W, Selten JP, Susser E, et al: Discrimination and the incidence of psychotic disorders among ethnic minorities in the Netherlands. Int J Epidemiol 2007; 36:761–768
5.
Strakowski SM, Keck PE, Jr., Arnold LM, et al: Ethnicity and diagnosis in patients with affective disorders. J Clin Psychiatry 2003; 64:747–754
6.
Feisthamel KP, Schwartz RC: Differences in mental health counselors’ diagnoses based on client race: an investigation of adjustment, childhood, and substance-related disorders. J Ment Health Couns 2009; 31:47–59
7.
Anglin DM, Ereshefsky S, Klaunig MJ, et al: From womb to neighborhood: a racial analysis of social determinants of psychosis in the United States. Am J Psychiatry 2021; 178:599–610
8.
Johns LC, Cannon M, Singleton N, et al: Prevalence and correlates of self-reported psychotic symptoms in the British population. Br J Psychiatry 2004; 185:298–305
9.
Olfson M, Lewis-Fernández R, Weissman MM, et al: Psychotic symptoms in an urban general medicine practice. Am J Psychiatry 2002; 159:1412–1419
10.
Van Os J, Hanssen M, Bijl RV, et al: Prevalence of psychotic disorder and community level of psychotic symptoms: an urban-rural comparison. Arch Gen Psychiatry 2001; 58:663–668
11.
King M, Nazroo J, Weich S, et al: Psychotic symptoms in the general population of England: a comparison of ethnic groups (the EMPIRIC study). Soc Psychiatry Psychiatr Epidemiol 2005; 40:375–381
12.
Cohen CI, Magai C, Yaffee R, et al: Racial differences in paranoid ideation and psychoses in an older urban population. Am J Psychiatry 2004; 161:864–871
13.
Brown S, Kim M, Mitchell C, et al: Twenty-five year mortality of a community cohort with schizophrenia. Br J Psychiatry 2010; 196:116–121
14.
Lawrence D, Hancock KJ, Kisely S: The gap in life expectancy from preventable physical illness in psychiatric patients in Western Australia: retrospective analysis of population based registers. BMJ 2013; 346:f2539
15.
Saha S, Chant D, McGrath J: A systematic review of mortality in schizophrenia: is the differential mortality gap worsening over time? Arch Gen Psychiatry 2007; 64:1123–1131
16.
Leucht S, Burkard T, Henderson J, et al: Physical illness and schizophrenia: a review of the literature. Acta Psychiatr Scand 2007; 116:317–333
17.
De Hert M, Schreurs V, Vancampfort D, et al: Metabolic syndrome in people with schizophrenia: a review. World Psychiatry 2009; 8:15–22
18.
Homel P, Casey D, Allison DB: Changes in body mass index for individuals with and without schizophrenia, 1987–1996. Schizophr Res 2002; 55:277–284
19.
Brown S, Birtwistle J, Roe L, et al: The unhealthy lifestyle of people with schizophrenia. Psychol Med 1999; 29:697–701
20.
Osborn DPJ, Nazareth I, King MB: Risk for coronary heart disease in people with severe mental illness: cross-sectional comparative study in primary care. Br J Psychiatry 2006; 188:271–277
21.
Liang CS, Bai YM, Hsu JW, et al: The risk of sexually transmitted infections following first-episode schizophrenia among adolescents and young adults: a cohort study of 220,545 subjects. Schizophr Bull 2020; 46:795–803
22.
Jongsma H, Gayer-Anderson C, Tarricone I, et al: Social disadvantage, linguistic distance, ethnic minority status and first-episode psychosis: results from the EU-GEI case–control study. Psychol Med 2021; 51:1536–1548
23.
Morgan C, Knowles G, Hutchinson G: Migration, ethnicity and psychoses: evidence, models and future directions. World Psychiatry 2019; 18:247–258
24.
Bresnahan M, Begg MD, Brown A, et al: Race and risk of schizophrenia in a US birth cohort: another example of health disparity? Int J Epidemiol 2007; 36:751–758
25.
Gordon NP: Similarity of the Adult Kaiser Permanente Membership in Northern California to the Insured and General Population in Northern California: Statistics from the 2011 California Health Interview Survey. Oakland, CA, Kaiser Permanente Division of Research, 2015. https://memberhealthsurvey.kaiser.org/Documents/chis_non_kp_2011.pdf
26.
Mayeda ER, Glymour MM, Quesenberry CP, et al: Inequalities in dementia incidence between six racial and ethnic groups over 14 years. Alzheimers Dement 2016; 12:216–224
27.
Messer LC, Laraia BA, Kaufman JS, et al: The development of a standardized neighorhood deprivation index. J Urban Health 2006; 83:1041–1062
28.
Schofield P, Horsdal HT, Das-Munshi J, et al: A comparison of neighbourhood level variation and risk factors for affective versus non-affective psychosis. Schizophr Res 2023; 256:126–132
29.
Jongsma HE, Turner C, Kirkbride JB, et al: International incidence of psychotic disorders, 2002–17: a systematic review and meta-analysis. Lancet Public Health 2019; 4:e229–e244
30.
Cowan DN, Weber NS, Fisher JA, et al: Incidence of adult onset schizophrenic disorders in the US military: patterns by sex, race and age. Schizophr Res 2011; 127:235–240
31.
Minsky S, Vega W, Miskimen T, et al: Diagnostic patterns in Latino, African American, and European American psychiatric patients. Arch Gen Psychiatry 2003; 60:637–644
32.
Kales HC, Blow FC, Bingham CR, et al: Race and inpatient psychiatric diagnoses among elderly veterans. Psychiatr Serv 2000; 51:795–800
33.
Muroff J, Edelsohn GA, Joe S, et al: The role of race in diagnostic and disposition decision making in a pediatric psychiatric emergency service. Gen Hosp Psychiatry 2008; 30:269–276
34.
Keith SJ, Regier DA, Rae DS: Schizophrenic disorders; in Psychiatric Disorders in America: The Epidemiologic Catchment Area Study. Edited by Robins LN, Regier DA. New York, Free Press, 1991, 33–52
35.
Neighbors HW, Trierweiler SJ, Ford BC, et al: Racial differences in DSM diagnosis using a semi-structured instrument: the importance of clinical judgment in the diagnosis of African Americans. J Health Soc Behav 2003; 44:237–256
36.
Kales HC, Neighbors HW, Valenstein M, et al: Effect of race and sex on primary care physicians’ diagnosis and treatment of late-life depression. J Am Geriatr Soc 2005; 53:777–784
37.
Schwartz RC, Feisthamel KP: Disproportionate diagnosis of mental disorders among African American versus European American clients: implications for counseling theory, research, and practice. J Couns Dev 2009; 87:295–301
38.
Jarvis GE: Changing psychiatric perception of African-Americans with affective disorders. J Nerv Ment Dis 2012; 200:1031–1040
39.
Trierweiler SJ, Neighbors HW, Munday C, et al: Differences in patterns of symptom attribution in diagnosing schizophrenia between African American and non-African American clinicians. Am J Orthopsychiatry 2006; 76:154–160
40.
Phelan JC, Link BG: Is racism a fundamental cause of inequalities in health? Annu Rev Sociol 2015; 41:311–330
41.
Morgan C, Hutchinson G: The social determinants of psychosis in migrant and ethnic minority populations: a public health tragedy. Psychol Med 2010; 40:705–709
42.
Scott J, Henry C: Clinical staging models: from general medicine to mental disorders. BJPsych Adv 2017; 23:292–299
43.
Galletly CA, Foley DL, Waterreus A, et al: Cardiometabolic risk factors in people with psychotic disorders: the second Australian national survey of psychosis. Aust N Z J Psychiatry 2012; 46:753–761
44.
Simon GE, Stewart C, Yarborough BJ, et al: Mortality rates after the first diagnosis of psychotic disorder in adolescents and young adults. JAMA Psychiatry 2018; 75:254–260
45.
Aggarwal R, Chiu N, Loccoh EC, et al: Rural-urban disparities: diabetes, hypertension, heart disease, and stroke mortality among Black and White adults, 1999–2018. J Am Coll Cardiol 2021; 77:1480–1481
46.
Alegría M, Mulvaney-Day N, Torres M, et al: Prevalence of psychiatric disorders across Latino subgroups in the United States. Am J Public Health 2007; 97:68–75
47.
Jongsma HE, Gayer-Anderson C, Lasalvia A, et al: Treated incidence of psychotic disorders in the multinational EU-GEI study. JAMA Psychiatry 2018; 75:36–46

Information & Authors

Information

Published In

Go to American Journal of Psychiatry
American Journal of Psychiatry
Pages: 805 - 814
PubMed: 37789743

History

Received: 4 November 2022
Revision received: 3 May 2023
Accepted: 31 May 2023
Published online: 4 October 2023
Published in print: November 1, 2023

Keywords

  1. Affective Psychosis
  2. Disparities
  3. Epidemiology
  4. Mental Health
  5. Nonaffective Psychosis
  6. Treated Incidence

Authors

Details

Winston Chung, M.D. [email protected]
Department of Psychiatry, Kaiser Permanente Northern California, San Francisco (Chung); Division of Research, Kaiser Permanente Northern California, Oakland (Jiang); Center for the Developing Brain, Child Mind Institute, New York (Milham); Center for Biomedical Imaging and Neuromodulation, Nathan S. Kline Institute for Psychiatric Research, Orangeburg, N.Y. (Milham); Genetic Epidemiology Research Branch, NIMH, Bethesda, Md. (Merikangas, Paksarian).
Sheng-Fang Jiang, M.S.
Department of Psychiatry, Kaiser Permanente Northern California, San Francisco (Chung); Division of Research, Kaiser Permanente Northern California, Oakland (Jiang); Center for the Developing Brain, Child Mind Institute, New York (Milham); Center for Biomedical Imaging and Neuromodulation, Nathan S. Kline Institute for Psychiatric Research, Orangeburg, N.Y. (Milham); Genetic Epidemiology Research Branch, NIMH, Bethesda, Md. (Merikangas, Paksarian).
Michael P. Milham, M.D., Ph.D.
Department of Psychiatry, Kaiser Permanente Northern California, San Francisco (Chung); Division of Research, Kaiser Permanente Northern California, Oakland (Jiang); Center for the Developing Brain, Child Mind Institute, New York (Milham); Center for Biomedical Imaging and Neuromodulation, Nathan S. Kline Institute for Psychiatric Research, Orangeburg, N.Y. (Milham); Genetic Epidemiology Research Branch, NIMH, Bethesda, Md. (Merikangas, Paksarian).
Kathleen R. Merikangas, Ph.D.
Department of Psychiatry, Kaiser Permanente Northern California, San Francisco (Chung); Division of Research, Kaiser Permanente Northern California, Oakland (Jiang); Center for the Developing Brain, Child Mind Institute, New York (Milham); Center for Biomedical Imaging and Neuromodulation, Nathan S. Kline Institute for Psychiatric Research, Orangeburg, N.Y. (Milham); Genetic Epidemiology Research Branch, NIMH, Bethesda, Md. (Merikangas, Paksarian).
Diana Paksarian, M.P.H., Ph.D.
Department of Psychiatry, Kaiser Permanente Northern California, San Francisco (Chung); Division of Research, Kaiser Permanente Northern California, Oakland (Jiang); Center for the Developing Brain, Child Mind Institute, New York (Milham); Center for Biomedical Imaging and Neuromodulation, Nathan S. Kline Institute for Psychiatric Research, Orangeburg, N.Y. (Milham); Genetic Epidemiology Research Branch, NIMH, Bethesda, Md. (Merikangas, Paksarian).

Notes

Send correspondence to Dr. Chung ([email protected]).

Competing Interests

The authors report no financial relationships with commercial interests.

Funding Information

This study was supported by a grant from the Kaiser Permanente Northern California Community Benefit Program. The work by Dr. Merikangas and Dr. Paksarian was supported by the Intramural Research Program of NIMH. The work by Dr. Milham was supported by gifts to the Child Mind Institute from Phyllis Green, Randolph Cowen, and Joseph Healey and funding from NIH (U01MH099059).The views and opinions in this article are those of the authors and should not be construed to represent the views of the sponsoring organizations or agencies or the U.S. government.

Metrics & Citations

Metrics

Citations

Export Citations

If you have the appropriate software installed, you can download article citation data to the citation manager of your choice. Simply select your manager software from the list below and click Download.

For more information or tips please see 'Downloading to a citation manager' in the Help menu.

Format
Citation style
Style
Copy to clipboard

View Options

View options

PDF/EPUB

View PDF/EPUB

Login options

Already a subscriber? Access your subscription through your login credentials or your institution for full access to this article.

Personal login Institutional Login Open Athens login
Purchase Options

Purchase this article to access the full text.

PPV Articles - American Journal of Psychiatry

PPV Articles - American Journal of Psychiatry

Not a subscriber?

Subscribe Now / Learn More

PsychiatryOnline subscription options offer access to the DSM-5-TR® library, books, journals, CME, and patient resources. This all-in-one virtual library provides psychiatrists and mental health professionals with key resources for diagnosis, treatment, research, and professional development.

Need more help? PsychiatryOnline Customer Service may be reached by emailing [email protected] or by calling 800-368-5777 (in the U.S.) or 703-907-7322 (outside the U.S.).
Media

Figures

Other

Tables

Share

Share

Share article link

Share