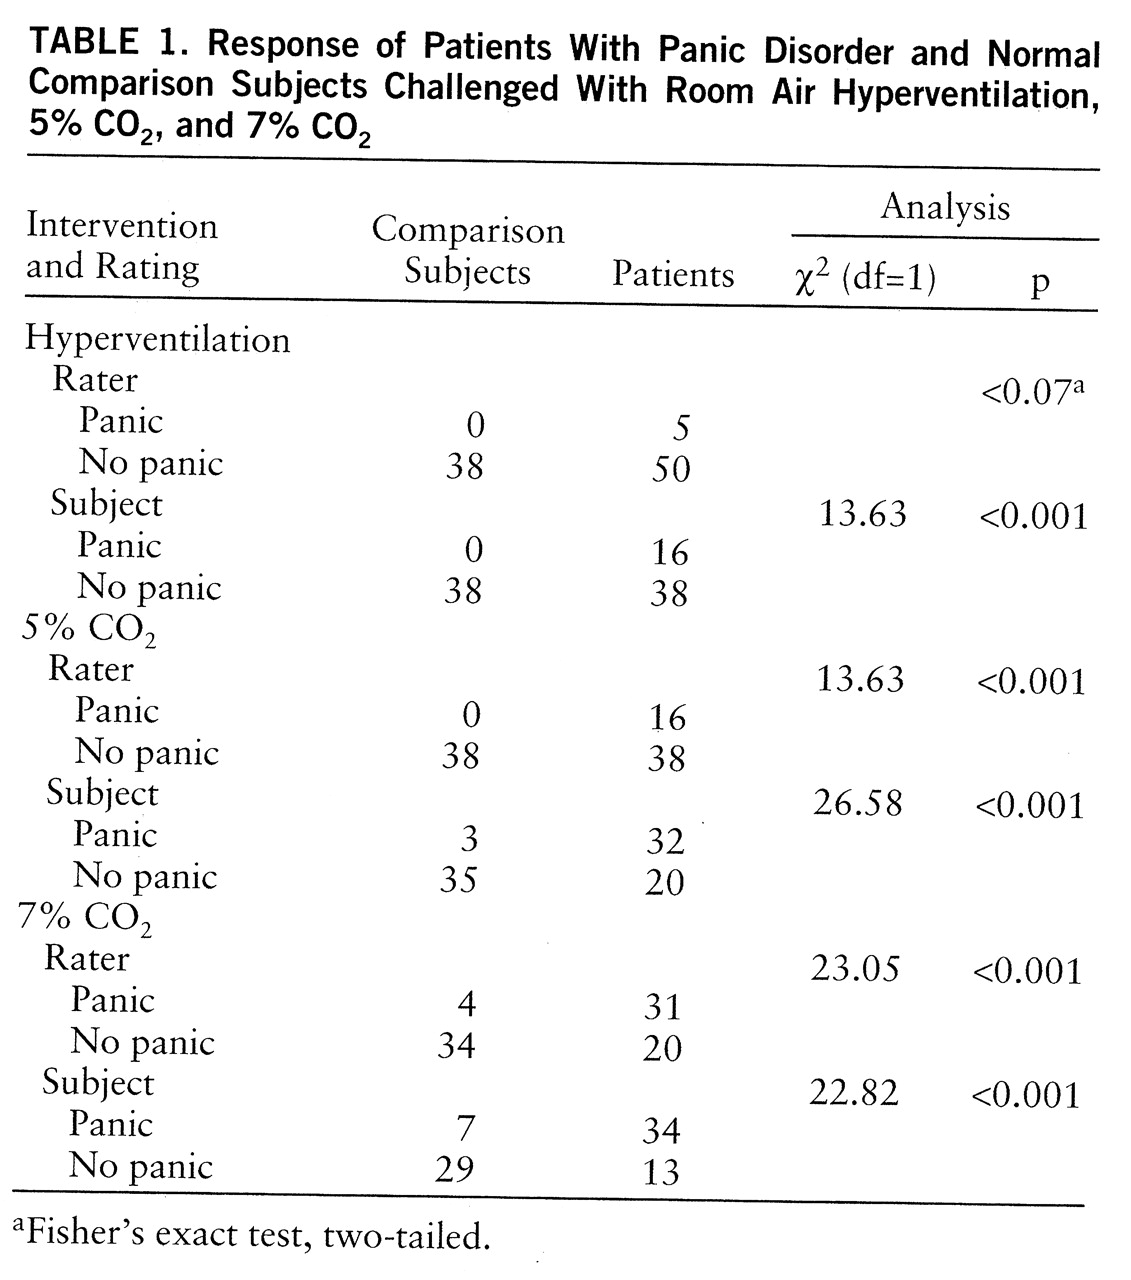
Respiratory Physiology
Baseline. The physiology data (means and standard deviations) are summarized in
table 2. The physiological differences were most prominent between panicking and nonpanicking patients when the self-ratings to 5% CO
2 inhalation were used. Unless stated otherwise, this rating is used in all subsequent analyses and tables.
At first baseline the multivariate test revealed significant sex effects only (F=3.84, df=3,79, p<0.01). Follow-up exploratory comparisons showed that baseline end-tidal CO2 for patients was significantly lower than that for the comparison group (F=7.64, df=1,91, p<0.007). Both panicking and nonpanicking patients had significantly lower end-tidal CO2 values than normal subjects (F=3.12, df=2,81, p<0.05) but did not differ from each other. Respiratory rate, tidal volume, and minute ventilation were all higher in patients than in comparison subjects, but the differences did not reach significance. The overall baseline comparison of standard deviations again revealed significant sex effects (F=4.53, df=1,90, p<0.04). The subsequent comparisons within gender showed significantly higher individual standard deviations in tidal volume (t=2.25, df=51, p<0.03, separate variance estimate) and minute ventilation (t=3.19, df=46, p<0.003) in female patients than in female comparison subjects.
We compared the three baselines (periods 1, 3, and 5) in order to assess possible differential order effects of CO2 or hyperventilation in periods 2 and 4. The overall multivariate test showed no significant order effects.
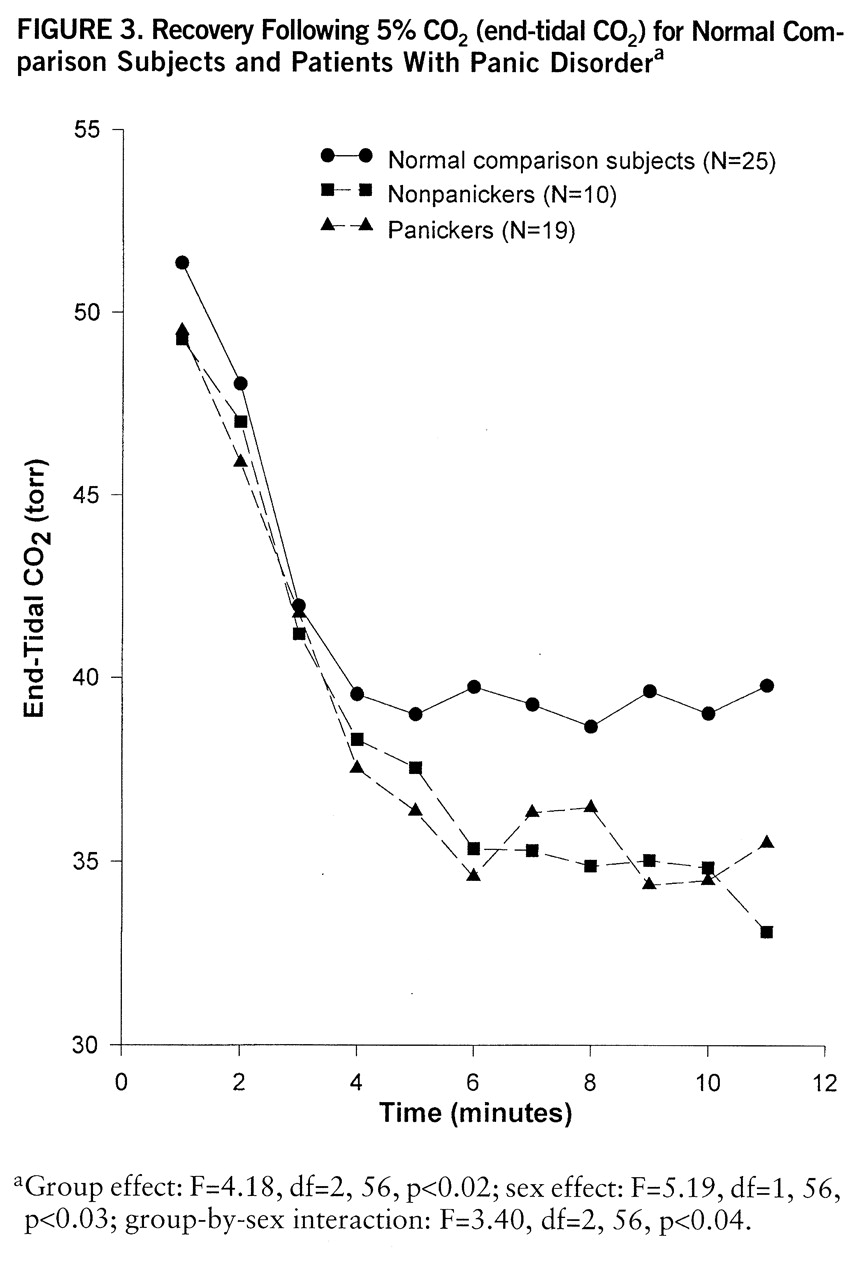
5% CO2 inhalation. Both nonpanickers (mean=16.65 minutes, SD=5.33) (t=2.05, df=50, p<0.05) and comparison subjects (mean=19.06 minutes, SD=2.10) (t=4.83, df=36,13, p<0.001, separate variance estimate) continued to breathe 5% CO2 significantly longer than panickers (mean=12.95 minutes, SD=6.89) (F=10.36, df=2,86, p<0.001). The multivariate test with three groups, three respiratory measures, and sex, which used pre- and intervention values, showed overall sex effect (F=3.19, df=3,69, p<0.03), time effect (F=101.1, df=3,69, p<0.0001), and sex-by-time interaction (F=3.64, df=3,69, p<0.02). The follow-up ANOVAs showed group effect for end-tidal CO2 (F=4.14, df=2,69, p<0.02). Both panicking and nonpanicking patients had lower end-tidal CO2 than comparison subjects. The group-by-sex interaction for end-tidal CO2 (F=8.98, df=1,81, p<0.004) was due to significantly lower values in both panicking and nonpanicking patients than in comparison subjects; female patients had the lowest values followed by male comparison subjects, male patients, and female comparison subjects.
Through use of the last 5-minute means the multivariate test showed a significant sex effect (F=2.85, df=3,75, p<0.04), and the follow-up exploratory ANOVAs found that the differences were in respiratory rate (patients: mean=20.37, SD=5.09; comparison subjects: mean=18.11, SD=3.92) (F=4.54, df=1,83, p<0.04) and end-tidal CO2 (patients: mean=49.41, SD=3.78; comparison subjects: mean=51.87, SD=3.03) (F=10.66, df=1,81, p<0.002). The group-by-time near-significant interaction for respiratory rate (F=2.65, df=2,43, p<0.08, with Greenhouse-Geisser correction) indicated a larger increase in panicking female patients than in the other two female groups.
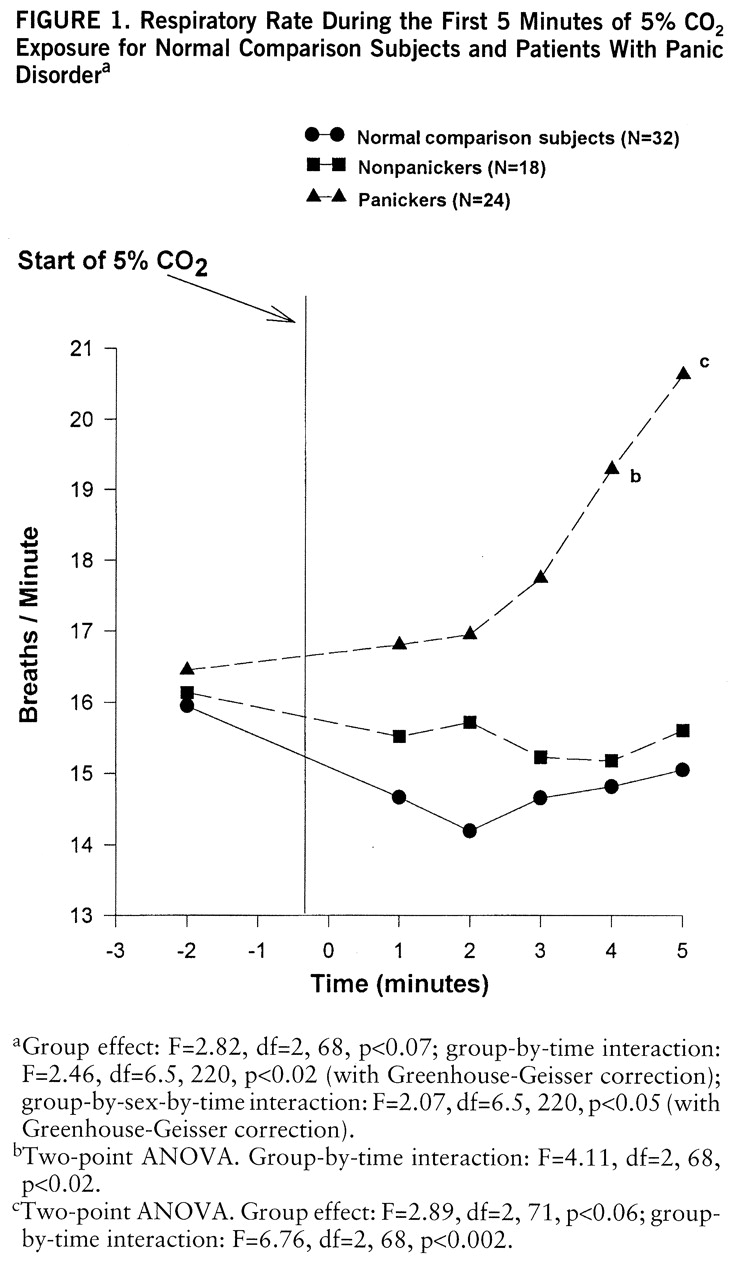
The time analysis elaborated on this finding. The multivariate comparison showed significant sex effect (F=3.63, df=3,61, p<0.02), time effect (F=46.16, df=15,49, p<0.001), and significant sex-by-time (F=3.94, df=15,49, p<0.001) and group-by-time (F=1.65, df=30,96, p<0.04) interactions. The follow-up comparison showed a near-significant group difference and significant group-by-time and group-by-time-by-sex interactions in respiratory rate (
figure 1). Patients who panicked in response to 5% CO
2 increased their respiratory rate much sooner than comparison subjects or nonpanickers. The interactions were due to a more variable course for panickers than for nonpanickers and comparison subjects and a more accentuated increase in women than in men.
Using 1-minute means we performed the multivariate test comparing the three groups (comparison subjects, self-rated panickers, nonpanicking patients) exposed to CO
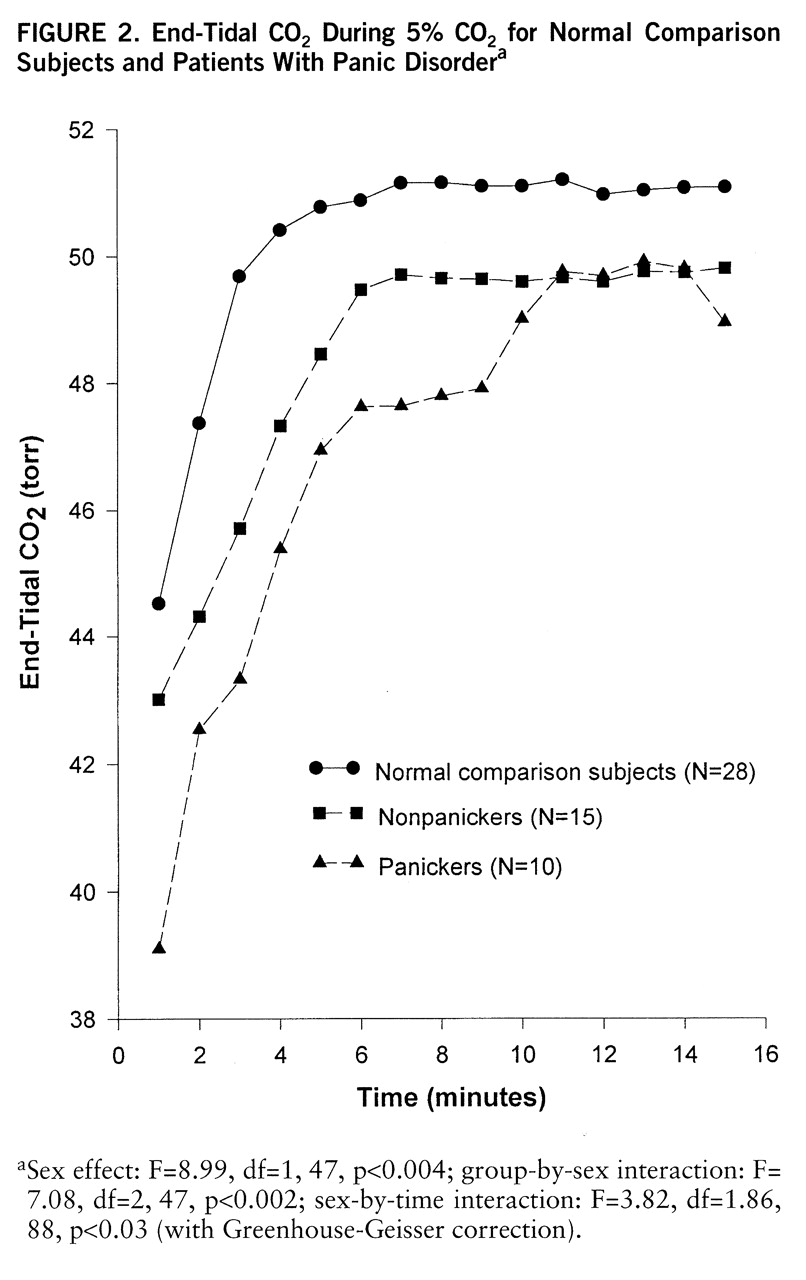
2 for the full 15 minutes. The significant overall sex effect (F=6.18, df=3,44, p<0.001) and group-by-sex interaction (F=2.93, df=6,86, p<0.01) were due to a steeper, smoother hyperbolic tidal volume rise in comparison subjects than nonpanicking patients or self-rated panickers (F=1.80, df=7,180, p<0.09, with Greenhouse-Geisser correction). Respiratory rate showed an almost opposite pattern; here the significant group effects in women (F=3.85, df=2,26, p<0.03) was the result of a steep and chaotic increase in patients, with relatively smaller changes in comparison subjects. The group-by-sex interaction for end-tidal CO
2 (
figure 2) was due to significant group differences in women (F=6.26, df=2,27, p<0.006); comparison and nonpanicking women developed steady levels by minute 5, while the end-tidal CO
2 in self-rated panickers continued to rise. The within-subject correlation coefficients between minute ventilation and end-tidal CO
2 confirmed this pattern; the mean correlation in self-rated panickers (r=0.75) was significantly higher than that in either comparison subjects (r=0.59) (t=2.13, df=43, p<0.04;) or nonpanicking patients (r=0.41) (t=2.70, df=28, p<0.02).
Hyperventilation. Panicking patients hyperventilated in room air for a mean of 11.48 minutes (SD=4.62), nonpanickers for a mean of 12.35 minutes (SD=3.44), and the comparison subjects for a mean of 12.99 minutes (SD=2.98) (n.s.). Panicking patients reached a mean end-tidal CO
2 of 31.27 torr (SD=6.23), while nonpanicking patients reached a mean of 30.28 torr (SD=6.13) and comparison subjects reached a mean of 31.87 torr (SD=6.13). All subjects were encouraged to maintain a respiratory rate of 30 breaths per minute. The actual respiratory rates, shown in
table 2, were in fact very close to 30 breaths per minute for all groups. The multivariate comparison of pre- and intervention means showed sex effect (F=6.12, df=3,65, p<0.001), time effect (F=94.71, df=3,65, p<0.001), and group-by-sex (F=2.27, df=6,128, p<0.04) and sex-by-time (F=3.84, df=3,65, p<0.01) interactions. Follow-up ANOVAs showed no group differences for any of the measures.
Through use of the last 5-minute means the multivariate analysis showed sex effect only (F=3.49, df=3,68, p<0.02). The follow-up exploratory comparisons showed no significant differences between patients and comparison subjects with respect to tidal volume and respiratory rate. For end-tidal CO2 significant group-by-sex interaction (F=4.49, df=2,78, p<0.01) showed that panicking (mean=26.62 torr, SD=3.51) and nonpanicking (mean=27.35 torr, SD=5.82) female patients had significantly lower end-tidal CO2 than comparison women (mean=32.88 torr, SD=7.63). The same analysis in men would have been meaningless, since only two men panicked during this intervention.
7% CO2 inhalation. The mean times of 7% CO2 exposure for each group were as follows: panickers, mean=8.74 minutes, SD=7.01; nonpanickers, mean=10.87 minutes, SD=6.06; normal comparison subjects, mean=15.75 minutes, SD=5.43 (F=9.88, df=2,75, p<0.001). Comparison subjects lasted significantly longer than either panickers (t=4.38, df=61, p<0.001) or nonpanickers (t=2.60, df=40, p<0.02). The multivariate comparison of pre- and intervention values showed sex effect (F=8.41, df=3,48, p<0.001) and group-by-sex (F=2.80, df=6,94, p<0.02) and sex-by-time (F=9.53, df=3,48, p<0.001) interactions. The follow-up ANOVAs showed significant sex effect (F=20.1, df=1,52, p<0.001) and sex-by-time interaction (F=22.82, df=1,52, p<0.001) for tidal volume, with panicking male patients having the lowest tidal volume response followed by nonpanickers and then by comparison subjects. This difference resulted in significantly higher tidal volume during the last 5 minutes of CO2 exposure in comparison subjects (mean=1,956 ml, SD=729) than in patients (mean=1,613 ml, SD=642) (F=4.23, df=1,69, p<0.04). The significant group-by-sex-by-time interaction for respiratory rate (F=3.25, df=2,52, p<0.05) was due to panicking female patients having a significantly larger respiratory rate increase than comparison subjects (group-by-time interaction in women: F=4.65, df=2,30, p<0.02). Panicking female patients started with a lower respiratory rate but ended up with a higher rate than the other two groups of women.
CO2 Sensitivity
No overall conventional CO2 sensitivity (delta minute ventilation divided by delta end-tidal CO2) differences emerged with use of either the 5% or the 7% values against baseline. However, sensitivity attributable to respiratory rate showed significant overall sex effect (F=4.67, df=1,71, p<0.03). Female patients (mean=0.20, SD=0.19) had significantly higher response than female comparison subjects (mean=0.10, SD=0.11) during 5% CO2 inhalation (t=–2.25, df=41.44, p<0.03, separate variance estimate). Similar but more accentuated respiratory rate response differences were found during 7% CO2. Here, the significant overall sex effect (F=7.42, df=1,55, p<0.01), group effect (F=3.39, df=2,55, p<0.04), and group-by-sex interaction (F=3.31, df=2,55, p<0.05) were due to significantly higher respiratory rate response in female patients (mean=0.30, SD=0.29) than in female comparison subjects (mean=0.10, SD=0.13) (F=6.03, df=2,31, p<0.01), resulting in a significant overall patient/comparison subject difference in respiratory rate response (patients: mean=0.23, SD=0.25; comparison subjects: mean=0.13, SD=0.13). While it was not significant, panicking patients had the highest response (0.26) followed by nonpanicking patients (0.17) and comparison subjects (0.13).
During 5% CO2 female comparison subjects had higher tidal volume response (mean=40.97, SD=21.78) than female patients (mean=28.63, SD=12.66) (F=2.87, df=2,31, p<0.07), which produced an overall patient/comparison subject difference in tidal volume response (F=2.63, df=2,71, p<0.08).
