Magnetic resonance imaging (MRI) has been useful in revealing subtle structural brain abnormalities in schizophrenic patients, including ventricular enlargement, low volume in the frontal lobe (e.g., references
(1-
3) and parietal lobe (e.g., references
4 and
5), and low gray matter volume in medial temporal lobe structures
(6,
7). The last finding is among the most consistent (see review by Shenton et al.
[8]). Several reports have described low volume of the superior temporal gyrus (e.g., references
9 and
10) that is more pronounced on the left. The left superior temporal gyrus is of particular interest to schizophrenia because it is a cortical area thought to be a substrate of auditory and language processing
(11), domains often impaired in schizophrenia.
It is unknown whether the brain abnormalities observed with MRI in schizophrenia are confounded by chronicity or whether there is a continual degenerative process. Patients with chronic schizophrenia may demonstrate pathology secondary to chronic treatment with neuroleptic medication and long-term institutionalization. Examining first-episode patients can obviate chronicity-related confounds. Several studies have evaluated morphometric abnormalities in first-episode schizophrenia. These studies have shown MRI abnormalities similar to those seen in chronic schizophrenia, including large lateral ventricles
(12-
15), high rates of qualitatively evaluated global MRI abnormalities for several regions (including third ventricle, medial temporal lobe structures, and frontal and parietal cortex
[15]), and low volume of cortical gray matter
(16). However, to our knowledge no study has directly measured superior temporal gyrus gray matter volume, and although asymmetry of the superior surface of the temporal lobe has been observed in patients with first-episode schizophrenia
(17,
18), we know of no reports of the abnormal volume asymmetries observed in chronically ill patients
(8,
10).
Morphometric MRI studies of patients with affective disorder have also indicated low volumes in several regions, including the frontal lobe, temporal lobe, and putamen, although these findings were described as somewhat inconsistent in a recent review
(19). We know of no study, however, that used quantitative volumetric MRI measures to compare first-episode schizophrenia with first-episode affective disorder, a comparison that might highlight abnormalities that are specific to schizophrenia.
In the present study, the superior temporal gyrus, amygdala-hippocampal complex, and parahippocampal gyrus were evaluated in psychotic patients with first-episode schizophrenia or affective disorder and in a normal comparison group in order to determine whether a left-lateralized low volume of temporal lobe structures was present at the first hospitalization for schizophrenia and is specific to schizophrenia.
METHOD
Study Groups
Subjects were referred from the McLean/Harvard first-psychosis project
(20) or recruited from the inpatient population of McLean Hospital. Patients who were entering the hospital for the first time with psychosis or were being transferred or readmitted within 8 months of the first hospitalization for psychosis were recruited. The patients and comparison subjects met the following criteria: age 18 to 55 years; IQ above 75; right-handedness; negative history of seizures, head trauma with loss of consciousness, and neurological disorder; and no lifetime history of alcohol or drug dependence. The comparison subjects had no axis I mental disorder themselves or in their first-degree relatives.
Diagnoses were based on the Structured Clinical Interview for DSM-III-R (SCID)
(21), review of hospital course, and medical records. The patient groups consisted of 17 schizophrenia patients (14 male, three female) and 16 patients with affective disorder (13 male, three female). The diagnoses of the patients with affective disorder were bipolar disorder, manic (N=12), bipolar disorder, mixed (N=2), and major depression (N=2) (the statistically significant results reported here remained the same after exclusion of the two patients with major depression). All of the patients exhibited psychosis, and all of the patients in the schizophrenia group met the diagnostic criteria for schizophrenia, including a 6-month duration of prodromal symptoms either at initial testing (N=12) or on follow-up (N=5); four also met the mood criteria for schizoaffective disorder. The median duration of treatment with any psychotropic medication before scanning was short: 1.7 months for the schizophrenic patients and 0.0 months for the patients with affective disorder. Neither duration nor dose of medication was significantly correlated with any MRI volume measure.
Of the 33 patients scanned, 29 received an MRI within 3 weeks of entering McLean Hospital, and the remaining four (two with schizophrenia, two with affective disorder) returned after discharge for imaging (15 and 22 months for schizophrenia, respectively, and 9 and 18 months for affective disorder). (The statistically significant results reported in the following remained the same with exclusion of these four patients.)
An age-matched group of 18 psychiatrically well comparison subjects was recruited through newspaper advertisements; they were assessed with the SCID editions for nonpatients (SCID-NP,
22) and personality disorders (SCID-II,
23), and the group comprised 16 men and two women. No subject reported any evidence of psychosis in first-degree relatives.
All subjects were given the Mini-Mental State
(24) to rule out any dementia or delirium, the information subscale of the WAIS-R
(25) as a gross estimate of general fund of information, and the digits forward and digits backward subscales of the WAIS-R to test immediate/short-term memory, attention, and concentration. Socioeconomic status and parental socioeconomic status
(26) were measured. Psychosis was assessed by using the Brief Psychiatric Rating Scales (BPRS)
(27), and social functioning was assessed with the Global Assessment Scale (GAS)
(28); summary data are given in
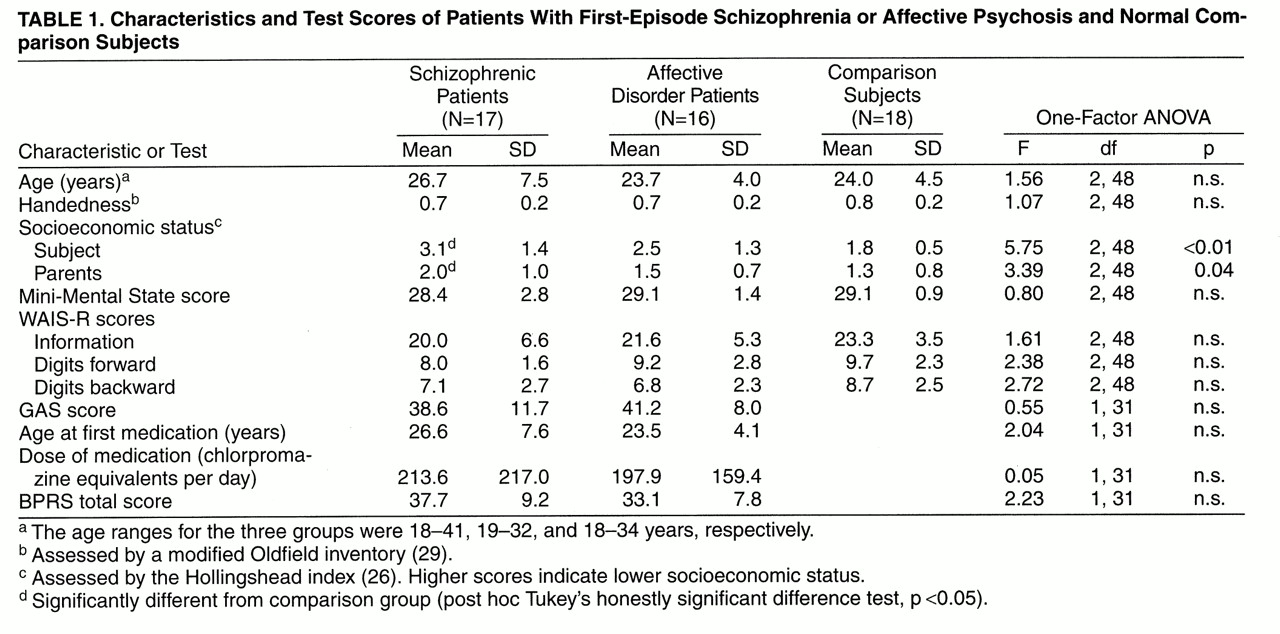
table 1.
After complete description of the study, written informed consent was obtained. The subjects were paid for participating.
MRI Method
Acquisition and processing
We have elsewhere described the protocol for obtaining magnetic resonance images on a 1.5-T General Electric scanner (GE Medical Systems, Milwaukee)
(10,
30,
31). The acquisition protocol had two MRI sequences. The first was a coronal series of contiguous images. The imaging variables were as follows: TR=35 msec, TE=5 msec, one repetition, 45° nutation angle, 24-cm field of view, NEX=1.0 (number of excitations), matrix = 256 × 256 (192 phase-encoding steps) × 124. The voxel (volume of pixel) dimensions were 0.9375×0.9375×1.5 mm. The data were reformatted in the coronal plane and analyzed as 124 coronal slices of 1.5-mm thickness. This protocol was used for delineating and measuring temporal lobe regions. The second acquisition resulted in an axial series of contiguous double-echo (proton density and T
2-weighted) images. The imaging variables were as follows: TR=3000 msec, TE=30 and 80 msec, 24-cm field of view, and an interleaved acquisition with 3.0-mm slice thickness. The voxel dimensions were 0.9375×0.9375×3.0 mm. This latter protocol was used to assess whole-brain volume. To reduce flow-related artifacts and to obtain low arterial-signal intensity, gradient moment nulling and presaturation of a slab inferior to the head were performed in both the axial and coronal acquisitions. A semiautomated segmentation procedure (10) on the axial double-echo slices measured total intracranial content. An anisotropic diffusion filter (k=14 for SPGR and 90 for proton/T
2 images, iteration=3) was used to reduce noise before the processing of each set of scans
(31).
Regions of interest
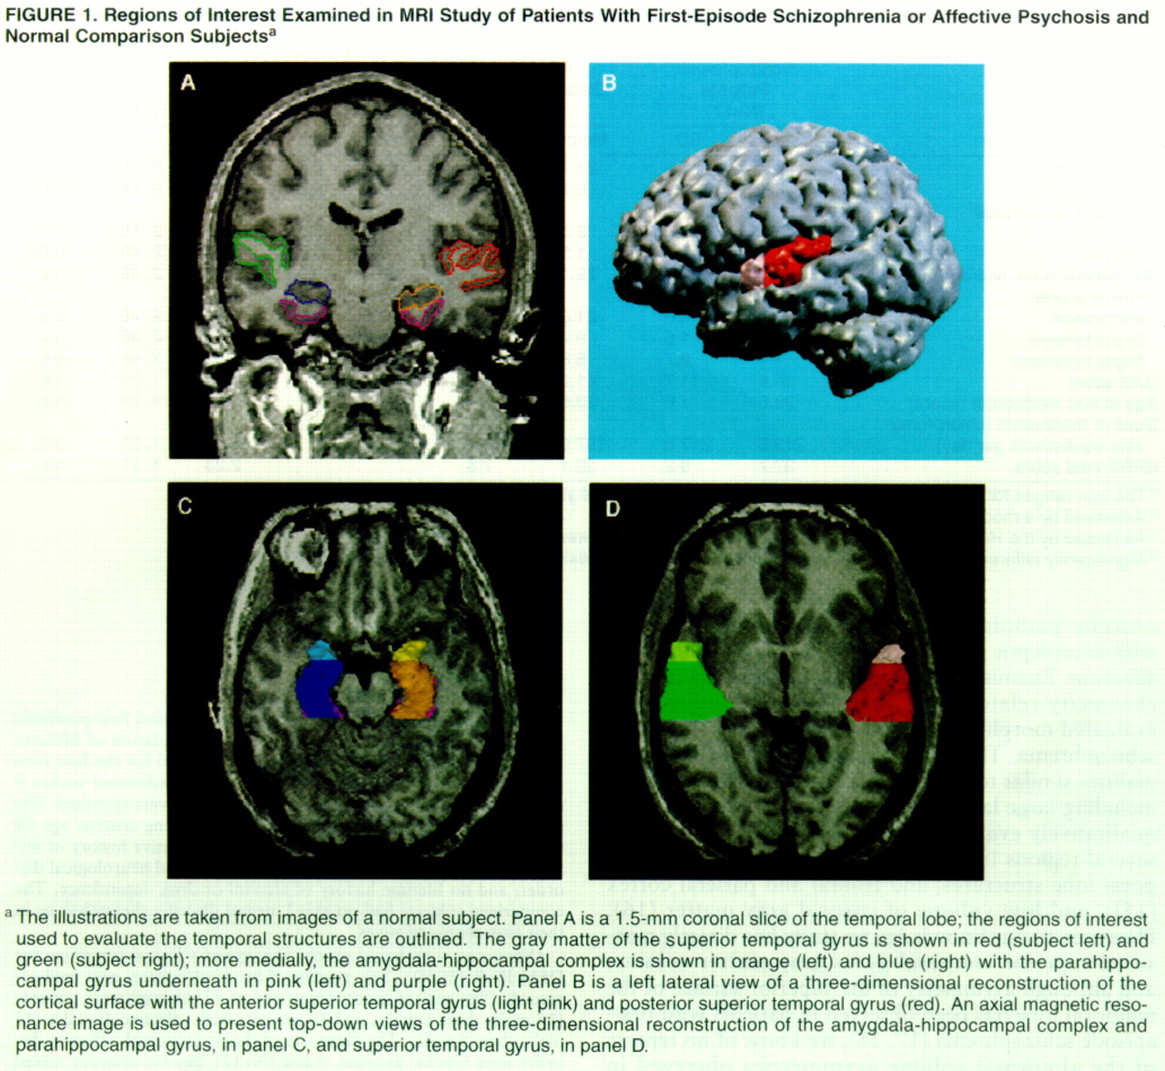
The neuroanatomical regions of interest were the gray matter of the superior temporal gyrus, amygdala-hippocampal complex, and parahippocampal gyrus, which were outlined manually on a workstation and are delineated in
figure 1A, where the gray matter of the superior temporal gyrus can be seen. More medially, the amygdala-hippocampal complex is shown with the parahippocampal gyrus underneath. Decisions regarding the gyral boundaries for the superior temporal gyrus were made with the aid of resliced sagittal magnetic resonance images computed from the coronal images. All analyses were performed by individuals who were blind to subject identity, age, and diagnosis. Each region of interest for the superior temporal gyrus, amygdala-hippocampal complex, and parahippocampal gyrus began anteriorly at the slice unambiguously depicting the temporal stem and extended posteriorly to the last slice showing the fornix along the border of the lateral ventricles. This was further subdivided into the anterior and posterior portions at the first slice including the mammillary bodies. (The number of slices from the most anterior to the posterior bound did not differ between the comparison subjects and the patients.) To separate the gray and white matter of the superior temporal gyrus from the rest of the temporal lobe, a line was drawn in the deepest points of the sulci of the superior temporal gyrus (sylvian point and superior temporal sulcus) for each slice. The internal boundary for the superior temporal gyrus was always white matter, and the external bound was CSF. Interrater reliability was computed for all regions of interest by three raters (Y.H., I.A.F., and T.K.) with three cases. The average intraclass correlation coefficients (ICCs) for the three raters were as follows: superior temporal gyrus, ICC=0.99 (F=6.66, df=2, 11); parahippocampal gyrus, ICC=0.99 (F=11.34, df=2, 11); amygdala-hippocampal complex, ICC=0.95 (F=3.71, df=2, 11).
Statistical Analyses
One-factor analysis of variance (ANOVA) was used to test for group differences in age, socioeconomic status, parental socioeconomic status, clinical measures, age at first medication, and medication dose and duration. Age and parental socioeconomic status were used as covariates for all multivariate analyses of covariance (MANCOVAs) and analyses of covariance (ANCOVAs). Volume of the intracranial content was used to control for differences in head size; relative volume was computed for specific regions of interest: relative volume = (region of interest volume/intracranial content volume) × 100. (Testing absolute volumes with the intracranial content as a covariate did not change the results reported.) Tests for group difference in intracranial content were conducted with a one-factor ANCOVA.
A hierarchical testing strategy was used. The primary analysis was a mixed-model MANCOVA (Hotelling-Lawley trace) that used relative volumes and one between-subjects factor, i.e., group (schizophrenic patients, affective disorder patients, and comparison subjects) and three within-subjects factors—subdivision (anterior, posterior), side (left, right), and region (amygdala-hippocampal complex, parahippocampal gyrus, and superior temporal gyrus). This analysis was followed by a three-factor (group, side, and region) MANCOVA for the anterior and posterior regions and a two-factor (group and side) MANCOVA for each region (amygdala-hippocampal complex, parahippocampal gyrus, and superior temporal gyrus). Additionally, follow-up analysis included one-factor ANCOVA and post hoc Tukey’s honestly significant difference tests for individual regions with left and right separately. Results were considered significant at p<0.05. A paired t test was used to assess asymmetry between left and right volumes. The results did not change when the four patients with delayed MRI acquisition or the two patients with major depression were excluded.
RESULTS
Demographic information for each group is summarized in
table 1. There were no significant group differences in age, nor were there significant differences between the schizophrenic and affective disorder patients on any of the clinical scale measures, age at first medication, or medication dose or duration. The patients with first-episode schizophrenia showed significantly lower socioeconomic status than the comparison subjects, consistent with lower premorbid functioning. Parental socioeconomic status was upper middle class or above for all groups, but the schizophrenic group had lower parental socioeconomic status than the comparison subjects. Age and parental socioeconomic status were used as covariates for all MANCOVAs and ANCOVAs. The patients’ total score on the BPRS, age at first medication, and duration of medication did not correlate with the volume of any temporal lobe region of interest. There was no significant difference in intracranial content volume among the three groups.
A three-dimensional reconstruction of the cortex to show the anterior and posterior superior temporal gyrus is presented in
figure 1B. Figure 1 also shows top-down views of the medial temporal structures (amygdala-hippocampal complex and parahippocampal gyrus,
figure 1C) and the superior temporal gyrus (
figure 1D).
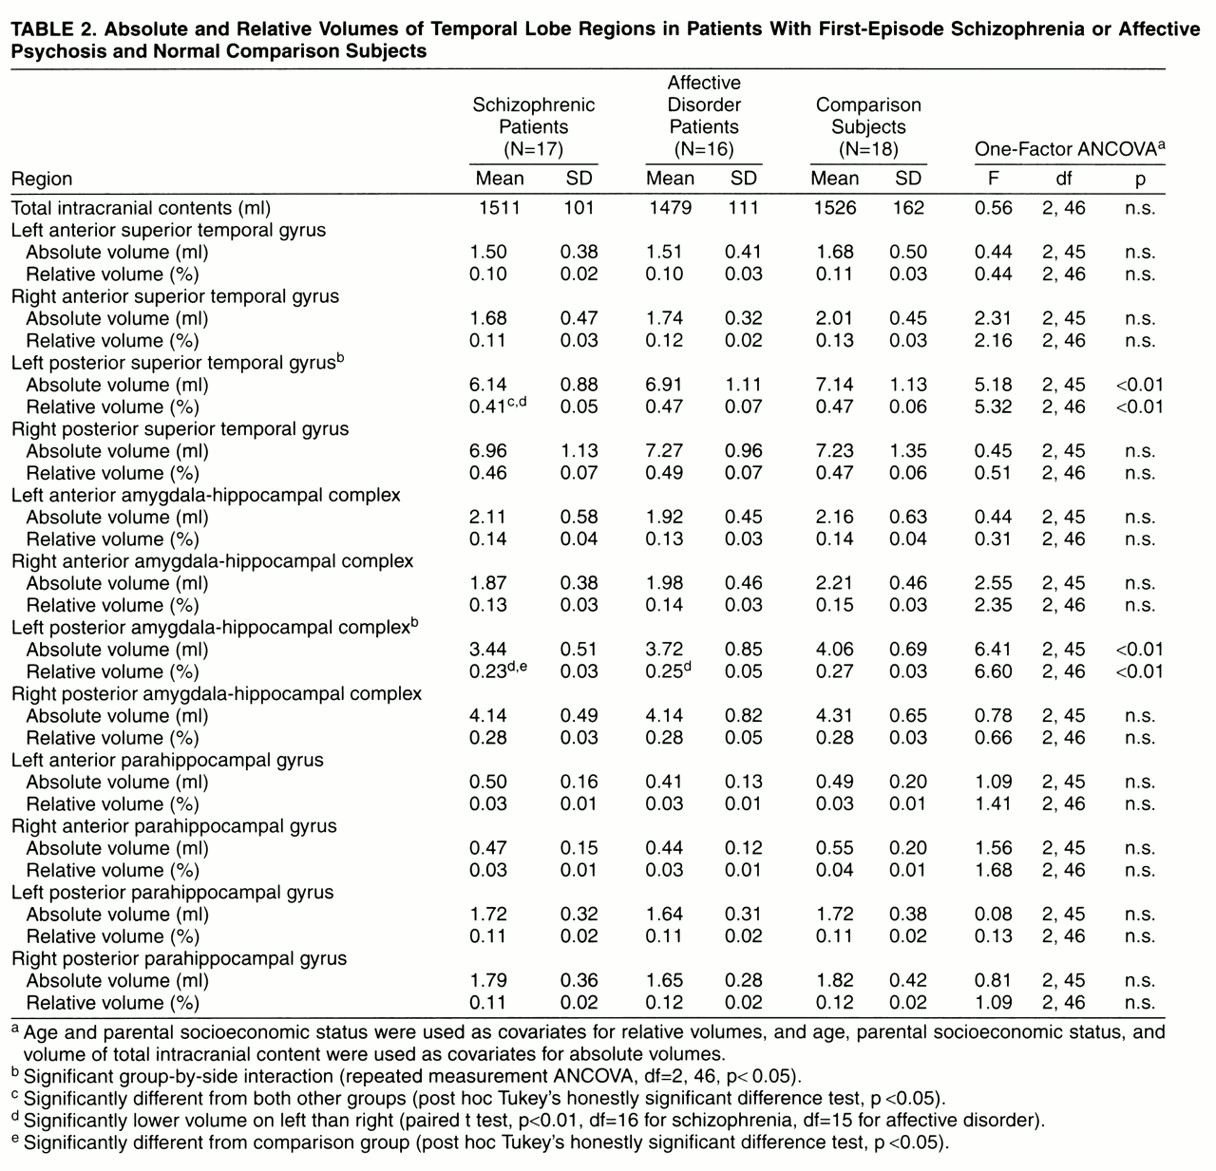
MANCOVA revealed a significant group-by-subdivision-by-side-by-region interaction (F=3.71, df=4, 88, p<0.01). Follow-up three-factor MANCOVA showed a significant group-by-side-by-region interaction in posterior, but not anterior, regions (F=4.07, df=4, 88, p<0.01). Two-factor MANCOVA for each posterior region revealed a significant interaction between group and side in the posterior superior temporal gyrus (F=3.40, df=2, 46, p=0.04) and posterior amygdala-hippocampal complex (F=4.12, df=2, 46, p=0.02).
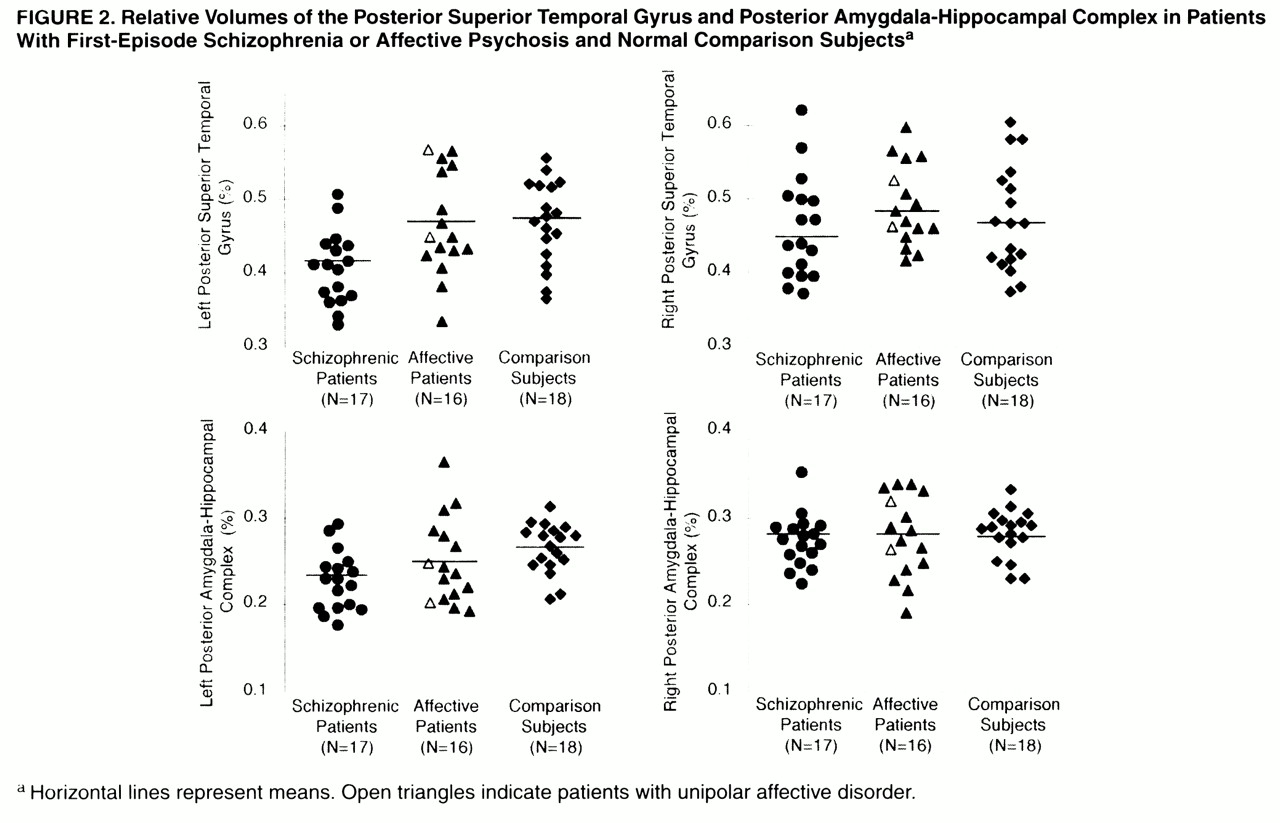
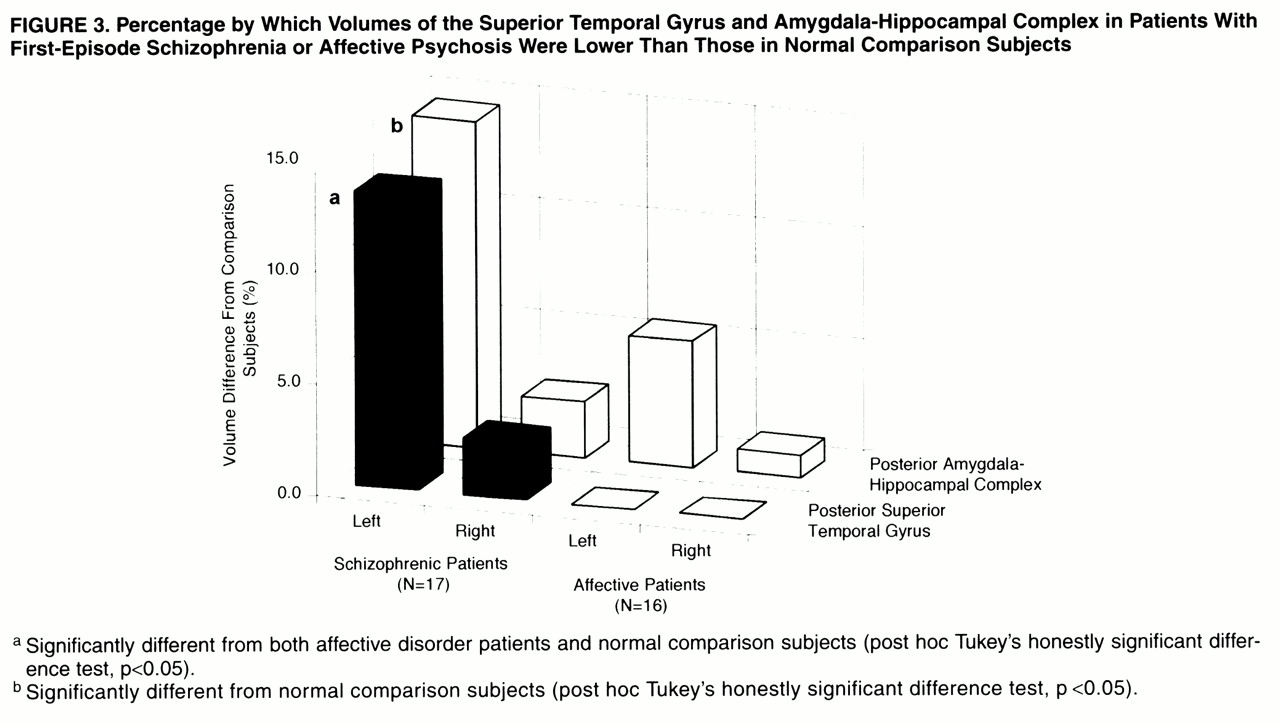
One-factor ANCOVA revealed significant group differences in relative volume in the left posterior amygdala-hippocampal complex (F=6.60, df=2, 46, p<0.01); the schizophrenic patients had a smaller volume than the comparison subjects (Tukey’s honestly significant difference test, p<0.05), and the patients with affective disorder did not differ significantly from either of the other groups (
figure 2). The volume of the left posterior superior temporal gyrus differed among groups (F=5.32, df=2, 46, p<0.01), and the schizophrenic group had a significantly smaller volume than the comparison subjects or patients with affective disorder (Tukey’s honestly significant difference test, p<0.05). The schizophrenic patients showed a 13% smaller volume of the left posterior superior temporal gyrus and a nearly 15% smaller left posterior amygdala-hippocampal complex than the comparison subjects (
figure 3). The absolute and relative gray matter volumes for each region of interest are presented in
table 2. Paired t tests indicated that the schizophrenic patients had significant left-less-than-right asymmetry in the posterior superior temporal gyrus (t=–3.70, df=16, p<0.01) and posterior amygdala-hippocampal complex (t=–7.08, df=16, p<0.01). The patients with affective psychosis showed significant left-less-than-right asymmetry only in the posterior amygdala-hippocampal complex (t=–3.24, df=15, p<0.01). No left-right asymmetry was found in the comparison subjects.
Discussion
The gray matter volume of the left posterior superior temporal gyrus in the patients with first-episode schizophrenia was lower than that in the patients with first-episode affective psychosis or the normal comparison subjects; the volume did not significantly differ between the last two groups. The gray matter volume of the left posterior amygdala-hippocampal complex was lower in the schizophrenic patients than in the comparison subjects but not lower than that in the affective psychosis patients. There was a left-less-than-right asymmetry in the posterior superior temporal gyrus in the patients with first-episode schizophrenia, consistent with findings of Pearlson et al.
(32) and Shenton et al.
(10) for patients with chronic schizophrenia. These findings suggest that temporal lobe structural abnormalities are present at the time of first hospitalization for schizophrenia and hence are not secondary to factors of prolonged, chronic illness. They further suggest that low gray matter volume in the left posterior superior temporal gyrus is specific to schizophrenia, as contrasted with affective psychosis.
The low volume in the left posterior amygdala-hippocampal complex in the patients with first-episode schizophrenia is different from our findings in chronic schizophrenia
(10) and may be related to differences in study groups. Although most studies have shown that low volume is more prominent in the anterior portion of the amygdala-hippocampal complex
(8), there are several reports of abnormalities in the posterior portion
(6,
33). We did not have sufficient female subjects to rigorously assess gender differences, such as the report by DeLisi et al.
(18) of less than normal asymmetry of the surface of the posterior superior temporal gyrus in female but not male patients. However, the low volume of the left posterior superior temporal gyrus and left posterior amygdala-hippocampal complex in our schizophrenic patients remained significant when only male subjects were included in the analysis. ANCOVA indicated that the statistically significant lower parental socioeconomic status in the schizophrenic group played no role in the volumetric differences observed.
In the present study, an asymmetry in the posterior amygdala-hippocampal complex was the only statistically significant MRI feature differentiating the patients with first-episode affective psychosis and the comparison subjects, although there was a nonsignificantly lower left hippocampal volume in the affective psychosis patients. Sheline et al.
(34) found that elderly subjects with a history of major depression had significantly lower than normal left and right hippocampal volumes with no difference in total cerebral volume. As these and other investigators have noted
(35), it is possible that low hippocampal volume in recurrent depression might be secondary to chronicity factors, such as exposure to high cortisol levels. Pearlson et al.
(32) reported that the left amygdala was smaller than normal and the right anterior superior temporal gyrus larger than normal in bipolar but not in schizophrenia patients. However, most magnetic resonance morphometric studies have generally not shown that patients with affective disorder differ in temporal lobe or medial temporal structures from patients with schizophrenia or normal comparison subjects
(5,
36,
37). Strakowski et al.
(38) reported that patients with first-episode mania had significantly higher third-ventricle volumes, possibly greater lateral-ventricle volumes, and less white matter with relatively more gray matter than comparison subjects, but Strakowski et al. did not study gray matter volumes of the amygdala-hippocampal complex and superior temporal gyrus. In comparing the results of various MRI studies (including the present one), both in schizophrenia and affective disorder, one important possibility behind the differences is that the definitions of anatomical regions may be different. For example, our definitions of medial temporal structures, although constant for our group’s studies, differ from many in the literature, and both the definitions and volumetric assessment of the posterior superior temporal gyrus differ from the surface measurements of the planum temporale described in the literature.
Given the totality of findings for affective disorder, it thus appears that low volume of the left posterior superior temporal gyrus in first-episode patients is the finding that may be most specific to schizophrenia. As we have not studied the frontal or parietal cortex, two other areas possibly implicated in schizophrenic and affective pathology
(8), it is also clear that conclusions drawn here about specificity apply only to the regions we have studied.
The data from the present study emphasize the importance of the superior temporal gyrus, which together with the hippocampus, has been postulated to play an important role in auditory associative memory
(39). Abnormalities in this interconnected neural network might result in difficulties in the storage and retrieval of auditory or language memory, particularly in the language-related domain, for which the left (dominant) posterior superior temporal gyrus is important, and in an inability to maintain a proper gradient of association strength. These abnormalities might be related to the dysfunction of auditory/language associative memory seen in schizophrenia and to the thought disorder
(10). Recently, our group
(40) reported lower left-side P300 event-related potential amplitude in patients with first-episode schizophrenia than in patients with affective psychosis or comparison subjects; the subjects studied were different from those reported here. We are currently examining the association between the temporal region MRI abnormalities reported here and the left temporal scalp region P300 amplitude reduction.
An unresolved but important question is whether the abnormalities seen at the first episode, especially in schizophrenia, progress over time
(41). Conclusions based on the literature are at best equivocal, as some groups have reported abnormalities (e.g., references
13,
14, and
42) but others have not (e.g., reference
43). We consequently plan to do follow-up MRIs on the patients in the present study.
In conclusion, anatomical abnormalities in posterior temporal regions with left-less-than-right asymmetry exist at schizophrenia onset and include the superior temporal gyrus and amygdala-hippocampal complex. A left-less-than-right asymmetry of the amygdala-hippocampal complex is also present in patients with first-episode affective psychosis. Low volume of the left posterior superior temporal gyrus is specific to first-episode schizophrenia and thus may play a crucial role in this disorder.
