In recent years the field of psychiatry has experienced substantial changes in the location, delivery, and financing of mental health services (
1). These changes have occurred within the context of the rapid transformation of the nation's health care delivery system (
2).
In an attempt to provide researchers, policy makers, and clinicians with updated information on psychiatric practice, APA's Office of Research conducted the National Survey of Psychiatric Practice. This article summarizes key findings from that survey. Psychiatrists' demographic characteristics, professional work activities, and patient caseloads are described. The financing of psychiatric care, including patients' primary source of payment, type of health plan, and psychiatrists' source of income, are also identified. Changes and trends in psychiatric practice are discussed where appropriate by comparing findings from the current survey with those of previous national surveys conducted by APA and by the American Medical Association (AMA) (
3–
5).
The National Survey of Psychiatric Practice was conducted in collaboration with the APA Practice Research Network, a new research initiative designed to conduct a variety of health services research studies in the full range of clinical settings (
6). This study was designed to create a scientific baseline for current and future research in psychiatry. It is anticipated that this survey will be conducted again in 1998 and annually thereafter.
METHOD
Source of Data
Data for this study were obtained from the 1996 National Survey of Psychiatric Practice. Selected members of APA were mailed the data collection instrument in May 1996. Psychiatrists were asked questions about their clinical practice, professional activities, and sources of income. Aggregate demographic, diagnostic, and reimbursement information was also collected regarding the patients under their care. Most questions were asked retrospectively about the last typical work week or month (i.e., the last week or month that the psychiatrist worked his or her regularly scheduled hours). The survey instrument was pretested by a group of 23 psychiatrists and mental health professionals involved in clinical practice and health services research. Appropriate revisions were made on the basis of the comments of these individuals. (A copy of the final study instrument is available on request from D.A.Z.)
The demographic and training characteristics of the survey population were obtained from the APA membership database, which represents approximately 85% of all practicing psychiatrists in the United States (
7).
Sampling
The survey sampling frame was taken from the APA membership, which comprised 40,866 members in May 1996. APA members in the following membership status categories were excluded because they had not completed training or they were unlikely to be in active practice in the United States (N=12,790): medical students, members-in-training (residents), corresponding members/fellows (i.e., foreign members), and inactive members/fellows. A random sample of 1,481 APA members was selected from the sampling frame of 28,076. Hispanics, African Americans, and psychiatrists younger than 40 years of age were oversampled to allow for subgroup analyses.
Survey Implementation
An initial mailing was made to the 1,481 psychiatrists in May 1996. Three subsequent mailings were aimed at nonrespondents, and postcard reminders and telephone follow-ups were used to encourage a high response. Incentives in the form of lottery drawings for gift certificates from the American Psychiatric Press, with eligibility contingent on the timely return of surveys, were used.
Response Rate/Responder's Profile
Of 1,481 surveys mailed, 1,076 surveys were returned; 98 of these were returned uncompleted for psychiatrists who had either retired or died. An additional eight surveys were unusable because of illegible or grossly incorrect/invalid data. With the exclusion of these 106 surveys, the effective response rate was 70.5% (970 of 1,375). No major differences were observed between respondents and nonrespondents in terms of demographic and training characteristics.
Data Analysis
To account for the oversampling of younger and minority psychiatrists and to adjust for differences in a few membership variables between sampled and nonsampled APA psychiatrists, a sampling weight was calculated by taking the inverse of the probability of selection based on a logistic regression equation that included the main effects and interaction among these variables (
8,
9). The weight was then standardized to sum to the survey size of 970. The final adjusted sampling weight made the survey respondents similar to the entire population of APA member psychiatrists.
To assess whether survey respondents had comparable practices to those of psychiatrists as a whole, we examined data from the 1996 AMA Masterfile (
5) for physicians who reported that psychiatry was their primary practice specialty (N=37,622). The AMA Masterfile contains information on all physicians (including nonmembers of AMA) who live in the United States.
Trends in psychiatric practice over the past decade were assessed by comparing our findings with the 1982 Professional Activities Survey of APA (
3) (N=19,735) and the 1988–1989 Professional Activities Survey of APA (
4) (N=19,478). These surveys collected information on the professional activities of APA members and a small group of nonmembers active in the practice of psychiatry. National Survey of Psychiatric Practice respondents were compared with Professional Activities Survey respondents across various demographic, training, and practice characteristics. Tests of statistical significance were not performed when comparing findings across these surveys because there were no standard deviations or information on missing data in the published reports (
3,
4).
The SUDAAN software package (
10) was used to accommodate the sampling design and weights for the calculation of all statistics. Summary statistics that describe the psychiatrists' patients represent averages of the percent distribution reported by the psychiatrists. Wald chi-square statistics were used to test for differences in the distribution of categorical variables (
11). Standard errors were used to calculate 99% confidence intervals for percents and means. One-way analysis of variance (ANOVA) was used to test for overall differences in group means when more than two groups were present (
12). Overall F tests are reported; t tests were then used to calculate pairwise comparisons between groups if overall significance was found by using the ANOVA. We also used t tests to detect overall mean differences in comparisons containing only two groups (
13). All statistical tests were two-tailed, and a p value of 0.01 was used to determine significance in order to maintain a reasonable type I error rate as well as to avoid finding statistical significance for clinically trivial differences.
RESULTS
All data reported from the 1996 National Survey of Psychiatric Practice have been weighted to reflect the demographic and practice characteristics of the APA membership. References to APA psychiatrists who participated in this study are not limited to the characteristics of the survey respondents but are generalizable to the APA membership.
Demographic Profile
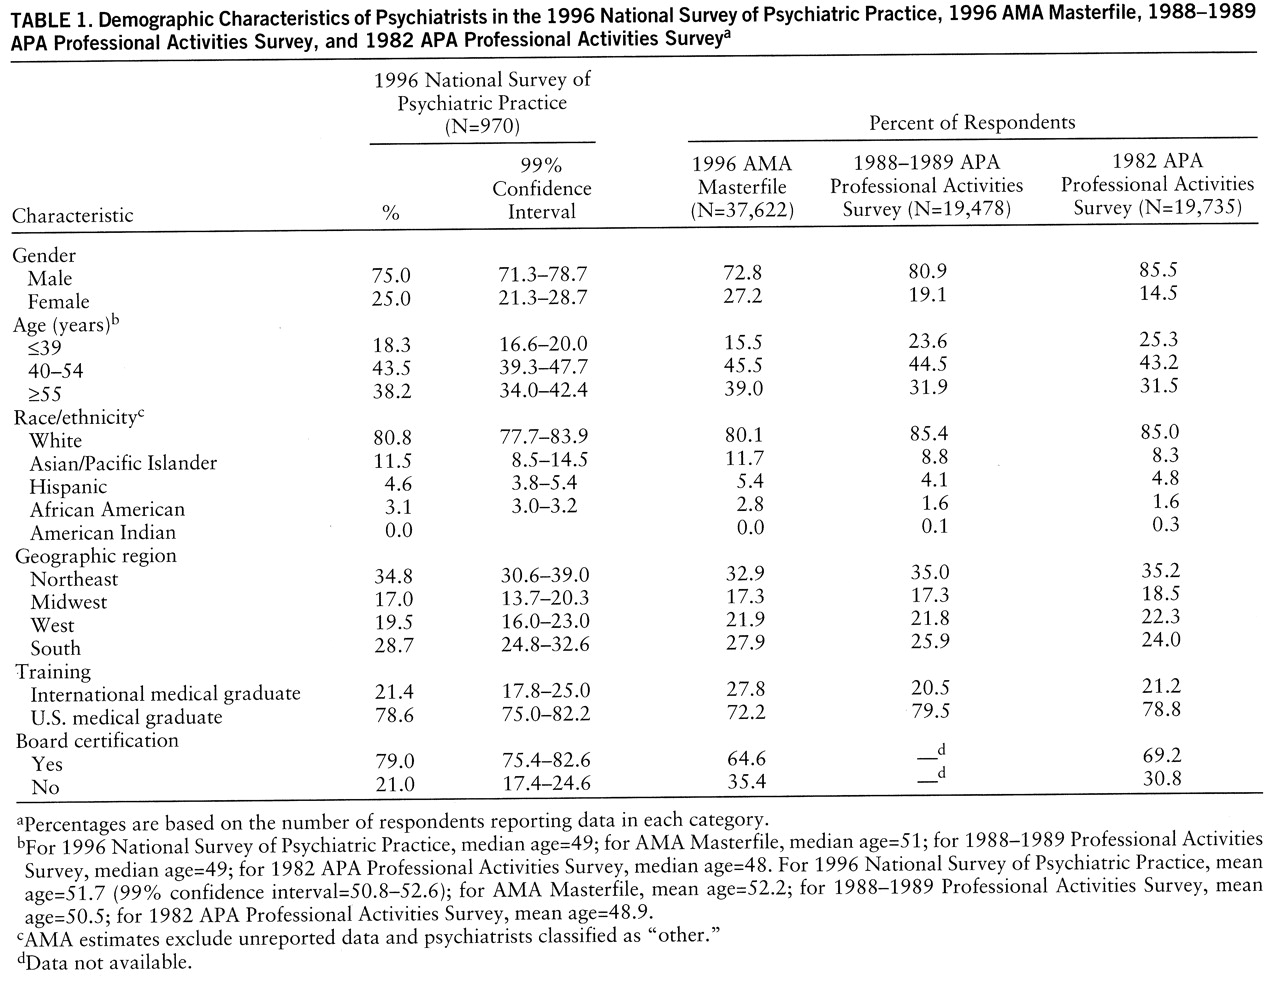
Table 1 compares data on the demographic and training characteristics of APA psychiatrists in 1996 with data on psychiatrists from three other sources: the 1996 AMA Masterfile and the 1988–1989 and 1982 APA Professional Activities Surveys. Compared with the 1996 AMA Masterfile, APA psychiatrists appear to be fairly representative of psychiatry as a whole with the exception of their training background. APA psychiatrists in 1996 were less likely to have graduated from an international medical school and were more likely to be board certified in psychiatry (the AMA Masterfile includes self-designated psychiatrists who may not be board-eligible).
Various changes in the demographic characteristics among psychiatrists in 1996 and respondents to the 1988–1989 and 1982 Professional Activities Surveys were observed. In 1996, 25.0% of psychiatrists were women, compared with 19.1% in 1988–1989 and 14.5% in 1982. There has also been a progressive aging of the workforce and a progressive increase in the proportion of minority psychiatrists.
Professional Work Hours/Activities
Psychiatrists reported seeing, on average, 35.4 unduplicated patients per week (99% confidence interval=33.0–37.8). Male psychiatrists saw an average of 36.6 patients per week, and female psychiatrists saw 31.7 patients per week (t=2.52, df=964, p=0.01). Psychiatrists' caseloads have remained relatively constant since 1982 and 1988–1989, when psychiatrists reported seeing 36.5 and 35.2 patients per week, respectively.
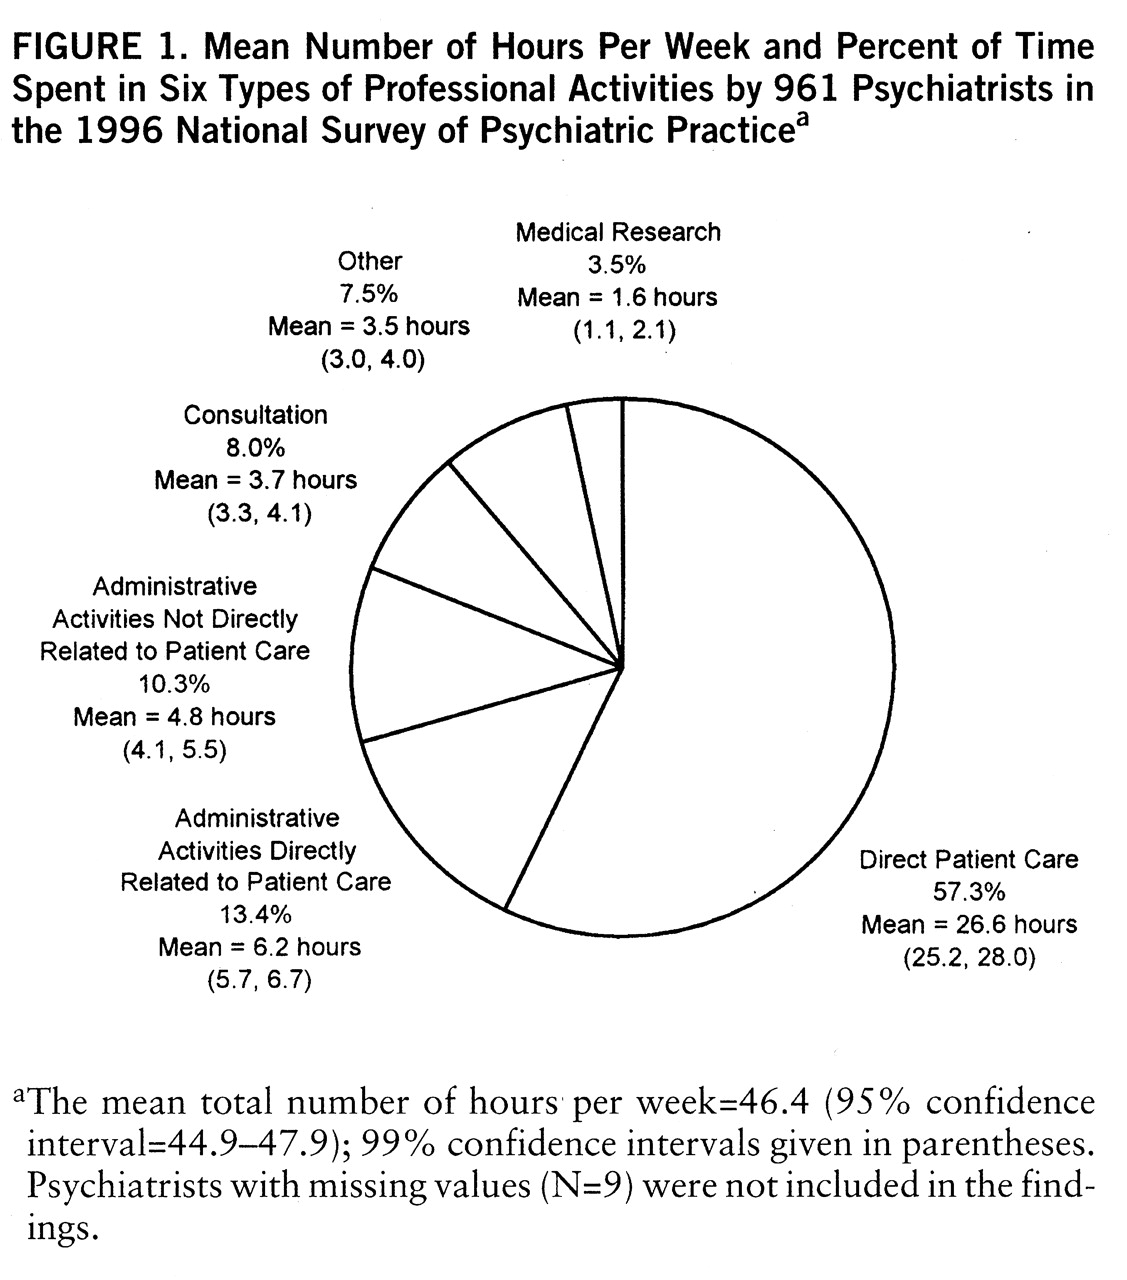
There appears to be a trend toward psychiatrists working fewer hours per week over time. Psychiatrists in 1996 worked an average of 46.4 hours per week (
figure 1), whereas psychiatrists in 1988–1989 and 1982 worked 48.2 hours and 50.5 hours, respectively. Psychiatrists in 1996 spent the greatest number of hours per week in direct patient care (
figure 1). This was followed by administrative activities, of which more than two-fifths was in administrative activities not directly related to patient care. The proportion of National Survey of Psychiatric Practice psychiatrists reporting direct patient care as their primary work activity (i.e., the activity in which a psychiatrist spends the greatest number of his or her professional hours in a typical work week) was 85.8% (99% confidence interval=82.7%–88.9%), compared with 89.6% of psychiatrists in the AMA Masterfile (data not shown).
Practice Setting
Psychiatrists worked on average in 1.8 work settings (99% confidence interval=1.7–1.9), a decline from 1988–1989 and 1982 (2.3 settings for both Professional Activities Surveys). Forty-five percent of psychiatrists (99% confidence interval=40.6%–49.6%) reported working exclusively in one setting in 1996, compared with only 27% in 1988–1989, and 21% of psychiatrists (99% confidence interval=17.0%–24.4%) reported working in three or more settings in 1996, compared with 38% in 1988–1989.
The largest percent of time spent in face-to-face patient care was in solo office practice (
table 2). Public outpatient facilities were a distant second, followed by group office practice and then by hospitals of all types. Regional differences were found in the amount of time psychiatrists spend in solo office practice (F=6.68, df=3,964, p=0.0002), group office practice (F=5.27, df=3,964, p=0.001), and public psychiatric hospitals (F=10.5, df=3,964, p<0.0001) (
table 2).
Fifty-seven percent of psychiatrists (99% confidence interval=52.7%–61.5%) reported having an affiliation with a medical school. Specifically, 34.1% of psychiatrists (99% confidence interval=29.9%–38.3%) served as volunteer clinical faculty, 15.4% (99% confidence interval=12.2%–18.6%) were full-time faculty members, and the remaining 7.6% (99% confidence interval=5.2%–10.0%) were part-time faculty.
Structure of Outpatient Practice
Psychiatrists were asked to characterize the type of individual or multidisciplinary outpatient group practice where they spent the greatest number of hours in outpatient care. Overall, 95.2% of psychiatrists (99% confidence interval=93.2%–97.2%) reported providing some care in an outpatient setting, and 75.4% of psychiatrists' patients (99% confidence interval=72.3%–78.5%) were seen in an outpatient setting.
Fifty percent of psychiatrists (99% confidence interval=45.6%–54.8%) indicated solo office practice as the outpatient setting where they spend the most number of hours, followed by a multidisciplinary mental health group practice (28.1%) (99% confidence interval=24.0%–32.2%), psychiatric group practice (8.8%) (99% confidence interval=6.2%–11.4%), and general medical and mental health group practice (8.1%) (99% confidence interval=5.6%–10.6%). Multidisciplinary group practices had, on average, 4.2 nonpsychiatrist mental health providers (e.g., psychologists, social workers) for every psychiatrist (99% confidence interval=3.0–5.5).
Patient Profile
Psychiatrists reported that 76.7% of their patients (99% confidence interval=74.7%–78.7%) were white non-Hispanic, 14.5% (99% confidence interval=13.0%–16.0%) were African American, and 6.8% (99% confidence interval=5.9%–7.7%) were Hispanic. Although white non-Hispanic patients constituted the majority of patients for psychiatrists of all races, African American and Hispanic patients were the second most commonly seen patients among African American and Hispanic psychiatrists, respectively. Ten percent of patients (99% confidence interval=8.1%–12.1%) were 14 years old or younger, and 14.0% (99% confidence interval=12.4%–15.6%) were older than age 65.
Figure 2 illustrates the primary diagnoses of patients seen by psychiatrists in 1996. Mood disorders represented the most frequent primary diagnoses, followed by anxiety disorders, then by schizophrenia and other psychotic disorders.
Psychiatrists' patient caseloads differed depending on their primary work setting. For example, schizophrenia was the most frequent primary diagnosis in the caseloads of psychiatrists whose primary work setting was an inpatient public facility (29.7%). Mood disorders were the most frequent primary diagnosis in the caseloads of psychiatrists whose primary work setting was a outpatient public facility (29.9%) or an inpatient (37.3%) or outpatient (40.0%) private facility.
Psychiatrists' Financial Arrangements
Psychiatrists' financial arrangements were assessed from three different perspectives: 1) source of payment, or the entity or individual that provides monetary compensation for services; 2) the payment mechanism used to reimburse psychiatrists for the provision of patient care services; and 3) the type of health plan through which patients received services.
The average psychiatrist received 81.2% of his or her professional income from patient care (99% confidence interval=78.4%–84.0%).
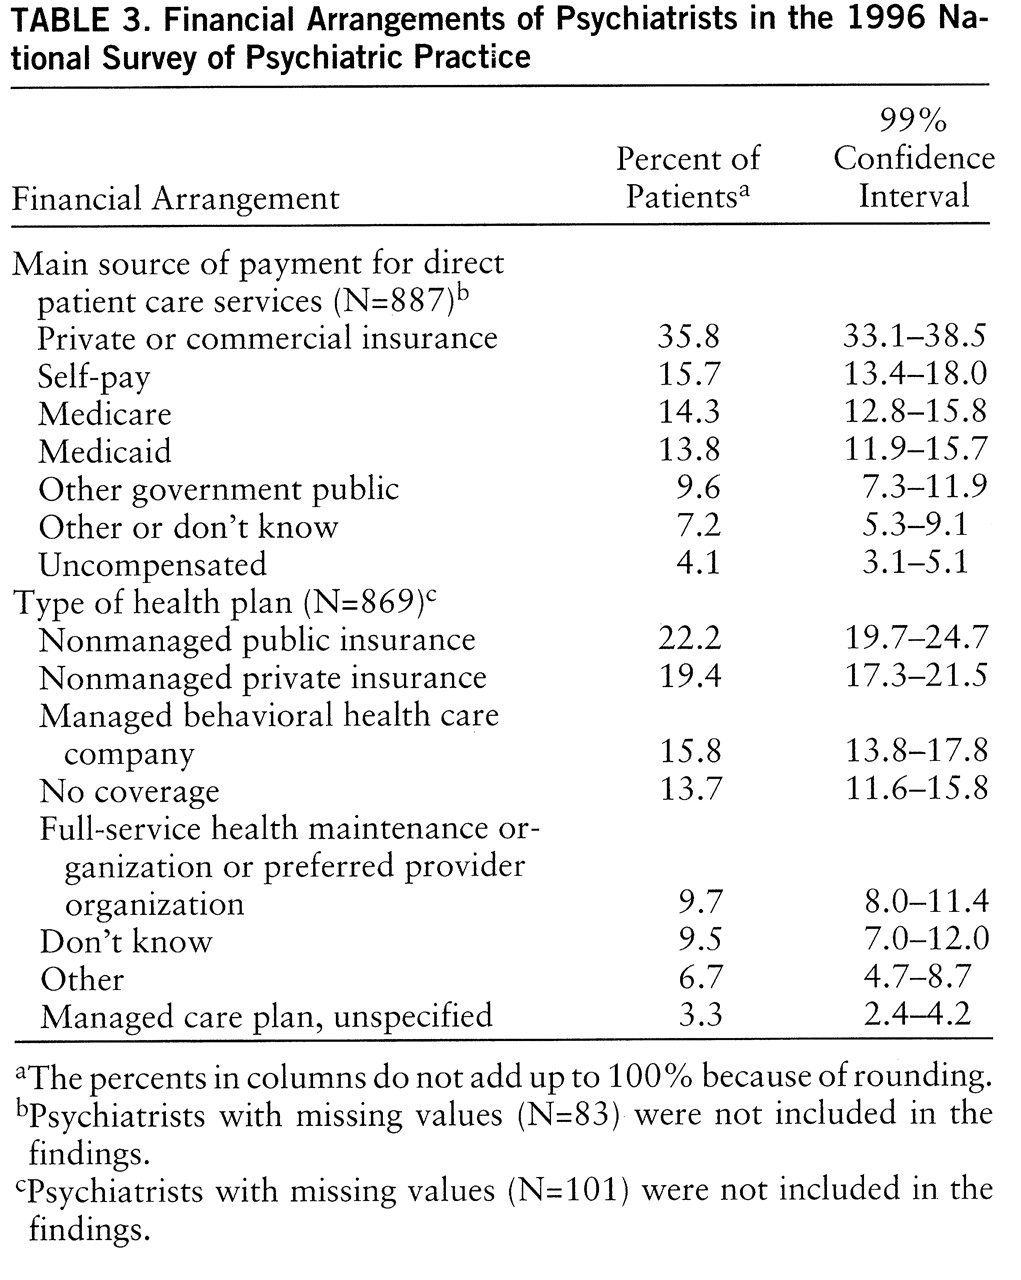
Table 3 shows the sources of payment from which psychiatrists derived their income for direct patient care services. Private commercial insurance was the main source of payment for more than one-third of patients for the average psychiatrist. The second major source was self-pay, followed by Medicare, Medicaid, other government or public insurance, and uncompensated care. In total, public sources of payment and uncompensated care were the main source of payment for 41.8% of patients (99% confidence interval=38.6%–44.8%).
Figure 3 shows the proportion of psychiatrists' direct patient care income derived from different payment mechanisms. Fee-for-service was the primary payment mechanism for psychiatrists' patient care services, accounting for 52.5% of psychiatrists' income from patient care (99% confidence interval=48.3%–56.7%). Nondiscounted fee-for-service made up 28.9% of psychiatrists' direct patient care income, and discounted fee-for-service represented 23.6% (
figure 3). Forty-two percent of psychiatrists' direct patient care income was in the form of a salary, 1.0% was from capitated payments, and 3.5% was from other sources such as a contract or consultation arrangement (
figure 3).
As indicated in
table 3, more than one-fifth of psychiatric patients received care from their psychiatrist through a nonmanaged public system of care. Nonmanaged private health care plans represented the second most common type of health plan used by patients, followed by managed behavioral health care companies, and then by full-service health maintenance organizations (HMOs) or preferred provider organizations. Fourteen percent of care was not covered or reimbursed through any health plan. A portion of these patients may, however, have had some form of health insurance coverage that was not being used. For example, these patients may have exhausted their insured mental health benefits, received treatments not covered by their health insurance, or chosen not to use their health insurance to protect their confidentiality.
In total, 28.8% of psychiatric patients (99% confidence interval=26.1%–31.3%) received their psychiatric treatment through some form of managed care system, and 41.6% (99% confidence interval=38.8%–44.4%) received treatment through a nonmanaged public or private health plan. On average, psychiatrists reported serving on 3.5 managed care panels (99% confidence interval=2.9–4.1). Psychiatrists whose primary work setting was a public facility (inpatient or outpatient) served on the fewest number of panels—1.4 (99% confidence interval=0.7–2.1).
DISCUSSION
Shifts in Demographic Characteristics and Professional Work Activities of Psychiatrists
Shifts in the demographic characteristics of psychiatrists provide a useful context for understanding changes in psychiatrists' professional work activities and practice patterns. Most notable is the continuous increase in the number of women entering psychiatry (
14) (
table 1). From 1978 to 1988–1989, the percent of women in psychiatric residencies increased from 32% to 41% (
15,
16); the percentage has continued to increase to 44% in the 1995–1996 academic year (
17).
The increase in female psychiatrists may help to explain the decrease in the number of work hours observed between 1982 and 1996. In 1996, 62% of female psychiatrists reported working 44 hours or fewer per week, compared with only 38% of male psychiatrists; women averaged a mean number of 42 professional hours in a typical week, compared with 48 hours per week for male psychiatrists (t=4.88, df=964, p<0.0001).
A shift in the age distribution of psychiatrists may also have influenced the decrease in the mean number of hours psychiatrists work per week. Specifically, between 1982 and 1996, there has been an increase in the proportion of psychiatrists 55 years old or older (
table 1). Psychiatrists 55 years old or older work, on average, fewer hours per week than their younger colleagues (43.2 hours versus 48.6 hours, respectively) (t=3.96, df=964, p<0.001). Taken together, the increased proportion of psychiatrists 55 years old or older, and the increased proportion of female psychiatrists, partially explain the drop in the number of hours psychiatrists work per week (
16,
18).
Also of note is the increase in the number of international medical graduates entering psychiatric residencies. In 1990, international medical graduates represented only 21.5% of psychiatric residents, compared with 35.4% in 1995 (
19), and it is estimated that international medical graduates will constitute nearly 50% of first-year psychiatric residents in 1996–1997 (
19). Although the number of residents in psychiatry has remained stable since 1988–1989, concern has been raised over the decreasing numbers of U.S. medical graduates entering psychiatry. Since 1988–1989, there has been a 40% decline in the percent of U.S. medical graduates entering first-year residencies (
19). Furthermore, in 1994, only 3.2% of U.S. medical graduates chose to enter psychiatry—representing the lowest percent since 1929 (
20). Efforts to enhance the recruitment of U.S. medical students are currently underway, but the effectiveness of these efforts has not been determined (
21).
Patient Profile
The race/ethnicity distribution of the psychiatrists' caseloads corresponds roughly to the race/ethnicity distribution in the U.S. population (1990 National Census, available at Internet site http://venus.census.gov/ cdrom/lookup/870898269 as of December 29, 1997). We also observed that, for African American and Hispanic psychiatrists, patients of their same race constituted their second most frequently seen patient. Similar findings were reported in a study of generalist physicians (
22). This could result from psychiatric patients seeking out psychiatrists of their same race, or because minority psychiatrists are more likely to live and practice in geographic areas that have a high minority representation.
Data from the 1996 National Survey of Psychiatric Practice suggest that psychiatrists are treating a higher percent of patients with primary diagnoses of mood disorders than did psychiatrists in the 1982 and 1988–1989 surveys (data not shown). Possible explanations for this apparent increase include the following: 1) there has been an actual increase in the prevalence of mood disorders, 2) patients with mood disorders may be more likely to seek psychiatric care because of greater awareness and availability of treatments for mood disorders, and 3) psychiatrists may have changed their diagnostic patterns (perhaps because of the greater availability of treatments for mood disorders). Given the self-report nature of the study instrument, psychiatrists' estimates regarding patients' primary diagnoses may be subject to inaccuracies caused by imperfect knowledge regarding a patient's complete medical history, including comorbid conditions, or the psychiatrist's use of less stigmatizing diagnoses. However, the exclusive use of confidential research instruments, as opposed to data from administrative billing records, should minimize systematic bias related to perceived stigmatization.
Financial Arrangements of Psychiatrists and Patients
Approximately one-fourth of psychiatric patients received their psychiatric treatment through a managed care delivery system, and two-fifths received care through a nonmanaged public or private health plan. However, these estimates are limited to the degree that psychiatrists are informed concerning their patients' insurance arrangements. For example, psychiatrists may not be aware that some of their patients choose not to use a health plan or insurance coverage to protect themselves against perceived stigma or insurance discrimination. Nonetheless, these results are reflective of the expected increase in the proportion of psychiatrists' patients who receive care through a managed care delivery system as both the private and public sector move in this direction. When this survey was undertaken, an estimated 15% of the individuals receiving Medicaid services were enrolled in prepaid managed care plans, and approximately 11% of Medicare beneficiaries were enrolled in an HMO (
23). In addition, as of September 1995, 45 states have applied for Section 1915(b) Medicaid waivers, enabling them to use HMOs and primary care case management systems for their Medicaid programs. The proportion of public patients enrolled in managed care plans is expected to increase substantially with these changes.
Given these shifts, the relationship of these financing mechanisms to the outcomes of psychiatric care is a critically important area of research. There is some evidence of differential mental health outcomes by type of payment arrangements among patients in the United States (
24). For instance, among psychiatrists' patients with depression, those initially receiving fee-for-service care had better outcomes than those treated in prepaid plans after patient demographics, psychological and physical sickness, and care site had been controlled for (
25). More studies in this area are warranted, for which the APA Practice Research Network offers a unique research vehicle given its access to psychiatrists and their patients in a wide range of clinical practice settings (
6).
Despite the substantial changes in physician payment mechanisms with the dramatic growth of managed care delivery systems (
26,
27), we found that the proportion of psychiatrists' direct patient care income from at-risk capitated payments was only 1%, which is significantly lower than the proportions reported in other national surveys. A recent HMO survey indicated that 30% of all HMOs and 24% of all independent practice associations capitated specialists; however, the survey did not distinguish among types of specialists (
28). The discrepancy between the National Survey of Psychiatric Practice and these other surveys is most likely because of methodological differences in question design and focus. For example, some surveys inquire generally whether a patient is being treated under a capitated arrangement rather than distinguishing whether the psychiatrist is being paid a capitated rate, resulting in significant differences in responses because the capitation may occur at the plan or group level as well as at the physician level (
26).
Limitations in Interpretation and Assessment of Trends
The data presented here, although representative of the clinical practice of APA members, does not necessarily reflect the practice of all psychiatrists in the United States. Respondents resembled nonrespondents in demographic characteristics and training background, but their practice characteristics may still differ because they are not solely determined by these factors.
Comparisons of the demographic characteristics of APA psychiatrists with those of psychiatrists in the AMA Masterfile suggested that these two groups are fairly similar overall (
table 1). However, slight differences in the training background of psychiatrists in the two samples were found. Even though the AMA Masterfile theoretically includes information for all practicing psychiatrists, these physicians have self-designated psychiatry as the medical specialty in which they spend the greatest number of hours. Because these specialty classifications are based solely on the physicians' self-reported practice information, they are not intended to reflect the physicians' specialty training (
29,
30). Therefore, the AMA Masterfile may include some physicians with no specific psychiatric training, while all APA psychiatrists are either board-eligible or board certified.
There were also differences in the sampling frame of the National Survey of Psychiatric Practice survey and the previous APA Professional Activities Surveys cited here. The 1982 and 1988–1989 samples for the Professional Activities Surveys included a small percent of self-identified psychiatrists from the AMA Masterfile. In addition, these surveys removed psychiatrists who identified themselves through the survey as “retired,” while our current survey did not have a specific item questioning respondents about whether they considered themselves retired.
When evaluating changes and trends in psychiatric practice between 1988–1989 and 1996, it should be noted that differences in the survey instrumentation and response categories may present challenges in making direct comparisons. Differences in the phrasing and scope of related questions across the surveys might have resulted in respondents using different approaches to recall, such as enumeration versus estimation, and reporting strategies with varying degrees of accuracy and/or precision. Data on patient characteristics represent average estimates of each variable as reported by the psychiatrists rather than data from a patient sample.
To some extent the 1996 National Survey of Psychiatric Practice was designed as a follow-up to the earlier Professional Activities Surveys. However, key changes were made to the survey instrument given its principal role as the main tool for collecting aggregate practice level data in the recently established APA Practice Research Network. The responses to the 1996 National Survey of Psychiatric Practice will serve as a baseline for subsequent implementation of the survey on a regular basis. These future studies will make it possible to study the changing clinical and practice characteristics of psychiatrists.


