Dysfunction of the prefrontal cortex has been hypothesized to play a central role in the pathophysiology of schizophrenia (
1,
2). Patients with schizophrenia manifest symptoms, especially negative symptoms (i.e., blunted affect, poverty of speech, and loss of volition) and cognitive impairments (i.e., executive and problem solving impairments), that are similar to those observed in nonschizophrenic patients with prefrontal lesions (
3). Various strategies have been employed to examine the role of the prefrontal cortex in schizophrenia, including neurobehavioral, postmortem, functional imaging, and structural imaging techniques. Studies examining the functional integrity of the prefrontal cortex have consistently demonstrated decreased metabolism, decreased blood flow, and impaired function of the prefrontal cortex (
4–
15). These studies have implicated various prefrontal regions, including the dorsolateral (
4,
5), inferior (
6–
10), orbital (
10,
11), and superior/medial (
6,
8,
10,
12) prefrontal regions. However, it is unclear whether these functional abnormalities are related to the presence of structural abnormalities in the prefrontal cortex or represent a secondary consequence to a primary lesion elsewhere in the brain.
The results of postmortem studies are consistent with the possibility of primary structural abnormalities of the prefrontal cortex. Abnormal migration (
16) and altered cell (
17) and interneuronal density (
18) in the dorsolateral and altered interneuronal density in the orbital prefrontal cortex (
19) have been reported in patients with schizophrenia. However, postmortem techniques have not been used to conduct comprehensive examinations of different prefrontal regions; the majority of studies conducted to date have limited their investigation to a single region. There are also limitations in the application of postmortem techniques in the examination of clinicopathological correlations.
Structural imaging techniques, especially magnetic resonance imaging (MRI), provide a methodology for comprehensive structural assessments of the prefrontal cortex in large groups of patients and carefully selected comparison subjects. Moreover, the capability to conduct concurrent and prospective clinical evaluations enhances the ability to examine relationships between structure and behavior. Previous MRI studies of the prefrontal cortex have either failed to demonstrate a difference between patients with schizophrenia and normal control subjects (
20–
23) or found that schizophrenic patients have reduced prefrontal gray and white matter (
24,
25), reduced gray matter (
26–
28), or reduced white matter (
29). The discrepancy among results may be due to differences in image acquisition or analyses or both. In particular, there has been marked variability across studies in scanner magnet size (0.5–1.5 T), slice thickness (1.5–10 mm), and the use of contiguous slices or slices with a 2.5-mm gap (
22). Each of these variables may influence the morphological examination of the region of interest. In addition, and perhaps more important, the majority of these studies have failed to take into account the complex structural heterogeneity of the prefrontal cortex (
2). The prefrontal cortex consists of multiple regions that differ in their cytoarchitecture and connectivity (
3). Previous studies have tended to use either arbitrary internal landmarks (e.g., all coronal sections anterior to the genu of the corpus callosum) and measure the prefrontal cortex as if it were a single, homogeneous structure (
20–
22,
24–
26,
28–
30) or region of interest definitions, which fail to fully take into account existing anatomical landmarks (
23,
27).
We have developed a reliable procedure for subdividing the prefrontal cortex into four regions: superior, middle, inferior, and orbital (P.E. Barta et al., unpublished data). The procedure is based on the method described by Rademacher and colleagues (
31) and uses surface sulcal landmarks, information on the functional organization of the brain, and the availability of three-dimensional MRI assessment methodology. The use of surface sulcal landmarks is based on evidence that sulci define gyri which correspond to cytoarchitectonic brain areas and define functionally homogeneous brain regions (
31). The relationship between prefrontal gyri and cytoarchitectonic structure varies with prefrontal region. The inferior (Brodmann areas 44 and 45) prefrontal region defines a relatively cytoarchitectonically homogeneous region, whereas there is considerable cytoarchitectonic overlap between the superior (Brodmann areas 6, 8, 9, 10, 11, and 12) and middle (Brodmann areas 6, 8, 9, 10, and 46) regions (
31–
33). The orbital (Brodmann areas 10, 11, and 47) prefrontal is intermediate with respect to cytoarchitectonic specificity. There is considerably stronger evidence to suggest that each prefrontal region is functionally homogeneous. The most compelling evidence is the unique afferent and efferent connections of each region (
3,
34,
35) and the differential involvement of each region in basal ganglia-thalamocortical neural circuits (
36). The density of interconnections between different cortical and subcortical regions has been hypothesized to be the major determinant of cortical gyral/sulcal pattern (
37). In addition, behavioral studies in animals and humans have demonstrated that specific regions of the prefrontal cortex are uniquely involved in the performance of specific cognitive operations (
38).
In the current study, we applied this technique to 18 patients with schizophrenia and 24 normal control subjects in order to determine whether patients with schizophrenia are characterized by gray matter reductions in specific regions of the prefrontal cortex. We also measured the prefrontal total white matter volume to determine whether we could replicate our earlier report of decreased prefrontal white matter volume in patients with schizophrenia (
29).
METHOD
Subjects
Eighteen patients with schizophrenia were selected from an outpatient research clinic at Johns Hopkins Hospital for entry into the study. All of the patients were assessed with the Structured Clinical Interview for DSM-III-R (SCID) (
39) and met DSM-III-R criteria for schizophrenia. Patients were excluded if they had a history of head injury with loss of consciousness for more than 1 hour, substance abuse within the last 12 months, or any medical illness known to affect brain structure. The 24 normal control subjects were recruited from hospital staff and community volunteers. They were evaluated with the SCID and were excluded if they had a personal or family history of a psychiatric disorder, head injury with loss of consciousness for more than 1 hour, or substance abuse within the last 12 months. All subjects were strongly right-handed (
40). Parental socioeconomic status was assessed by using the Hollingshead criteria (
41).
The project was approved by the Johns Hopkins University institutional review board. The study procedures were fully explained to all subjects, and written informed consent was obtained before entry into the study.
MRI Protocol
The MRI studies were performed on a single 1.5-T General Electric Signa system. The whole brain was evaluated in the coronal plane by using a high-resolution thin spoiled-gradient recall acquisition in the steady-state protocol, with the following imaging parameters: TR=35 msec.; TE=5 msec.; flip angle=45 degrees; number of excitations=1; field of view=24 cm; and a matrix size of 256 by 256, 1.5-mm slice thickness.
Image Processing and Measurement
A detailed description of the image processing procedure and the precise boundaries for each prefrontal region are presented elsewhere (Barta et al., unpublished data). In brief, the individual coronal images are stripped of all nonbrain tissue and are combined to form a three-dimensional representation of the brain. The prefrontal region is subdivided into four regions through use of surface sulcal landmarks (
42) (appendix 1). The four prefrontal regions (and the gyri comprising each region) are superior (superior frontal gyrus and the transverse frontopolar gyri), middle (middle frontal gyrus), inferior (inferior frontal gyrus), and orbital (rectus, orbital, and frontomarginal gyri). Since there is no reliable sulcal boundary between the precentral cortex and the prefrontal region, the superior prefrontal region includes the extension of the superior frontal gyrus into the supplementary motor area, and the middle prefrontal region includes the extension of the middle frontal gyrus into the premotor cortex.
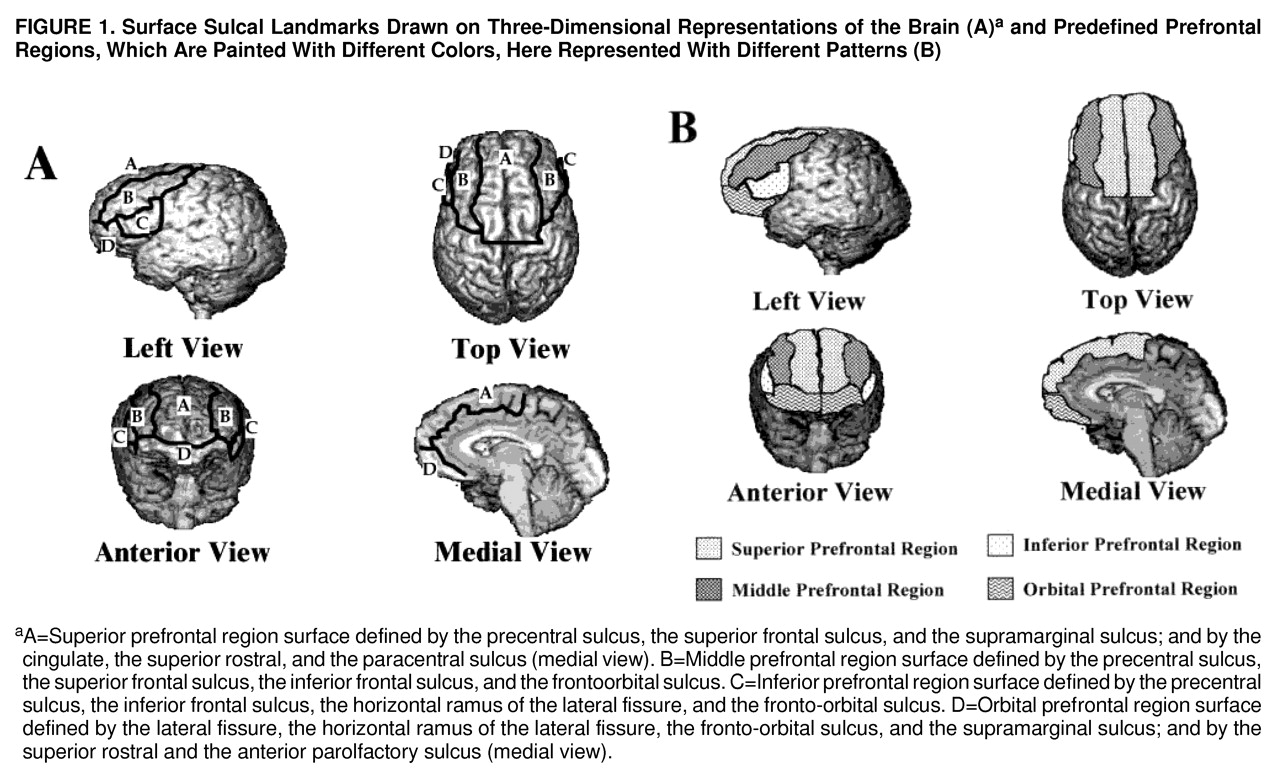
Three sets of orthogonal views of MRI images (coronal, axial, and sagittal) and a three-dimensional representation of the brain are displayed on the computer screen. The surface sulcal landmarks for each region are identified and painted on the three-dimensional representation of the brain (
figure 1A). The orthogonal views and three-dimensional representation of the brain enable the investigator to identify and follow the course of the landmarks over the curvature of the brain (
31). The demarcated regions are then “painted” with different colors, with each paint color defining the set of voxels to be used to calculate the gray and white matter volumes of each prefrontal region (
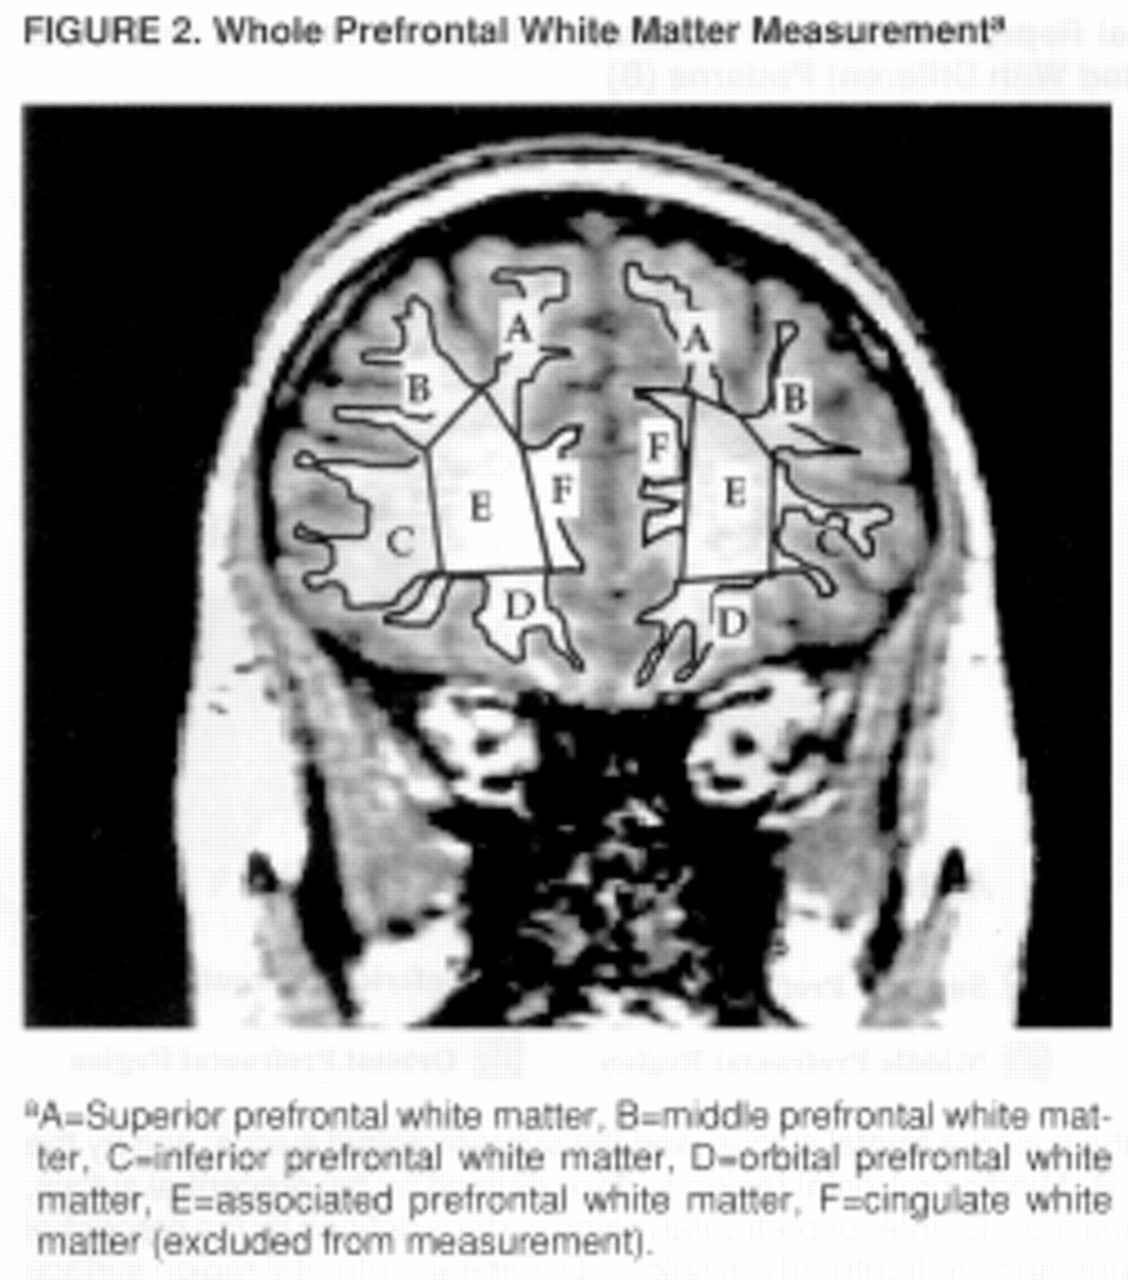
figure 1B). The different paint colors are depicted on each set of orthogonal views. The painted orthogonal views and three-dimensional representation of the brain are used together, in an iterative manner, to identify the voxels of the individual regions. The gray matter of each prefrontal region is composed of the gray matter voxels underlying the paint and along the adjoining gyral wall of the sulci that differentiate each prefrontal region. The prefrontal total gray matter is the sum of the four prefrontal region gray matter volumes. The prefrontal total white matter is composed of the white matter on each coronal slice identified by the surface paint. If gyri represented on a coronal slice are not part of the prefrontal cortex, then the white matter, defined by the cortical strip and a line that connects the apex of each sulcus used to delineate this region from a prefrontal region, is not included in the measurement of prefrontal total white matter volume (
figure 2).
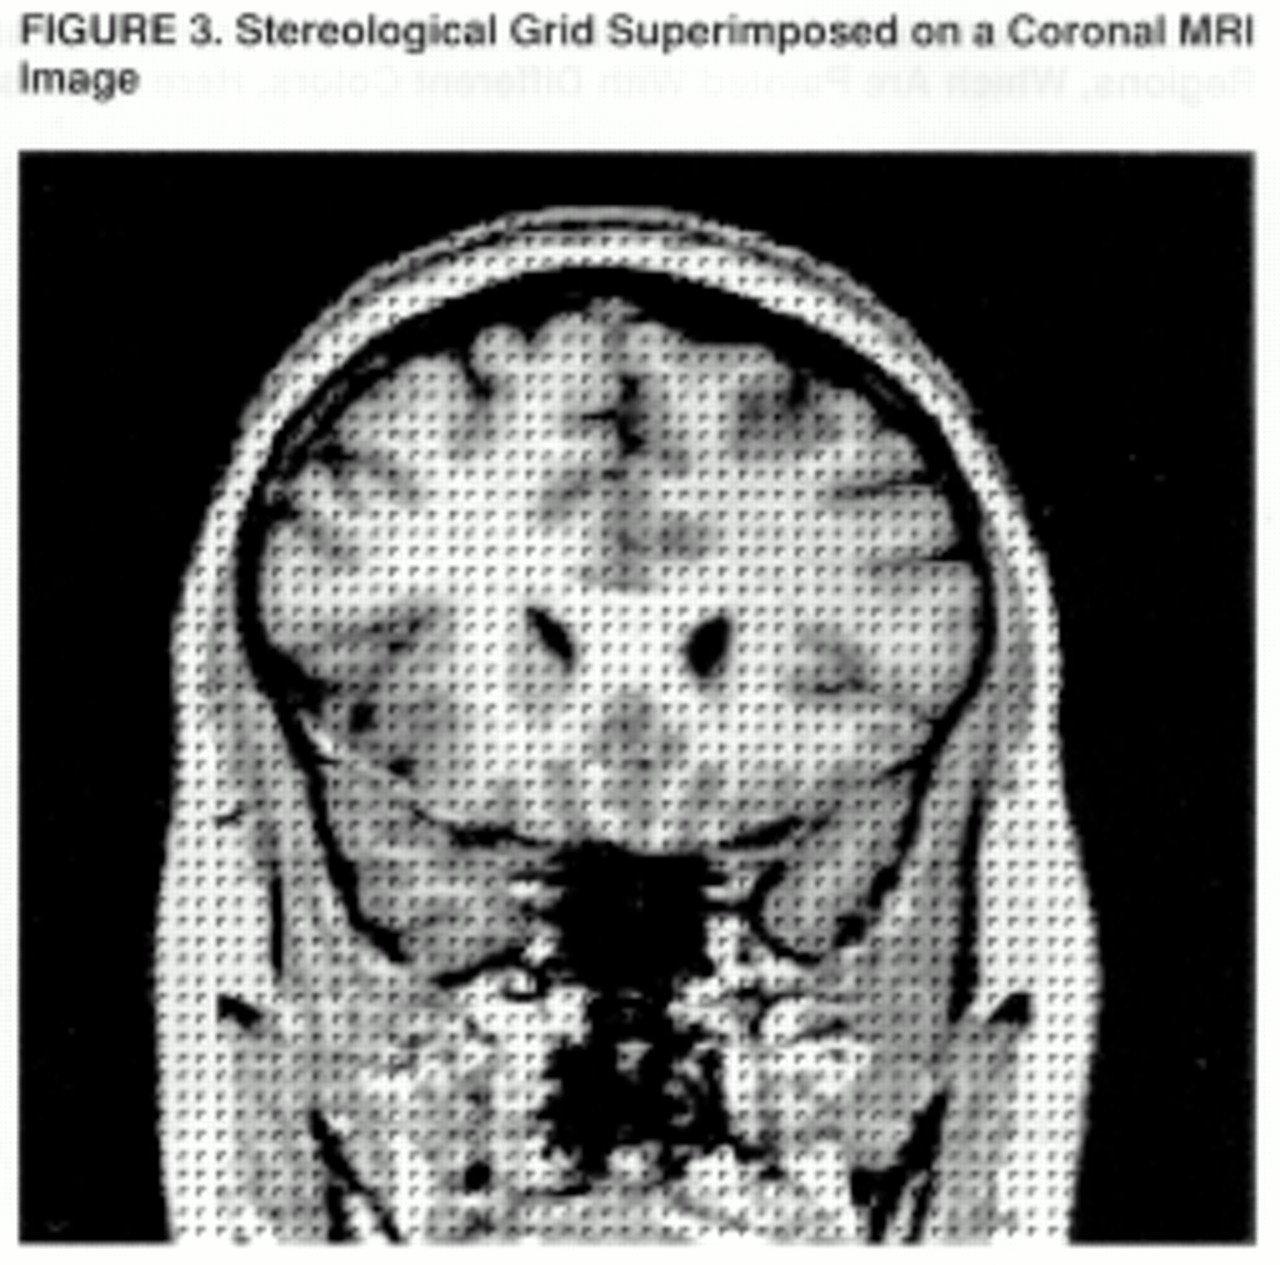
A stereological method is used to count the gray matter and white matter voxels for each of the prefrontal regions (
43,
44). In this method, a three-dimensional grid of predetermined size is superimposed on the MRI images; the individual points of the grid are represented by small rotated “L” shapes (
figure 3). The optimal grid size is based on the Cavalieri principle and is calculated by using the Gundersen formula (
44). Gray matter volume is calculated by counting the number of “Ls” that contain a gray matter voxel along the diagonal defined by the angle of the “L”; white matter volume is calculated by counting the number of remaining “Ls” within the region of interest (
43).
The ability to reliably apply the procedure for parcellating the prefrontal cortex was evaluated by examining the reliability of 1) identifying the sulcal landmarks, 2) using the stereological procedure, and 3) measuring the region volumes. We examined the ability to identify the sulcal surface landmarks by evaluating the extent of agreement between two raters for the seven surface landmarks on the right and left hemisphere in 10 subjects. The 10 subjects were taken from the total group. The extent of agreement, based on visual inspection of the two tracings, was 100%, 90%, or less than 90%. These were defined as follows: 100% agreement—the two raters identified the same sulcus and traced it to the same extent; 90% agreement—the two raters identified the same sulcus, but the extent of overlap was between 90% and 100%; and less than 90% agreement—either the two raters failed to identify the same sulcus or the extent of overlap between the two tracings was less than 90%. There was 100% agreement on 111 (79%), 90% or greater agreement on 20 (14%), and less than 90% agreement on nine (7%) of the 140 landmark ratings. The only sulcus that was rated less than 90% agreement more than once was the right frontomarginal. The interrater reliability for using the stereological procedure to count gray and white matter voxels was based on independent measurement by two raters of 20 regions of interest. The intraclass correlation coefficient was 0.96. The interrater reliability for the volumetric measurement of each of the four prefrontal regions was based on the independent measurement of each region in five brains. The intraclass correlation coefficient for the superior prefrontal region was 0.95; middle prefrontal region, 0.93; inferior prefrontal region, 0.91; and orbital prefrontal region, 0.93.
Statistical Analyses
Three-way repeated measures analyses of variance (ANOVAs), with diagnostic group and gender as the between-groups factors and hemisphere as the within-group factor, were conducted for each of the four prefrontal gray matter regions. The four prefrontal regions were analyzed separately because of the anatomical and functional heterogeneity of the prefrontal cortex and the subsequent possibility that an individual region could be uniquely involved in the pathophysiology of schizophrenia independent of the involvement of any of the other regions. All analyses were two-tailed.
The same ANOVA model was used to examine group differences in total prefrontal volume (gray and white matter) and prefrontal total white matter volume. These analyses were designed to replicate our previous observation of significant reductions in prefrontal total and white matter volumes in patients with schizophrenia (
29). Therefore, because of the hypothesis-testing nature of these analyses, we used the F statistic from the ANOVA to derive a one-tailed t statistic.
If a main effect was observed for diagnosis, then post hoc analyses of covariance (ANCOVAs) were planned to examine the influence of age and total brain volume on observed group differences. In the ANCOVAs, if there were no diagnosis-by-gender interactions, gender was not included as a grouping variable, since total brain volume is highly related to gender (see later discussion) and more directly accounts for the influence of brain size on regional differences than the categorical gender variable. Before conducting any ANCOVAs, we examined each potential covariate to determine whether the variable was significantly associated with the morphological measure and assumptions of homogeneity of regression were met. Only total brain volume met both conditions, and, therefore, only ANCOVAs with total brain volume as a covariate were performed.
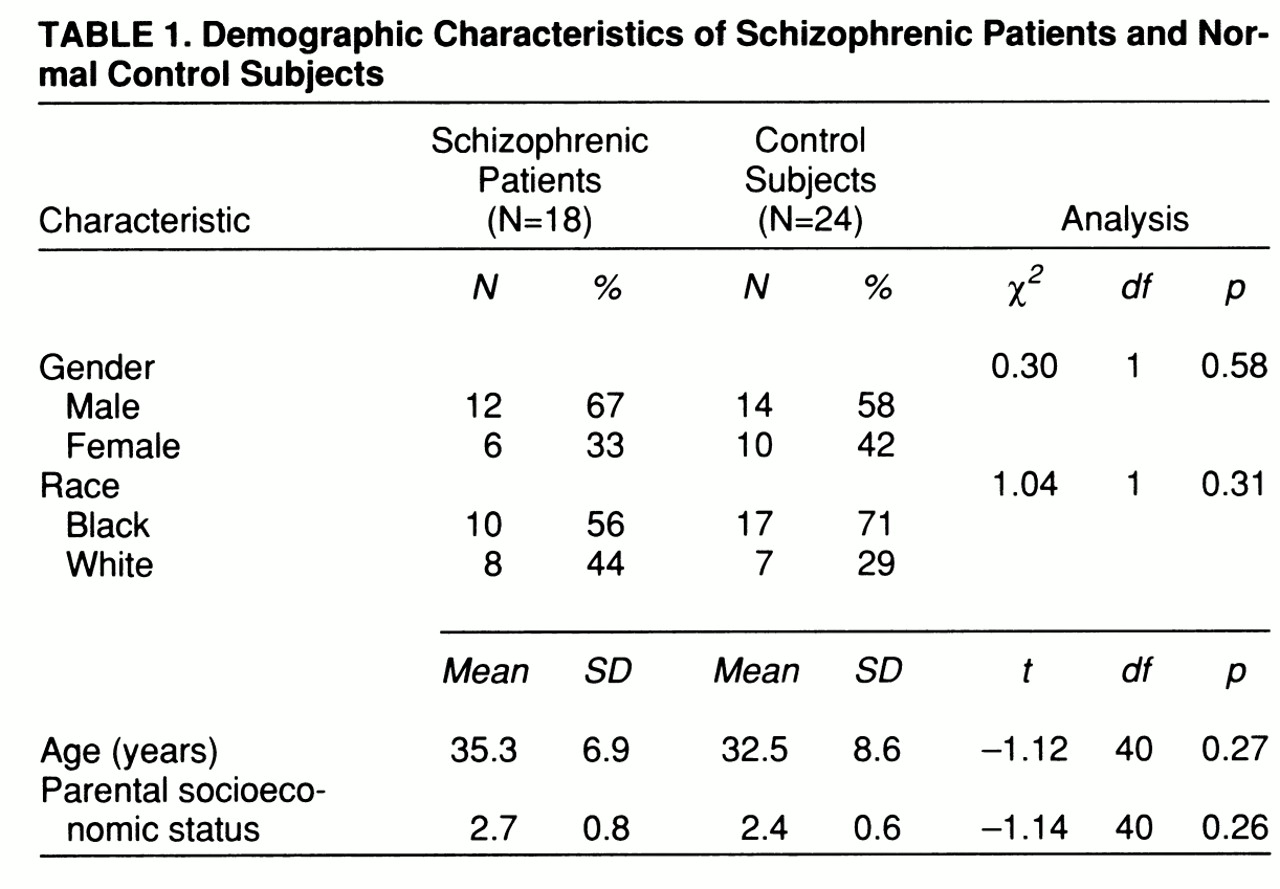
We used t tests or chi-square analyses, as appropriate, to examine group differences on demographic variables.
RESULTS
The demographic characteristics of the study group are presented in
table 1. The two groups did not differ significantly on any of the demographic variables. There was no significant difference between the patients with schizophrenia and the normal control group in total brain volume (F=1.37, df=1,38, p=0.25). There was a main effect for gender for total brain volume (F=13.46, df=1,38, p=0.001), but the diagnosis-by-gender interaction was not significant (F=0.15, df=1,38, p=0.70).
Prefrontal Region Measurements
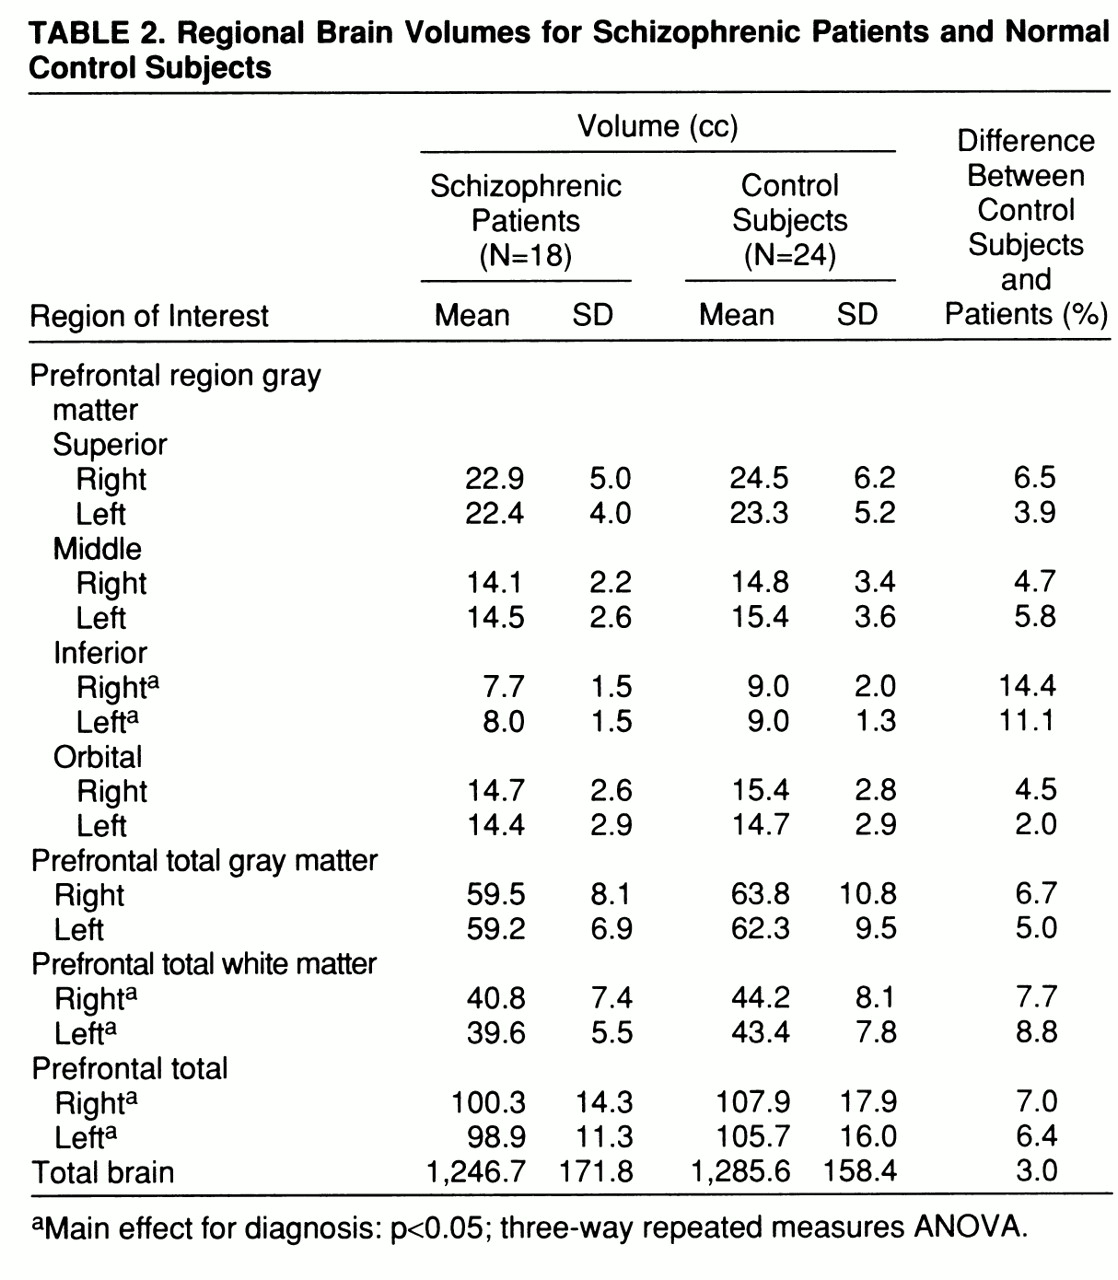
There was a main effect for diagnosis for the inferior prefrontal region (F=5.38, df=1,38, p=0.03). The main effects for gender and hemisphere and the diagnosis-by-gender, diagnosis-by-hemisphere, and diagnosis-by-gender-by-hemisphere interactions for this region were not significant. Post hoc analyses revealed that both the right (F=5.80, df=1,38, p=0.02) and left (F=6.25, df=1,38, p=0.02) inferior prefrontal regions were significantly smaller in patients with schizophrenia (
table 2).
In the ANCOVA, with total brain volume as the covariate, the only grouping variable was diagnosis. Gender was not included as a grouping variable, since the ANOVA failed to reveal a significant main effect for gender or interaction between diagnosis and gender. The addition of total brain volume as a covariate did not alter the observed significant group differences for either the right (F=4.73, df=1,38, p=0.04) or left (F=4.91, df=1,38, p=0.03) inferior prefrontal regions.
The main effects for diagnosis for the three other prefrontal regions were nonsignificant (all F values <1.56, all p values >0.22). The diagnosis-by-gender (all F values <1.18, all p values >0.28), diagnosis-by-hemisphere (all F values <0.45, all p values >0.50), and diagnosis-by-gender-by-hemisphere (all F values <0.95, all p values >0.33) interactions for these regions were not significant.
Prefrontal Total Volume Measurements
There was a significant difference between the schizophrenic and normal control groups in prefrontal total volume (t=1.96, df=38, p=0.03) and prefrontal total white matter volume (t=1.91, df=38, p=0.03). There was a significant main effect for gender for both prefrontal total volume (F=7.44, df=1,38, p=0.01) and prefrontal total white matter volume (F=8.61, df=1,38, p=0.006). The diagnosis-by-gender, diagnosis-by-hemisphere, and diagnosis-by-gender-by-hemisphere interactions for these measures were not significant. Post hoc analyses revealed that both the right (t=1.87, df=38, p=0.04) and left (t=1.90, df=38, p=0.03) prefrontal total volumes and right (t=1.87, df=38, p=0.04) and left (t=1.98, df=38, p=0.03) prefrontal white matter volumes were significantly smaller in patients with schizophrenia (
table 2).
In the ANCOVA, with total brain volume as the covariate, the only grouping variable was diagnosis. Gender was not included as a grouping variable, since, as mentioned earlier, the ANOVAs failed to reveal significant interactions between diagnosis and gender. The addition of total brain volume as a covariate reduced the magnitude of the observed group differences for the right (t=1.46, df=38, p=0.08) and left (t=1.46, df=38, p=0.08) prefrontal total volumes and right (t=1.41, df=38, p=0.08) and left (t=1.54, df=38, p=0.07) prefrontal white matter volumes.
There were no significant differences between the patients with schizophrenia and the control group on either right (F=3.01, df=1,38, p=0.09) or left (F=2.06, df=1,38, p=0.16) prefrontal total gray matter volume. There was a significant main effect for gender for both the right (F=7.55, df=1,38, p=0.009) and left (F=6.49, df=1,38, p=0.02) prefrontal total gray matter volume; the diagnosis-by-gender interactions were not significant.
DISCUSSION
The results of this study suggest that patients with schizophrenia exhibit a relatively selective volumetric reduction of the right and left inferior prefrontal gray matter volume. The involvement of the inferior prefrontal region was observed in the context of no significant group differences in either the right or left prefrontal total gray matter volume and persisted when total brain volume was added as a covariate. Although the number of subjects was small, there was also no evidence to suggest that the observed alteration was influenced by gender. There was no evidence of any abnormal asymmetries or gender and diagnostic group interactions in any of the other prefrontal regions. The selective involvement of the inferior prefrontal region supports the utility of examining individual regions of the prefrontal cortex (
30).
The results of the current study are not directly comparable to the majority of previous MRI studies of the prefrontal cortex, since those studies examined the whole prefrontal cortex and not separate regions. In a preliminary report, Wible and colleagues did measure separate prefrontal regions but failed to find significant selective prefrontal region gray matter volume reductions (
23). Their study differed from the current study with respect to the number of prefrontal regions included in their analyses (they included the cingulate gyrus with the prefrontal cortex), the use of arbitrary landmarks to subdivide gyri that extended across multiple prefrontal regions, and the use of a multivariate rather than univariate statistical model. In contrast to our failure to detect significant differences between schizophrenic patients and normal control subjects in the middle prefrontal region, Schlaepfer and colleagues reported decreased dorsolateral prefrontal gray matter volume (
27). The difference in results may be due to the use of different image measurement procedures. In the Schlaepfer et al. study, regions of interest were approximations and were demarcated on a limited number of transaxial slices, whereas the present method used all relevant slices. The failure to find significant group differences in this region is in contradistinction to positron emission tomography (PET) and single photon emission computed tomography (SPECT) functional imaging studies, which have reported altered metabolism of the dorsolateral prefrontal cortex (
4,
5). There are several possible explanations for this apparent discrepancy. First, altered dorsolateral prefrontal metabolism may be secondary to structural changes that are not detectable by MRI. Second, altered metabolism may be secondary to structural changes elsewhere in the brain. Third, the ability to localize the dorsolateral prefrontal cortex in PET and SPECT studies is relatively limited. Alternatively, we have previously hypothesized that the dorsolateral prefrontal cortex may be selectively involved in the production of deficit symptoms (
45). However, the lack of deficit/nondeficit categorization data precluded our being able to determine whether middle prefrontal region volume reductions were present in a subgroup of patients defined by the deficit syndrome.
The inferior prefrontal region consists primarily of Broca's area. Broca's area includes premotor and heteromodal prefrontal cortex, and has extensive connections with other heteromodal cortical regions, including the dorsolateral prefrontal cortex, inferior parietal cortex, and superior temporal gyrus (
2,
46,
47). Although there is clear evidence of structural and functional involvement of multiple brain regions in patients with schizophrenia (
30), as well as evidence for global gray matter reductions (
26,
28), we have previously hypothesized that schizophrenia may be characterized especially by structural abnormalities in heteromodal neocortical brain regions or in the connections among these regions or both (
2). The observation of decreased volume in the inferior prefrontal region is consistent with this hypothesis. It is also consistent with previous functional imaging studies that have documented altered glucose metabolism or blood flow in this region (
6–
10). Two of these studies have suggested that altered function of the inferior prefrontal cortex may be involved in the production of auditory hallucinations (
7,
9). Alternatively, several studies have demonstrated that patients with schizophrenia exhibit impaired performance on verbal and category fluency; these impairments could potentially be related to the observed decreased volume of the inferior prefrontal region (
13,
48). The lack of neuropsychological characterization of the study subjects precluded our ability to examine these relationships in the current study.
There were significant group differences in prefrontal total (gray and white) and white matter volumes, with patients with schizophrenia having the smaller volumes. The magnitude of the observed group differences were diminished when total brain volume was added as a covariate. The impact of total brain volume may simply reflect that prefrontal total and white matter volumes represent a relatively high proportion of total brain volume and are highly correlated. Alternatively, the impact of total brain volume may reflect a global disease process, which similarly effects both prefrontal total volume and total brain volume. The observations of decreased prefrontal white matter and total volumes were consistent with our earlier assertion that patients with schizophrenia may be characterized by smaller prefrontal cortex and total white matter volumes (
29). The effect sizes for the uncorrected right and left prefrontal total and white matter volumes in the current study ranged from 0.43 to 0.54, whereas in the earlier study they ranged from 0.53 to 0.78. The minor differences in these effect sizes may simply reflect refinements in the MRI procedure and the ability to perform more precise measurements. The lack of control cortical regions precludes a definitive statement about the specificity of the observed reduction.
In summary, we have found evidence for selective decrements in right and left inferior prefrontal gray matter volume in patients with schizophrenia. The development of this procedure will permit future studies to examine prefrontal structure/function relationships. Our future studies will attempt to replicate this observation in an independent sample of patients, who will be characterized according to both their neuropsychological and deficit/nondeficit status.
APPENDIX 1. Anatomical Landmarks for the Prefrontal Cortical Regions of the Brain
Superior/Medial (includes superior frontal gyrus)
Inferior border: superior frontal sulcus
Medial border: cingulate sulcus
Posterior border: precentral sulcus on the lateral surface and paracentral sulcus on the medial surface
Middle/Dorsolateral (includes middle frontal gyrus)
Superior border: superior frontal sulcus
Inferior border: inferior frontal sulcus
Anterior border: superior frontal sulcus merges into frontomarginal sulcus
Posterior border: precentral sulcus (superior plus inferior parts)
Inferior (includes inferior frontal gyrus [Broca's area])
Superior border: inferior frontal sulcus
Inferior border: horizontal ramus of Sylvian fissure/fronto-orbital sulcus (lateral orbital sulcus)/frontomarginal sulcus
Posterior border: precentral sulcus (inferior part)
Orbital
Superior border (going in anterior-posterior direction): horizontal ramus of Sylvian fissure/fronto-orbital sulcus (lateral orbital sulcus)/frontomarginal sulcus
Medial border: superior rostral sulcus (suborbital sulcus) merges into frontomarginal sulcus anteriorly
Posterior border: anterior olfactory sulcus (anterior paraolfactory sulcus) (can be found only on the midsagittal section)
