Caffeine, a member of the methylxanthine family of drugs, is the most widely used psychostimulant in the world (
1). A cup of coffee contains, on average, between 100 mg and 150 mg of caffeine, and since the per capita consumption in the United States is approximately one to two cups a day (
1), it can be estimated that more than 15 billion grams of caffeine are consumed annually in this country alone. Caffeine is 100% bioavailable and absorbed rapidly when taken orally, with a volume of distribution similar to that of total body water (
1,
2). It has approximately a 3- to 8-hour plasma half-life, and brain levels remain stable for at least 1 hour following peak absorption, which occurs within minutes of ingestion (
2,
3). Despite caffeine’s effects on stimulating cerebral metabolism, it also causes substantial and prolonged reductions in cerebral blood flow (CBF) (
4–
7).
Although caffeine is generally thought to provide positive benefits such as enhanced mental alertness, energy, and a sense of well-being, some individuals experience substantial discomfort or anxiety as a consequence of consuming caffeinated beverages or foods (
8). Individuals with anxiety disorders who avoid caffeinated products tend also to be more sensitive to the psychostimulant effects of caffeine (
9–
12). It is unclear whether this reflects primarily a trait characteristic for caffeine intolerance and/or nonspecific arousal in sensitive individuals or the development of caffeine tolerance among those who regularly use caffeine. There is evidence to support a phenomenon of caffeine tolerance or habituation with chronic use, for example, the effects of caffeine on subjective psychostimulation (
13) or sleep latency (
14), although not CBF reduction (
15). There is additional evidence for the occurrence of caffeine dependence, as caffeine discontinuation can produce withdrawal symptoms that tend to occur within 24–48 hours after stopping caffeine and may continue past 7–10 days, with characteristic manifestations of headaches, anxiety, irritability, lethargy, drowsiness, muscle tension, and decreased mental alertness (
16).
The purpose of this study was to characterize brain lactate changes, as a measure of brain metabolic response to acute caffeine ingestion, among caffeine-intolerant individuals who avoid caffeinated substances and among regular caffeine users who experience positive effects from high levels of daily caffeine consumption. Two-dimensional proton echo-planar spectroscopic imaging (
17), a fast gradient recalled spectroscopic imaging technique, was used to measure global and regionally specific lactate levels for an axial section of the brain at baseline and then every 8.5 minutes during 1 hour following caffeine ingestion. It was hypothesized, on the basis of caffeine’s potent effects of both stimulating glycolysis and reducing CBF, that it would increase brain lactate (
18). From what is known regarding brain metabolic mechanisms implicated in anxiety (
18–
21) and observations of greater blood lactate rises in response to caffeine among caffeine-intolerant populations (
22), it was further hypothesized that caffeine-intolerant individuals would exhibit greater increases in regional and global brain lactate in response to caffeine ingestion. A follow-up study of the regular caffeine users, after a 1- to 2-month period of abstinence from caffeine, sought to isolate the effects of loss of caffeine tolerance when those individuals were rechallenged with the same caffeine dose as in their initial study.
METHOD
Nine persons (three female and six male) who underwent caffeine challenge studies were defined as caffeine-intolerant subjects, since they avoided or had discontinued use of caffeinated substances, typically for most of their adult lives (N=5) or during the past approximately 2.75 years (SD=0.67) (N=4), because of precipitation of panic attacks, severe anxiety, restlessness, irritability, and/or uncomfortable autonomic arousal. In comparison, nine caffeine users (three female and six male) who consumed on a regular basis a minimum of three cups of strong coffee per day or the equivalent (typically, five to seven cups per day) without associated problems were studied. The mean age of the caffeine-intolerant group was 31.3 years (SD=6.4), and the mean age of the caffeine-user group was 39.6 years (SD=11.6). Data acquired from an additional caffeine-intolerant subject were discarded because of motion artifact. All subjects gave written informed consent in a manner approved by the University of Washington Institutional Review Board and were screened for contraindications to being in the magnetic resonance imaging (MRI) scanner, including metal implants, pregnancy, and severe claustrophobia. Subjects fasted overnight before the study. All subjects were in good general health, and none was taking medication other than birth control pills or used tobacco on a regular basis. One of the caffeine-intolerant subjects and none of the regular caffeine users met the DSM-IV criteria for panic disorder.
Caffeine citrate (10 mg/kg) mixed in fruit juice was administered orally following baseline proton echo-planar spectroscopic imaging measurements. This dose of caffeine was chosen because it is highly likely to elicit anxiety/panic and physiological arousal in sensitive individuals (
11). The scanning protocol consisted of acquisition of high-resolution localizer images, three baseline spectroscopic images, caffeine ingestion through flexible plastic tubing that allowed the head to remain motionless in the head coil, and six post-caffeine-ingestion spectroscopic images acquired and averaged over 8.5-minute time intervals. At baseline and immediately after completion of the magnet session, subjects’ levels of psychological and physiological symptom severity were recorded with the Acute Panic Inventory (
23).
Eight of the regular caffeine users agreed to stop all caffeinated products and maintain a caffeine-free holiday for a minimum of 4 weeks before undergoing a repeat caffeine challenge. Two subjects were unable to tolerate discontinuation of caffeine, and one subject had difficulties with onset of headaches when caffeine was abruptly stopped, which resolved after substitution of decaffeinated coffee for 1 week. Data from one subject were lost during rechallenge because of scanner malfunction. For the five subjects (four male and one female) with completed studies, the mean duration of the caffeine-free holiday was 37.0 days (SD=11.1, range=27–56).
Imaging
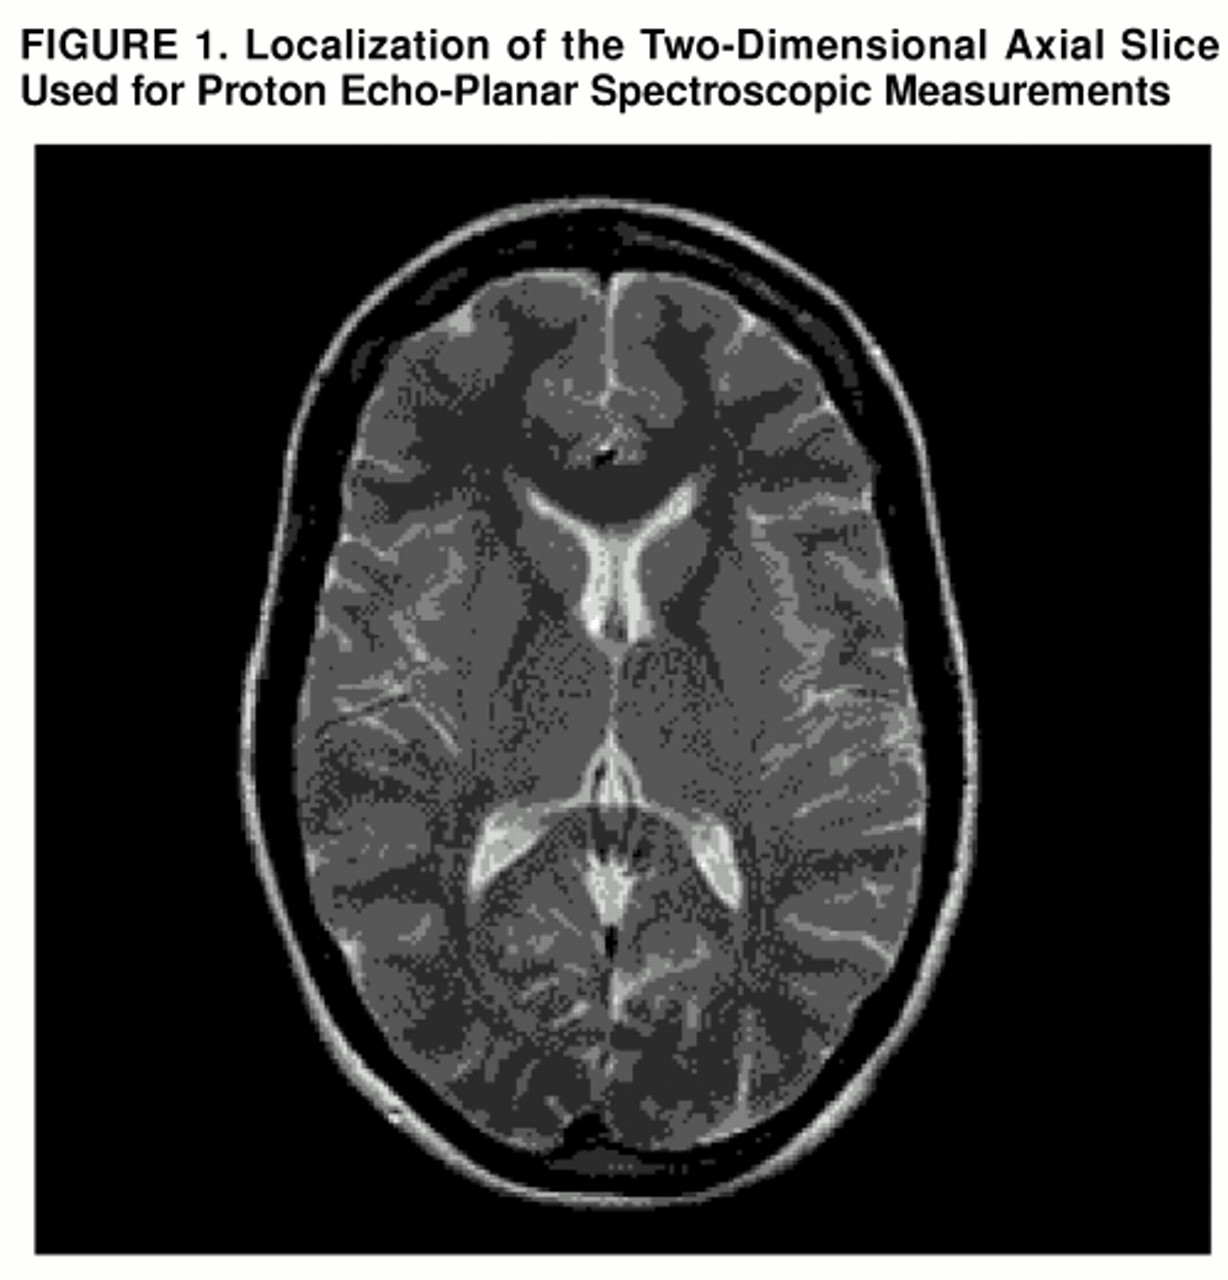
The proton echo-planar spectroscopic imaging studies were performed on a 1.5-T GE Signa scanner (version 5.4 operating system) equipped with a short-bore, linear birdcage coil having approximately √2 improvement in signal-to-noise ratio over standard quadrature coils (C. Hayes, unpublished data). The coil design incorporated a built-in head holder to keep the head fixed in position. High-resolution MRI was used for anatomical localization of a 20-mm two-dimensional axial slice centered at the level of the lateral ventricles (
figure 1). The proton echo-planar spectroscopic imaging pulse sequence consists of three parts: 1) interleaved water and spatial suppression, 2) spin-echo excitation of the slice of interest, and 3) echo-planar spatial/spectral encoding by means of a series of periodic readout gradients to simultaneously encode spectral information and two spatial dimensions, as previously described (
17). The proton echo-planar spectroscopic imaging studies used a repetition time (TR) of 4 seconds to acquire near-relaxed spectra and an echo time (TE) of 272 msec, both to obtain an in-phase doublet of lactate and to minimize residual peripheral lipid resonances; four averages were acquired, with acquisition of partial echoes to permit magnitude reconstruction. Outer volume suppression of lipids was performed by means of a series of eight orthogonal, operator-placed, spatially selective radiofrequency pulses (
17). Measurements were performed with a spatial matrix of 32×32 voxels; 22-cm field of view; 32-kHz spectral width; 16,384 complex data points for frame size (32 spatial points convoluted with 512 spectral points) with a nominal voxel size of 1 cm
3; and spectral resolution of 1.9 Hz per point.
Reconstruction of proton echo-planar spectroscopic metabolic images used raw data traces from individual excitations that were averaged and separate even and odd echo data combined for reconstruction into a three-dimensional matrix (one dimension for spectral encoding and two dimensions for spatial encoding). The spectral dimension was filtered by applying a trapezoidal filter with a ramp width of 50 points on both sides of the 256 complex raw data vector. This filter was used because an almost complete echo was collected in the time domain. A sine-bell function spatial filter was applied in k-space to reduce residual lipid bleed in lactate metabolic images. For N-acetylaspartate (NAA) images, a Gaussian filter was applied with a full width as half maximum of 11 points out of 32 in the spatial domain. Three-dimensional Fourier transformation was performed, and magnitude spectra were computed. For this study, only lactate and NAA metabolic imaging data are reported. Spectra were screened for validity with the use of an automated artificial intelligence method based on metabolite line widths (Strauss et al., manuscript in preparation). Magnetic field inhomogeneity shifts were corrected by setting the maximum point of the NAA peak to 2.0 ppm for each spectrum. Metabolic maps were calculated from the spectral resonances of NAA and lactate by integrating spectral regions that extended 0.09 ppm to the left and to the right side of each resonance.
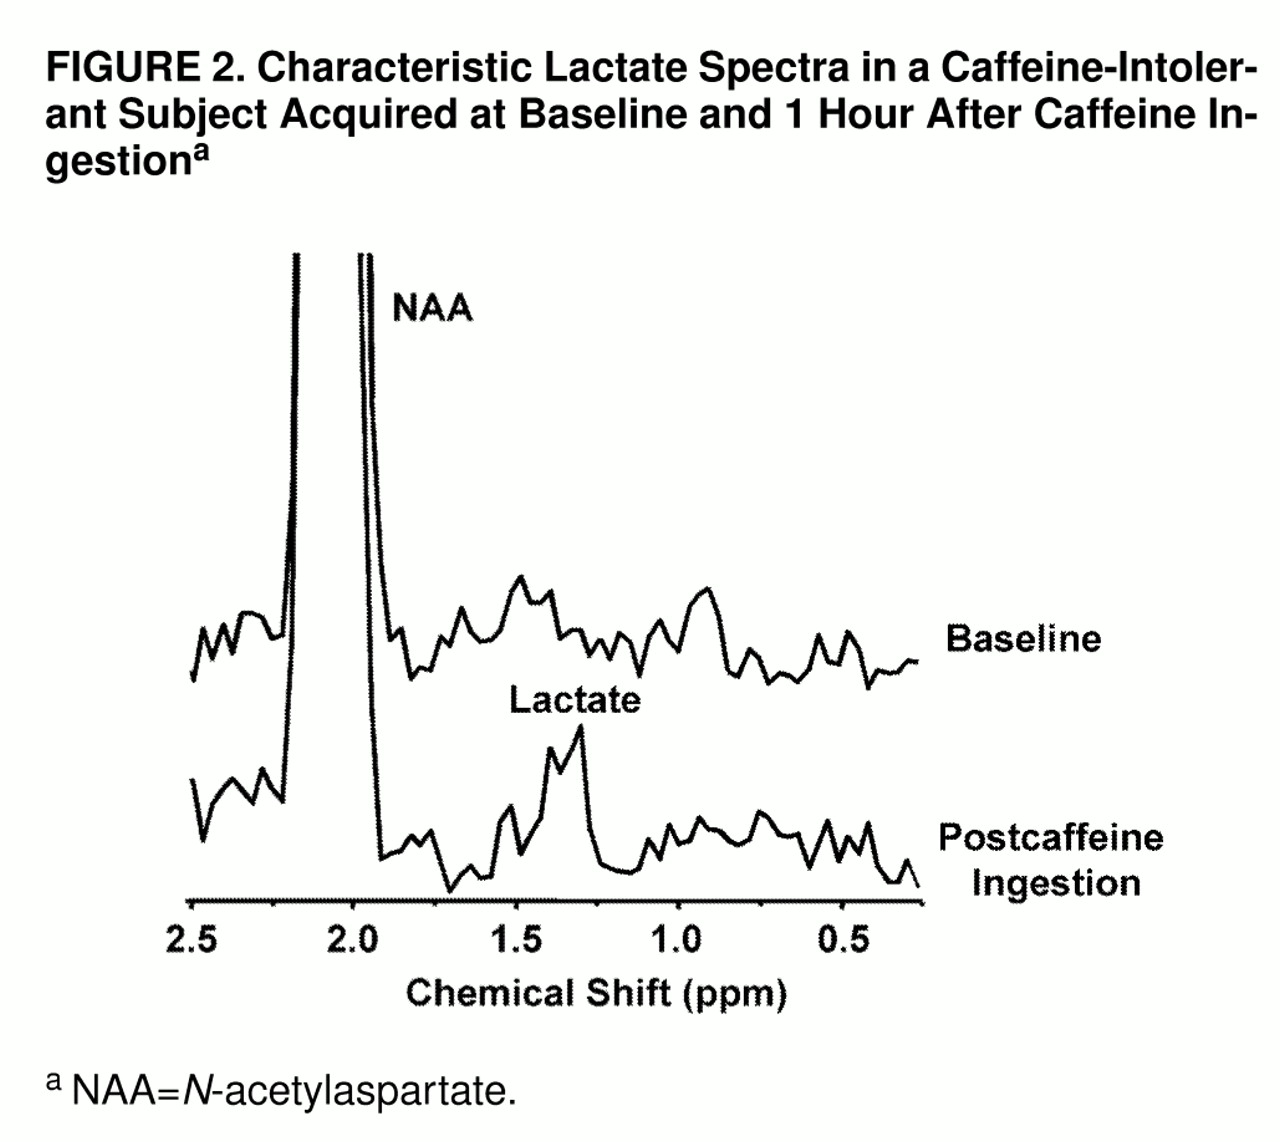
An example of the lactate spectral quality for a lactate-sensitive subject is shown in
figure 2. Shown in
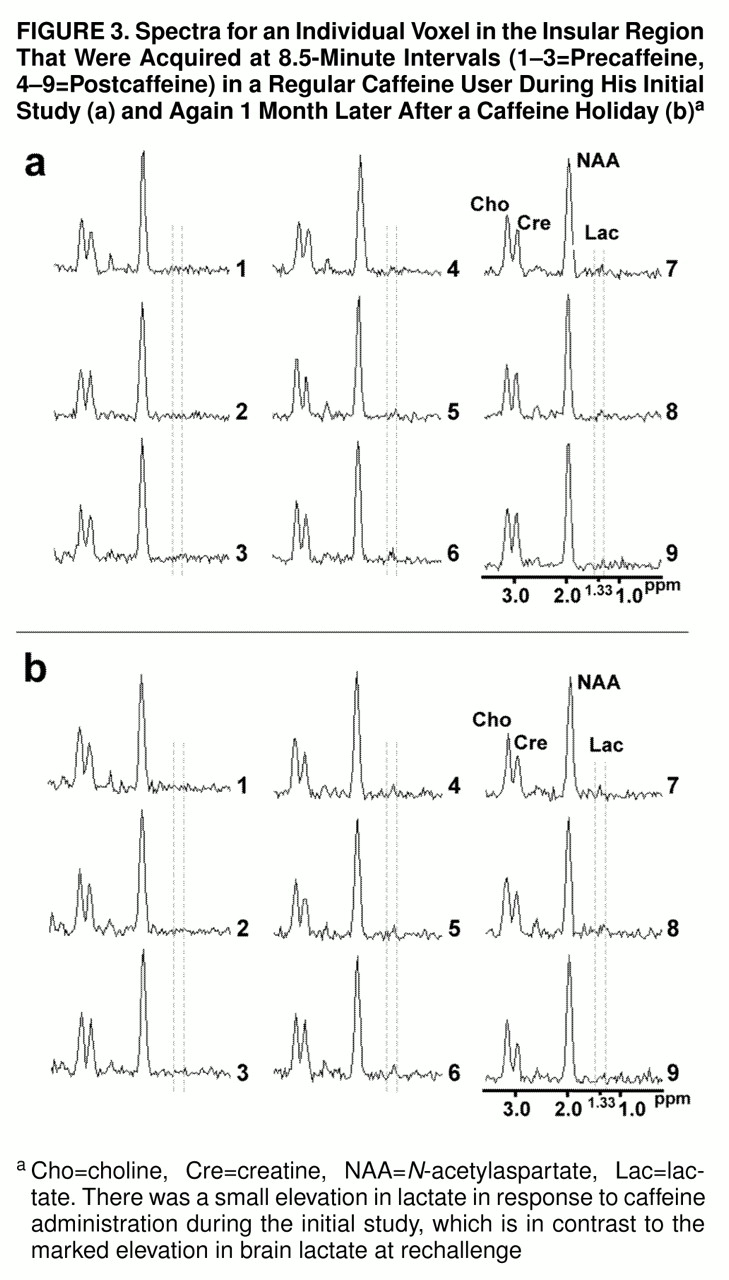
figure 3, parts a and b, respectively, are consecutively acquired individual spectra from the insular cortex region of a regular caffeine user during his initial caffeine challenge study and then 1 month later, after a caffeine holiday, during caffeine rechallenge.
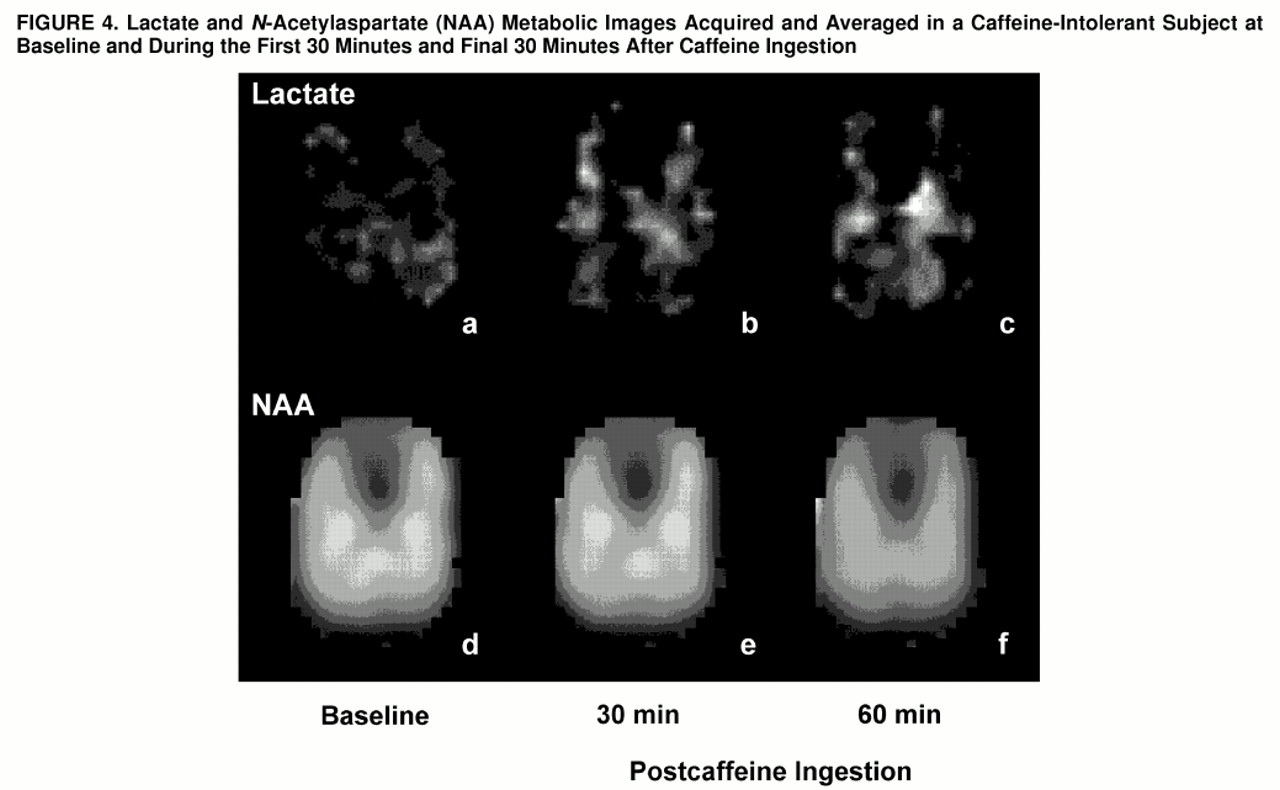
Proton resonances of lactate and NAA were identified and automatically digitally integrated for each subject to produce metabolic maps, as shown in
figure 4. Metabolic images were displayed and quantitated by means of National Institutes of Health Image 1.61 software. Regions of interest were defined from the coregistered metabolic images and high-resolution MRIs by a rater (M.E.L., W.S.) blind to diagnosis and response to caffeine. To evaluate regions of focal brain activation, z score maps for each voxel were created by subtracting the lactate/NAA ratios at each time point from the averaged baseline lactate/NAA ratio, which then was divided by the standard deviation of the lactate/NAA ratio for the averaged baseline.
Lactate levels are reported as a metabolite ratio in comparison with NAA. The NAA spectral peak was used as an internal reference (signal lactate/signal NAA ratio) to standardize lactate measurements for any differences in magnet shimming between studies or for the effects of regional sensitivity differences of the radiofrequency birdcage coil and line broadening due to head movement during a study (
24). Although this approach has certain inherent limitations (
25), it has proven to be useful in previous work, which characterized evolving metabolic conditions in the brain (
17–
20).
Statistical Analysis
Analysis of variance (ANOVA) for repeated measures, with the Greenhouse-Geisser correction, was used to compare changes in brain lactate (signal lactate/signal NAA ratio) for nine time points during the study (three at baseline and six after caffeine ingestion), which allowed comparison over time of the caffeine-intolerant subjects and the regular caffeine users and assessment of the effects of a caffeine holiday on repeat caffeine challenge among the regular caffeine users. Results were further analyzed to assess differences between gray and white matter tissue. For ANOVAs reaching significance, Tukey’s honestly significant difference test was used to further compare changes in signal lactate/signal NAA ratio from baseline in response to caffeine. Although we hypothesized that caffeine increases brain lactate and that caffeine-intolerant subjects would exhibit a greater magnitude of lactate increase, we had no a priori hypothesis for the effects of a caffeine holiday. To be consistent, only two-tailed statistical tests were applied to determine significance at the level of p<0.05.
RESULTS
Eight of the nine caffeine-intolerant subjects reported moderate to marked symptoms of anxiety and physiological arousal, with an increase in mean Acute Panic Inventory score from 2.6 (SD=5.1, maximum=16) at baseline to 20.2 (SD=11.2, maximum=29) at the time of maximum response following caffeine ingestion, whereas only one of the nine regular caffeine users reported mild symptoms of anxiety, with an increase in mean Acute Panic Inventory score from 0.3 (SD=0.5, maximum=1) at baseline to 3.0 (SD=3.2, maximum=10) at the time of maximum symptom intensity following caffeine ingestion. Acute Panic Inventory scores did not differ significantly between groups at baseline by independent t test (t=1.3, df=16), but they became significantly higher among the caffeine-intolerant group following caffeine ingestion (t=4.4, df=16, p<0.001). Symptoms typically occurred within 20 minutes after caffeine ingestion and continued or worsened during the remainder of the study. All subjects completed the protocol except for one regular caffeine user who requested early study discontinuation during the final scanning period because of urinary urgency.
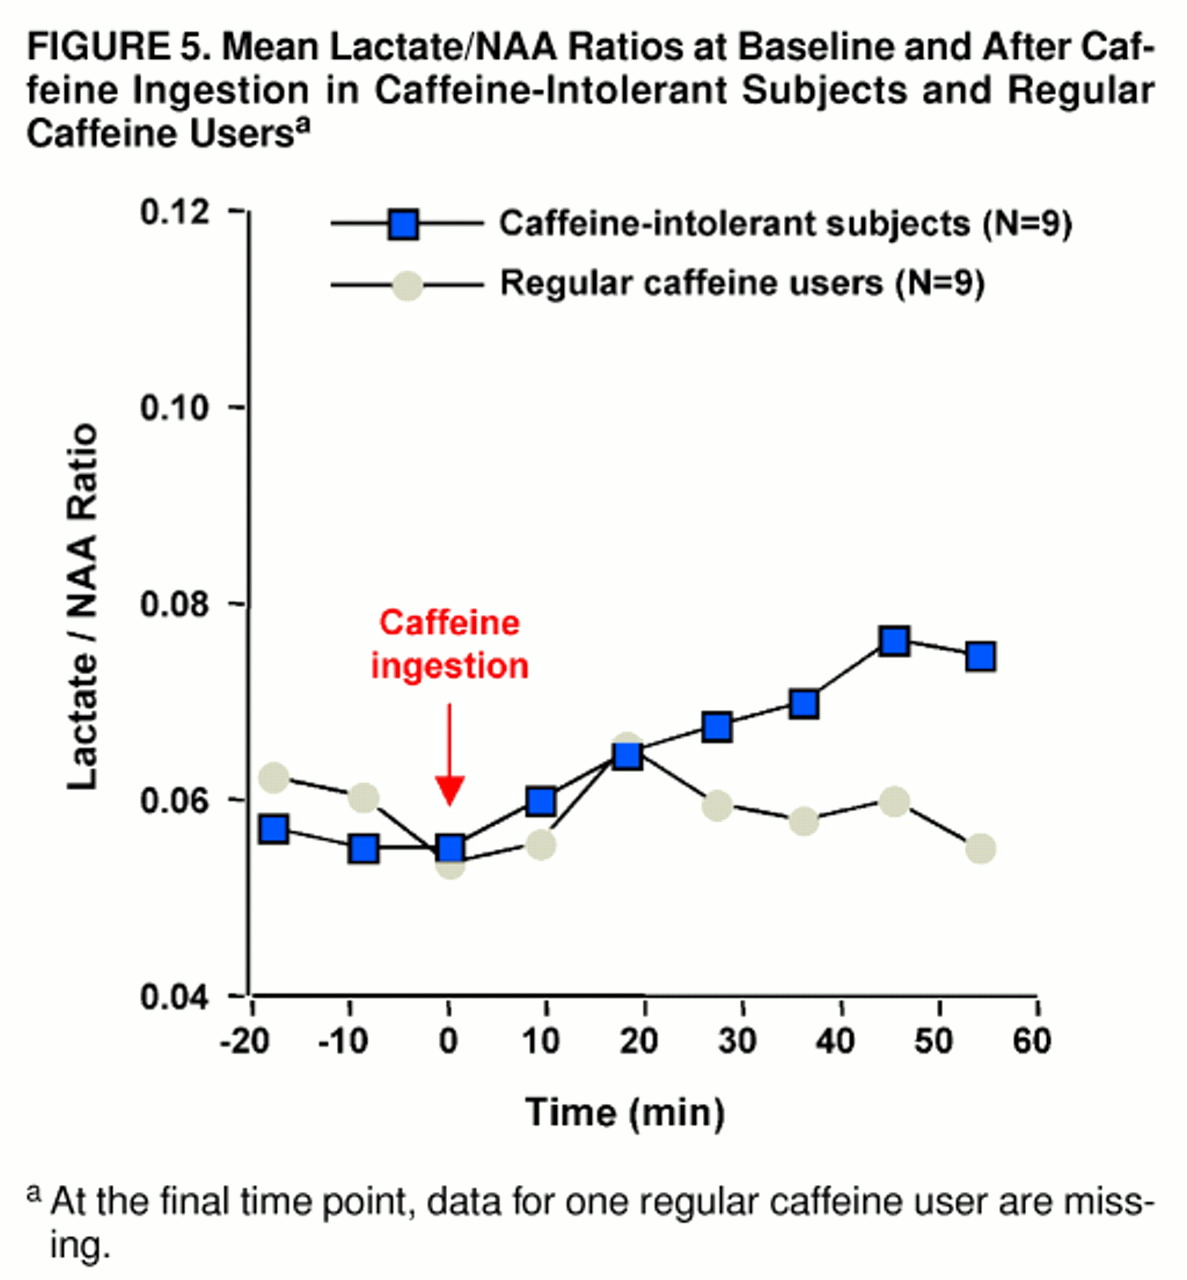
Significant increases in the ratio of brain lactate to NAA occurred subsequent to caffeine ingestion among the caffeine-intolerant subjects (F=5.9, df=8, 64, p<0.004, Greenhouse-Geisser correction: ε=0.371). Tukey’s honestly significant difference test indicated a trend increase in lactate from baseline (defined as scan 3) at the 17-minute time point (p=0.10) and a significant increase at all subsequent intervals (at 25 minutes, p=0.05; at 34, 42, and 51 minutes, all p values=0.01). In contrast, brain lactate/NAA ratios did not significantly increase among the regular caffeine users (F=1.2, df=8, 56, ε=0.441) (
figure 5). When the caffeine-intolerant subjects were compared with the regular caffeine users, no significant between-group main effect was found (F=0.5, df=1, 15), but a group-by-repeated measures interaction was noted (repeated measures main effect: F=3.8, df=8, 136, p<0.01; group-by-repeated measures interaction: F=3.4, df=8, 120, p<0.02, ε=0.424), as shown in
figure 5. For all subjects, raw NAA signal amplitude did not change significantly in response to caffeine ingestion (F=0.2, df=8, 128, ε=0.305).
Bilateral regions containing predominantly gray matter tissue (cingulate, caudate, thalamus, and insular cortex) or white matter tissue (splenium and parietal, temporal, and occipital cortex) were pooled to assess differences between tissue-type metabolic responses to caffeine. There was some evidence for greater overall gray matter lactate levels than white matter lactate levels (F=3.6, df=1, 28, p<0.07), consistent with other studies of relative metabolic rates (
26). No significant between-group tissue differences were shown (F=0.6, df=1, 28), nor were there significant differences in the time course of metabolic response to caffeine (repeated measures main effect: F=1.9, df=8, 256, p=0.07; group-by-repeated measures main effect: F=0.6, df=8, 248, ε=0.602; group-by-gray/white-tissue-by-scan interaction: F=1.4, df=7, 248).
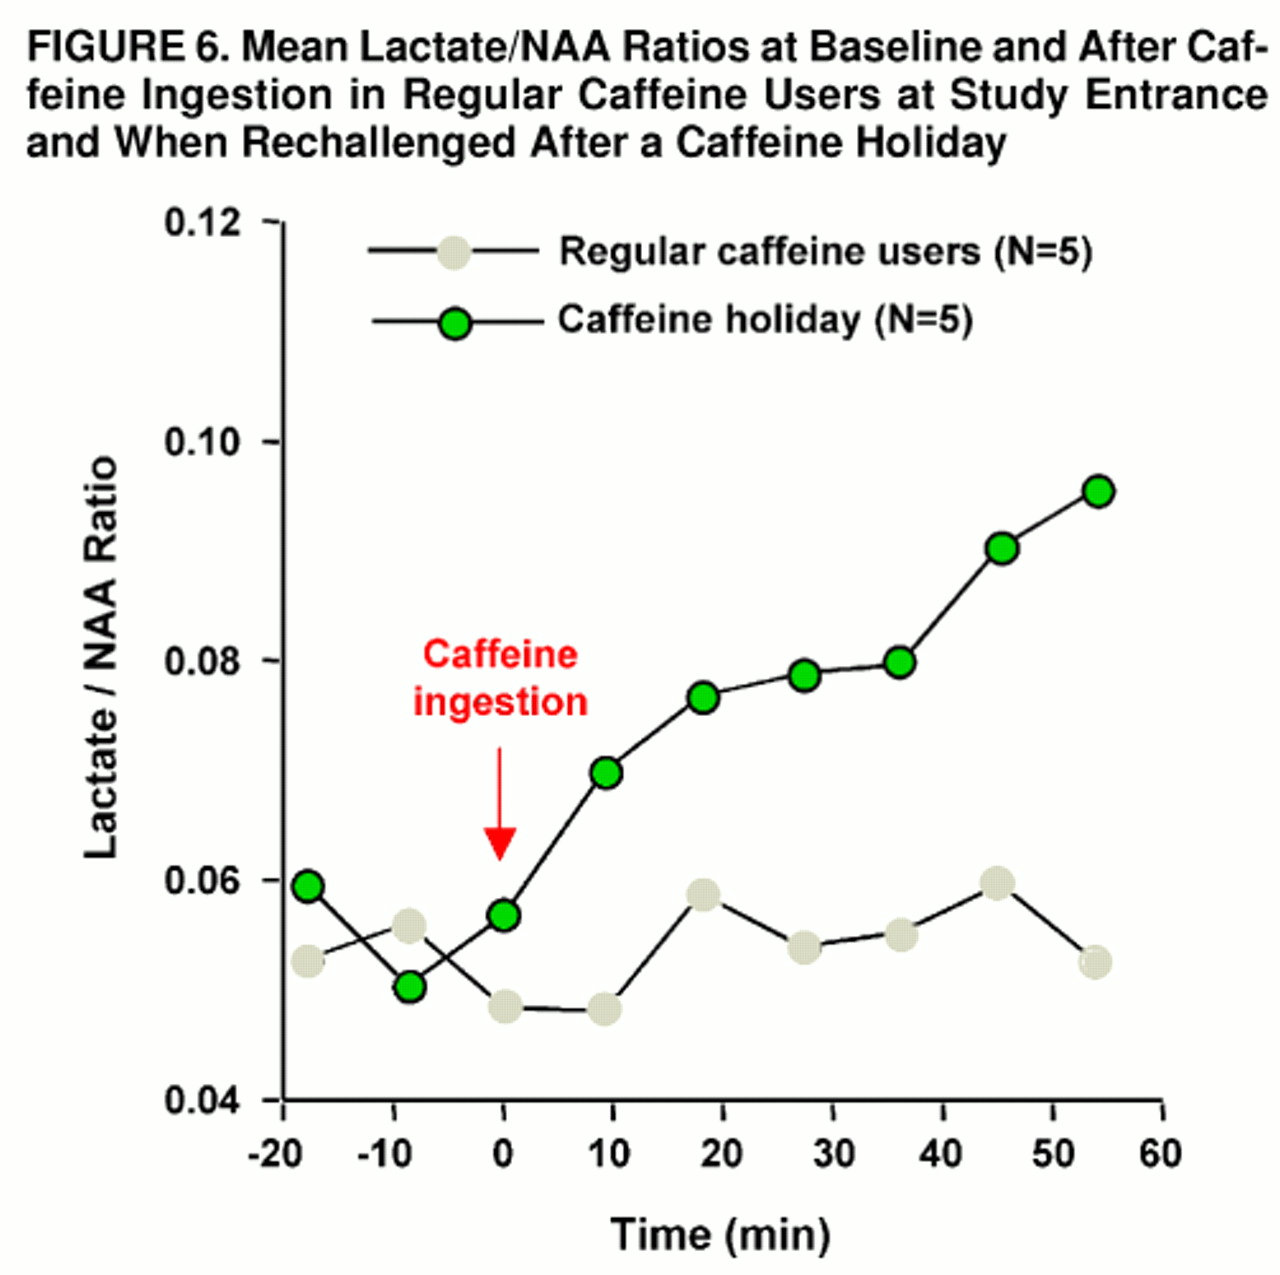
Rechallenge with caffeine following a 4- to 8-week period of caffeine abstinence produced mild anxiety and muscle tension in one of five caffeine-holiday subjects; this occurred within 5 minutes after caffeine ingestion and then quickly dissipated. Mean Acute Panic Inventory scores increased from 0.4 (SD=0.9, maximum=2) at baseline to 3.8 (SD=3.7, maximum=8) at maximal response to caffeine. In comparison with the subjects’ first study, Acute Panic Inventory scores were not significantly different at baseline by paired t test (t=0.5, df=8) or at maximum caffeine response (t=1.3, df=8). Brain lactate significantly increased from baseline after rechallenge with caffeine (F=7.9, df=8, 32, p<0.03, ε=0.177). Significantly greater increases in brain lactate/NAA ratio occurred after rechallenge in comparison with the initial study (group main effect: F=5.7, df=1, 7, p<0.05; repeated measures main effect: F=9.0, df=8, 72, p<0.002; group-by-repeated measures interaction: F=4.7, df=8, 56, p<0.02, ε=0.332). After the caffeine holiday, brain levels of lactate were significantly elevated compared with baseline levels at 17 minutes (scan 5, p=0.05, Tukey’s honestly significant difference) and across all subsequent time points (at 25 and 34 minutes, p=0.05; at 42 and 51 minutes, p=0.01) (
figure 6). In the comparison of the caffeine-holiday subjects with the caffeine-intolerant group, no significant between-group main effect or group-by-repeated-measures interaction was observed (group main effect: F=0.7, df=1, 12; repeated measures main effect: F=14.0, df=8, 112, p<0.001; group-by-repeated measures interaction: F=1.7, df=8, 96, ε=0.347).
Gray/white matter differences were also examined for the five regular caffeine users studied serially at baseline and after a caffeine holiday. Although no significant group effect was found (F=2.8, df=1, 14), combined gray matter lactate/NAA ratios were significantly greater, consistent with the trend shown in the previous comparison (F=6.1, df=1, 14, p<0.03). A trend for a group-by-tissue-type interaction was also present (F=4.0, df=1, 14, p=0.07). Consistent with whole brain analysis, similar effects of scan (F=2.9, df=8, 112, p=0.006) and group by scan (F=2.7, df=7, 104, p=0.01) were found. However, no significant group-by-tissue-by-scan effect was demonstrated (F=0.9, df=6, 104).
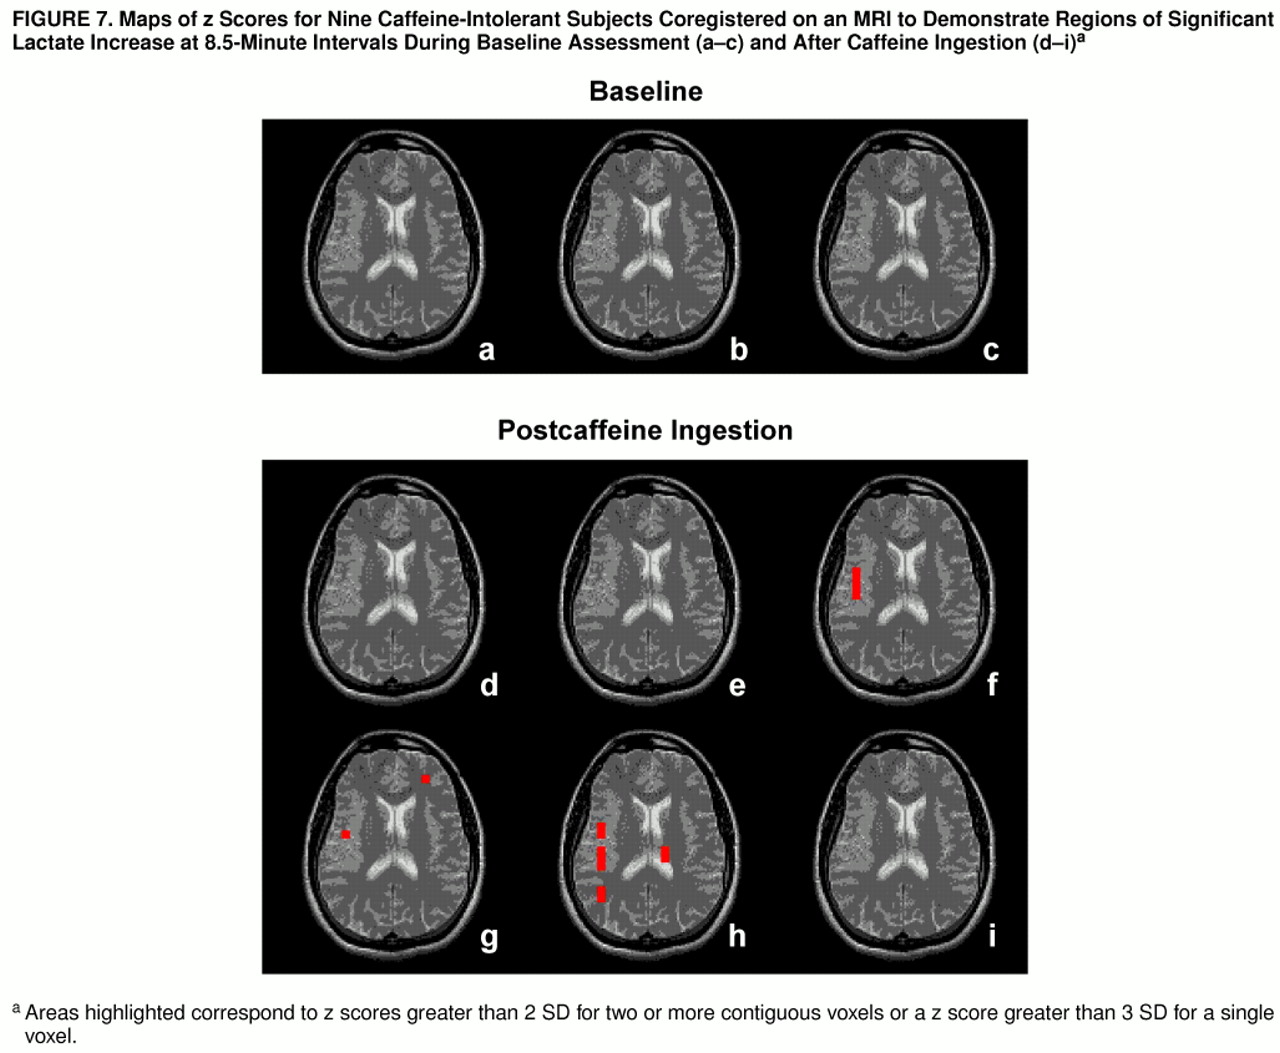
To further characterize the lactate increases among the caffeine-intolerant and regular caffeine users rechallenged after a caffeine holiday, z score maps were used to assess regional patterns of brain lactate response. Among the caffeine-intolerant group, a pattern of time-dependent regional differences was observed for areas encompassing the right insula, right temporal lobe, left frontal cortex, and left thalamus (z scores greater than 2 SD for two or more adjacent voxels or a z score greater than 3 SD for one voxel), as shown in
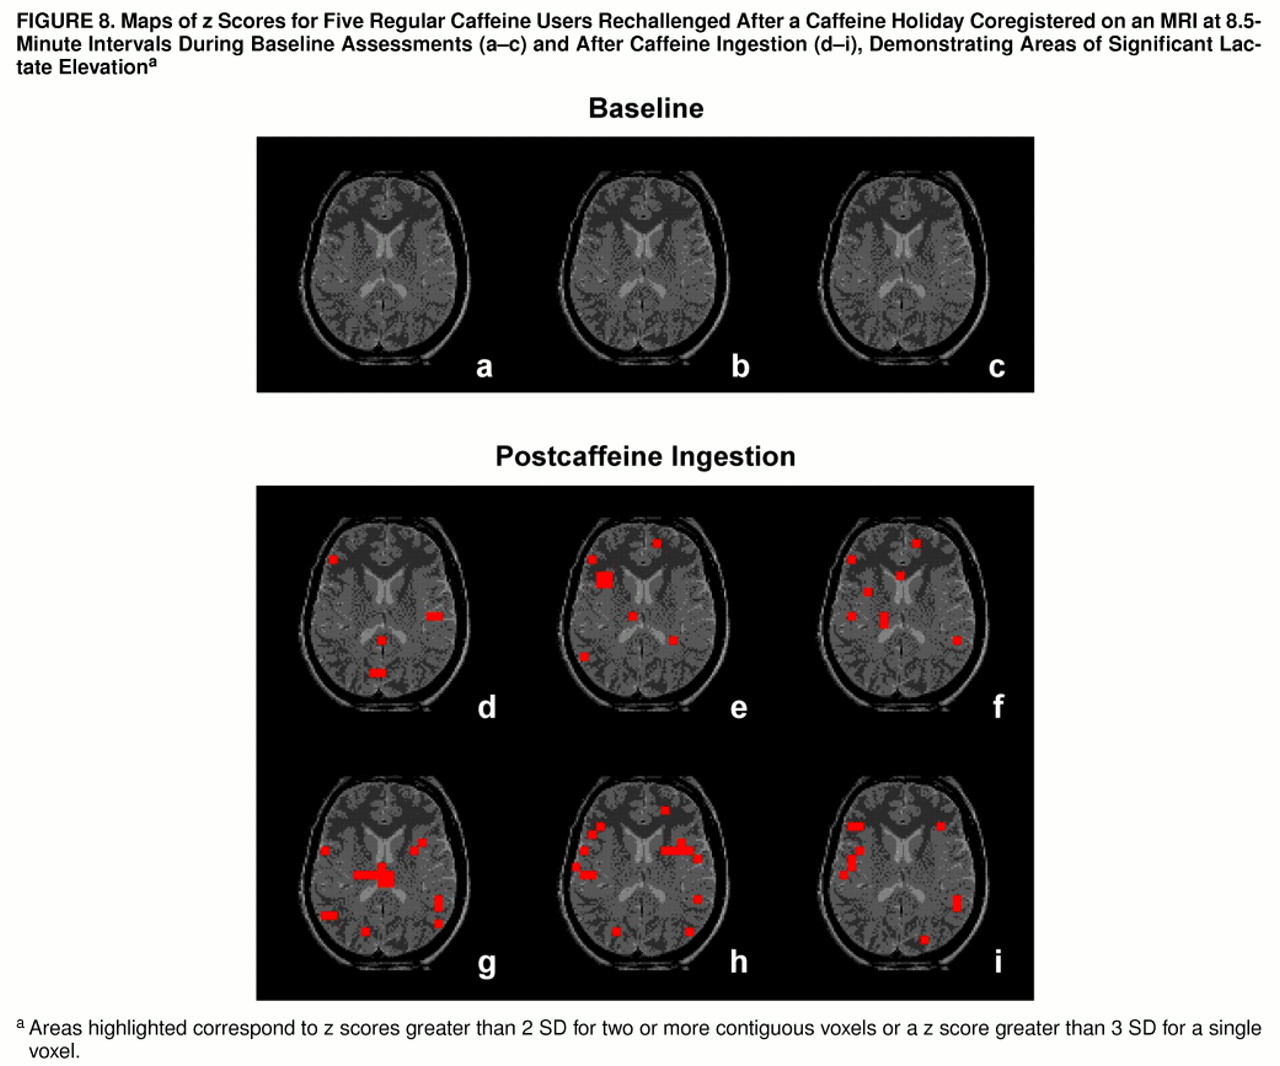
figure 7. The group of regular caffeine users who were rechallenged demonstrated more regions of brain lactate elevation than the caffeine-intolerant group, with time-dependent regional increases observed bilaterally in the insular cortex, temporal lobe, frontal cortex, thalamus, occipital cortex, corpus callosum, left basal ganglia, and left anterior cingulate (z scores greater than 2 SD for two or more adjacent voxels or a z score greater than 3 SD for one voxel), as shown in
figure 8.
DISCUSSION
Caffeine-intolerant individuals, but not regular caffeine users, exhibited a pattern of progressive rises in brain lactate during a 1-hour evaluation period after rapid ingestion of the equivalent of five to eight cups of coffee. Differences in brain lactate response were considered to possibly reflect underlying metabolic differences observed previously in individuals having panic disorder (
18–
20) and/or the effects of acute neuronal activation, as manifested by hyperarousal and anxiety, in response to caffeine ingestion (
27). Alternatively, habituation or the development of tolerance to caffeine among those with heavy, chronic use also could have blocked or diminished any brain metabolic effects.
To address whether findings of elevated brain lactate were specific to the caffeine-intolerant group or, conversely, reflected loss of caffeine tolerance due to lack of use, a subset of the regular caffeine users discontinued all xanthine-containing substances for an interval of 1–2 months. After this period of caffeine abstinence, those subjects demonstrated, in comparison with their initial study, significant rises in brain lactate in response to acute caffeine ingestion. The magnitude of the increase in brain lactate after a caffeine holiday was comparable to that observed for the caffeine-intolerant group, who had been essentially caffeine free for a number of years. An important difference between the two groups was the lack of adverse psychological or autonomic responses among the subjects rechallenged after a caffeine holiday, which suggests that elevations in brain lactate more specifically reflected loss of caffeine tolerance for metabolic effects rather than arousal per se. This further suggests that elevated brain lactate is not the primary mechanism responsible for caffeine’s precipitation of anxiety and/or panic symptoms in susceptible individuals.
Elevated brain lactate following acute caffeine exposure presumably reflects both intracellular and extracellular contributions, since an equilibrium between compartments results from a well-described saturable transporter (
28). However, the magnetic resonance visibility of intracellular lactate is controversial (
29,
30). If only a portion of brain lactate increase is detectable by magnetic resonance spectroscopy, this would decrease the signal-to-noise ratio for detecting change but does not preclude comparison between populations or characterization of the time course for rise in brain lactate.
Both caffeine-intolerant and caffeine-holiday subjects demonstrated diffuse increases in brain lactate in response to caffeine. Consistent with other reports (
26), gray matter appeared to be more metabolically active than white matter. More important, a different regional pattern of lactate response was observed between caffeine-intolerant and caffeine-holiday subjects. Areas of enhanced metabolic response were observed for regions corresponding to the right insular cortex, right temporal lobe, left frontal cortex, and left thalamus among the caffeine-sensitive individuals. This pattern of regional metabolic response, particularly involving the insular cortex, is consistent with observations by another group of researchers also investigating brain lactate effects of caffeine (G. Moore et al., personal communication). More extensive areas of brain lactate elevation, demonstrating less hemispheric lateralization, were observed in response to caffeine rechallenge following a caffeine holiday. Although involvement of certain regions might, in part, reflect high densities of adenosine receptors (
31), affected brain regions also correspond to areas of increased metabolism observed in positron emission tomography studies of generalized anxiety that normalize with benzodiazepine administration (
32). In attempting to understand the mechanism(s) underlying caffeine elevation of brain lactate, it should be noted that the regional differences in lactate observed in this study differ from our observations of diffuse, nonfocal elevations in brain lactate in response to vasoconstriction during hyperventilation (
17) or in response to intravenous lactate infusion (
33).
Several possible mechanisms might account for elevated brain lactate following acute caffeine ingestion. A cascade of events at the intracellular level, leading to accelerated glycolysis and the increased production of lactate, would be accentuated through caffeine-mediated decreases in CBF by 30% or more (
4–
7). Brain lactate increases observed after acute reintroduction of caffeine to caffeine-abstinent subjects, both those who were caffeine-intolerant and those who were regular users and electively discontinued caffeine, may reflect enhanced effects of caffeine on adenosine receptors that have been down-regulated (or not up-regulated) in the absence of caffeine; however, evidence for and against the occurrence of adenosine receptor up-regulation in response to chronic caffeine antagonism is mixed (
31,
34–
40). Administration of caffeine to caffeine-abstinent subjects could have increased metabolic activation through excitation of cholinergic neurons acutely released from the tonic inhibitory control of endogenous adenosine (
37,
41). Alternatively, these observations might reflect central activation of adrenergic receptors up-regulated in the absence of caffeine (
37,
42), as both alpha and beta receptors appear to act on intracellular metabolic processes that could increase lactate (
43). A lack of physiological arousal following reintroduction of caffeine suggests that the marked increase in brain lactate is unlikely to be due to caffeine’s effects on peripheral catecholamine receptors (
44). Although caffeine-induced vasoconstriction could have substantially increased brain lactate (
17,
18), available evidence suggests that tolerance to CBF reduction by caffeine (
15) does not occur. Vasoconstriction also does not appear to mediate caffeine’s anxiogenic effects among sensitive individuals (
6,
45) and would be expected to cause diffuse, nonfocal elevations in brain lactate (
17). One could speculate that following a period of caffeine abstinence, previously heavy caffeine users might be more metabolically reactive to caffeine reintroduction as a result of down-regulated adenosine receptor density, while remaining less sensitive than caffeine-intolerant individuals to possible anxiogenic effects of caffeine mediated by adrenoceptors that have not yet been up-regulated. This explanation for differential psychological/ physiological arousal between groups, while plausible, would depend on the time course of receptor changes in humans and awaits further confirmation.
In summary, acute ingestion of a large quantity of caffeine significantly increased brain lactate in caffeine-intolerant individuals who avoided caffeinated products and, as a consequence, were caffeine free, but not in regular caffeine users who daily consumed large quantities of caffeinated beverages and food. Specific to the caffeine-intolerant group, acute caffeine ingestion resulted in moderate to marked symptoms of panic/anxiety and physiological arousal. Among the regular caffeine users, reexposure to caffeine after a 4-week or longer caffeine holiday resulted in significantly greater increases in brain lactate that were comparable to those in the caffeine-intolerant group, but without associated psychological or physiological distress. This suggests that caffeine’s elevation of brain lactate is not directly responsible for (and does not result from) the symptoms associated with caffeine intolerance. Furthermore, regular caffeine consumption is an important modulator of caffeine’s metabolic effects, and loss of tolerance to those effects occurs within 1–2 months after caffeine cessation. This latter observation suggests that further investigation into the brain metabolic effects of caffeine in relation to tolerance and withdrawal would be of interest and might also serve as a useful model for studying other more addictive drugs.
