The question of whether bipolar disorder and schizophrenia represent discrete disorders, as suggested by Kraepelin
(1), or represent end points of a psychosis continuum
(2) is of fundamental theoretical importance. A recent report by Kendler and colleagues
(3), based on the Roscommon Family Study, suggested a “relatively complex typology of psychotic syndromes consistent neither with a unitary model nor with a Kraepelinian dichotomy” (p. 492). Crow
(4), however, took exception to these conclusions and, believing the findings compatible with his evolutionary theory of psychoses, stated, “At least 2 dimensions—the rate of growth of the 2 hemispheres and the extent to which their growth is differentially paced—are relevant to the onset and form of psychosis” (p. 504).
Studies based primarily on phenomenological classification may not be sufficiently robust to contribute substantively to this argument. No objective biological markers are known to exist, however. One candidate for a biological marker of psychosis is anomalous cerebral asymmetry
(2). In this report we examine a metric of functional cerebral asymmetry based on magnetic source imaging, which was used to compare subjects with bipolar I disorder, some with psychotic symptoms and some without, and nonpsychiatric comparison subjects. This study group is relevant to predictions arising from the Roscommon Family Study, in which Kendler and colleagues
(5) concluded that “schizophrenia shares a familial predisposition with a spectrum of clinical syndromes that includes schizoaffective disorder, other nonaffective psychoses, schizotypal personality disorder, and probably psychotic [affective illness], but not nonpsychotic [affective illness]” (p. 527). This observation implies that psychotic and nonpsychotic affective illnesses may relate to other psychoses in different ways. Therefore, a biological marker within affective illness that segregates with psychosis would be of considerable interest.
To quantify functional cerebral asymmetry, we measured the localization of the somatosensory evoked magnetic field component with a latency of approximately 20 msec that is elicited by electrical stimulation of the median nerve; this component is termed the M20. This is a well-defined magnetic component generated in area 3b of the postcentral gyrus
(6,
7). In normal adult subjects, the M20 is asymmetric, with sources further anterior in the right hemisphere
(8,
9). To our knowledge, the localization of the M20 in patients with bipolar disorder has not been previously reported.
METHOD
Subjects
Our study group included nine bipolar subjects without a history of psychotic symptoms during mood disorder episodes (six men), 12 bipolar subjects with a positive history of psychotic symptoms during mood disorder episodes (six men), and 12 comparison subjects (seven men). All subjects were volunteers from the local community, and all signed informed consent statements after having been apprised of the nature of the research. The research protocol was approved by the Colorado Multiple Institutional Review Board. Consensus diagnosis by two of us (M.R. and D.A.) for each patient was determined from data derived from the Structured Clinical Interview for DSM-IV—Patient Edition
(10) (performed by M.R.) and from available medical records. All of the patients met the DSM-IV criteria for bipolar disorder, type I. Most were receiving medication. All subjects were right-handed as determined by Annett criteria
(11). No subjects were abusing substances at the time of the study. No subjects who met the inclusionary criteria were rejected from the study. The comparison subjects had never been mentally ill according to the Research Diagnostic Criteria
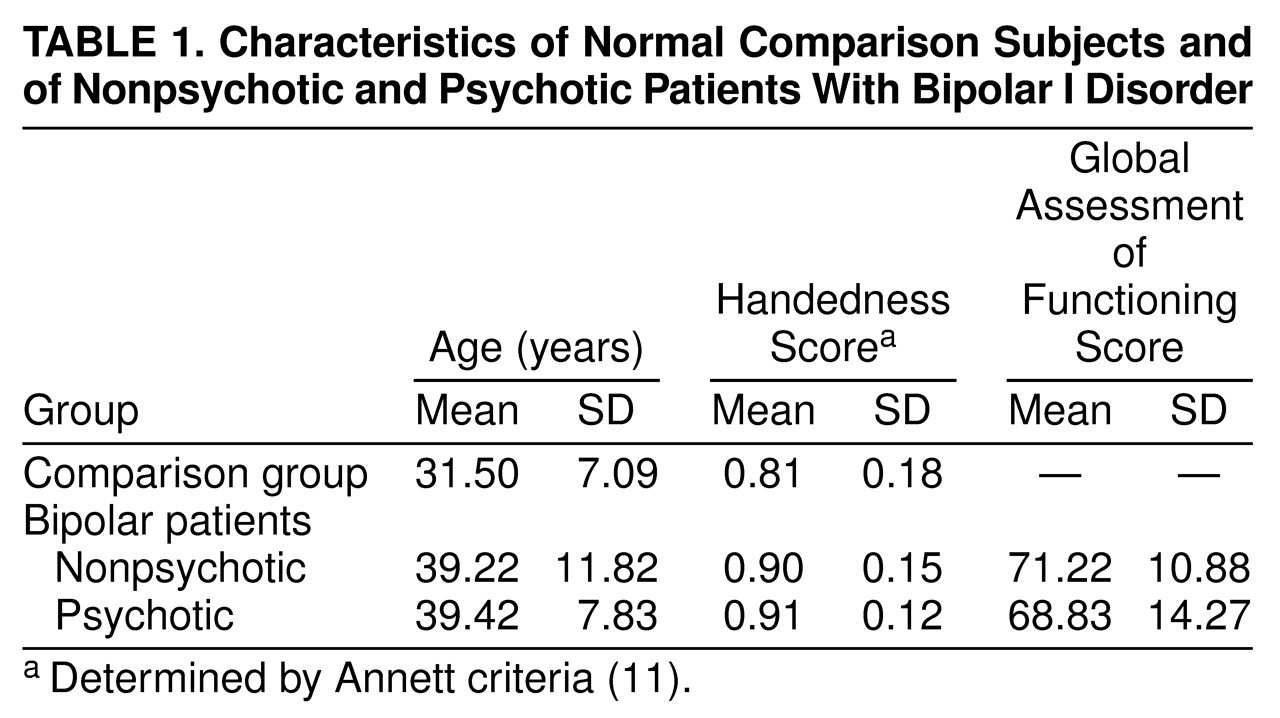
(12). Age, handedness, and global functioning are summarized in
Table 1.
Procedure
Magnetic recordings were obtained inside a magnetically shielded room, with the subject seated in a nonmagnetic chair, by using a BTI (BTI, San Diego) model 607 seven-channel, second-order biomagnetometer with an 18-mm coil diameter and a 4-cm baseline. Measurements were made by using four or five instrument positions on each hemisphere.
Stimulation was accomplished by attaching electrodes to the subject’s contralateral wrist, spanning the median nerve. Impedances were typically around 50 kΩ . A Grass Instruments (Quincy, Mass.) model SD9 square-pulse stimulator was triggered by means of a computer to deliver a 0.1-msec-duration pulse three times per second. Intensities were adjusted to the threshold level required to produce a thumb twitch.
A Science Accessories Corporation model GP8-3D sonic digitizer (SAC, Stratford, Conn.) with customized PIXSYS software (PIXSYS Inc., Boulder, Colo.) was used to establish the location and orientation of each gradiometer coil in a head-frame-based coordinate system determined by the three fiduciary points (left and right preauricular points and nasion). The X axis was defined by the line connecting the preauricular points (positive X is outward through the right ear). The Y axis was the line orthogonal to the midpoint of the X axis (the origin) and contained in the plane established by the X axis and the nasion (positive Y anterior). The Z axis was normal to X and Y at the midpoint, exiting the top of the head (positive Z is above the origin). Three points were digitized on a ring attached to the tail of the helium dewar with known locations relative to the internal coils, whose exact positions in space and in reference to the subject’s head were then calculated.
Recordings were wide band (0.1–1.0 kHz) and digitized at a rate of 5.12 kHz. Recordings included a 50-msec prestimulus baseline and 50 msec following stimulus delivery. Responses to 500 stimuli were recorded at each gradiometer position. Individual trials containing sample points with amplitudes greater than ±1600 fT were automatically rejected, as this was the dynamic range limit of the system. The remaining trials were visually inspected for artifacts and then averaged and filtered with a phase-invariant digital filter (24 dB/octave slope) with a pass band of 10 to 150 Hz.
Source localization was analyzed across the entire poststimulus window from 0 to 48 msec by using a single moving equivalent current dipole in a conductive sphere model
(13) and a sliding 3-msec-wide time window at 1-msec increments for each hemisphere. The mean B-field amplitude for each coil for the 3-msec window (starting 1.5 msec before, and ending 1.5 msec after, each time point) was computed by averaging the samples (N=15) in this interval. The custom software package MEGEEG was used to solve the inverse problem at each time point. It provides 95% confidence intervals
(14) and includes corrections for the effects of both coil area and baseline
(15). Both radial and tangential components, including those associated with volume currents, were computed in the forward solution
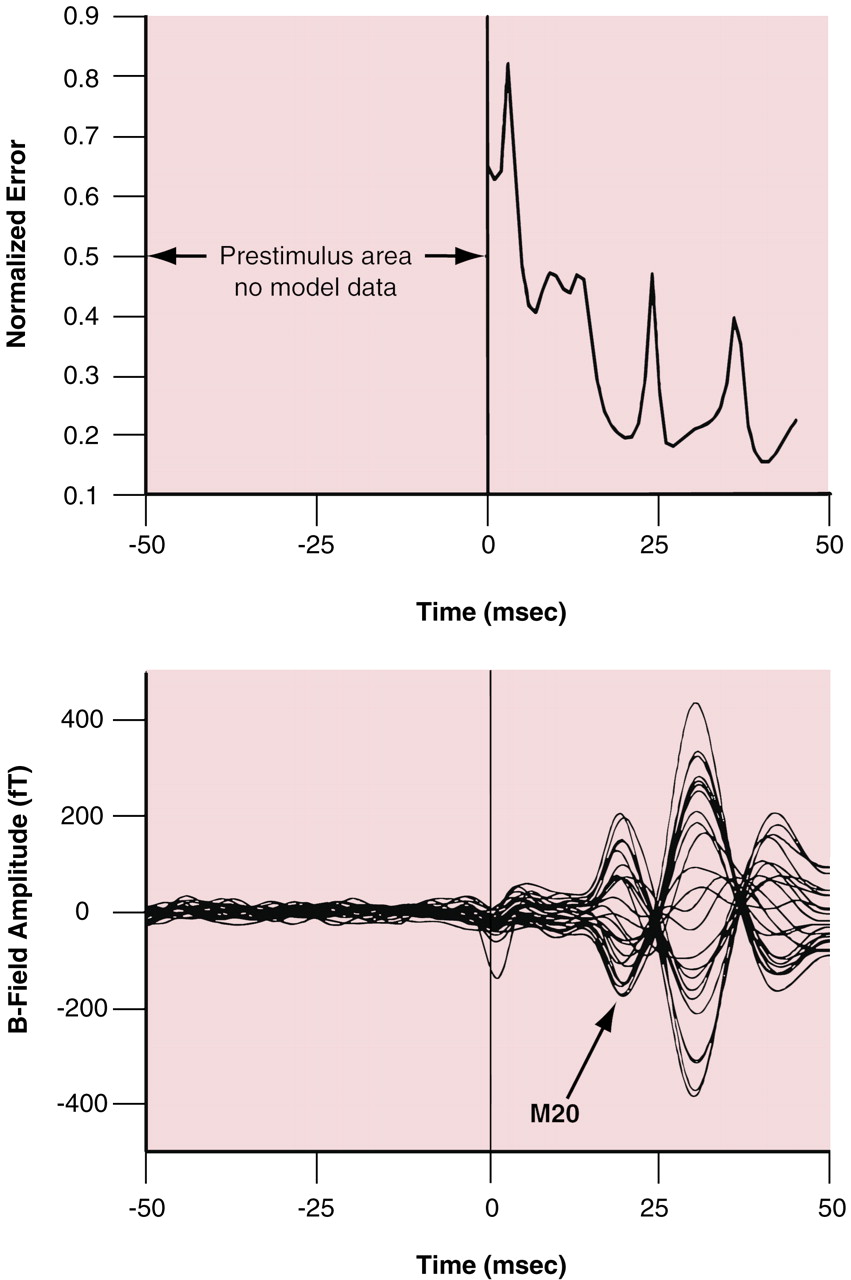
(13). Studies using plastic spheres and skull models with this instrumentation demonstrated that MEGEEG localizes single current dipoles to an accuracy of within ±1.0 mm. For this somatosensory evoked field data, a generic “best fit” sphere was used for all subjects. The sphere had a radius of 8 cm and was centered at the point 0.5, –1, 5 for the right hemisphere evaluations and at the point –0.5, –1, 5 for the left hemisphere cases. For the candidate sources, a normalized error measure was computed at each time point by dividing the root mean square of the error (i.e., the difference between the measured field amplitudes and the final iteration of the forward solution) by the root mean square of the data. This measure was then evaluated in the window from 17 to 40 msec poststimulus by searching for local minima (i.e., the latencies when the equivalent current dipole best modeled the data). A typical plot of normalized error with associated M20 evoked field waveforms is shown in
Figure 1. The first local minimum in the window was used to define the latency of the equivalent current dipole associated with the nominal 20-msec component of the field evoked by median nerve stimulation. In addition, these equivalent current dipoles were required to have a common orientation such that the dipole moment vectors had the following relationships: Q
y > 0 and |Q
y| > |Q
z|.
Statistical Analysis
Statistical analyses were conducted by using Statistica 5.1 (Tulsa, Okla.). All analyses of variance (ANOVAs) used type III sums of squares (i.e., correcting for all other effects in the design). Significance tests were conducted by using a 0.05 alpha level (two-tailed). To test the hypotheses that 1) bipolar subjects would have less lateralization than comparison subjects and 2) the lateralization of psychotic bipolar subjects would be different from that of nonpsychotic bipolar subjects, we used a 3×2 mixed-design ANOVA (group by hemisphere), with hemisphere treated as a repeated measure. The interaction effect was examined by partitioning the ANOVA into two orthogonal contrasts to specifically evaluate those hypotheses. On inspection of the data on mean source location, a difference in the Z coordinate (inferior-superior) was observed, and a follow-up ANOVA with a design identical to the previous one was conducted without contrasts. Post hoc Tukey’s honestly significant difference tests for unequal sample sizes were used to evaluate omnibus ANOVA results where no a priori hypotheses were present.
RESULTS
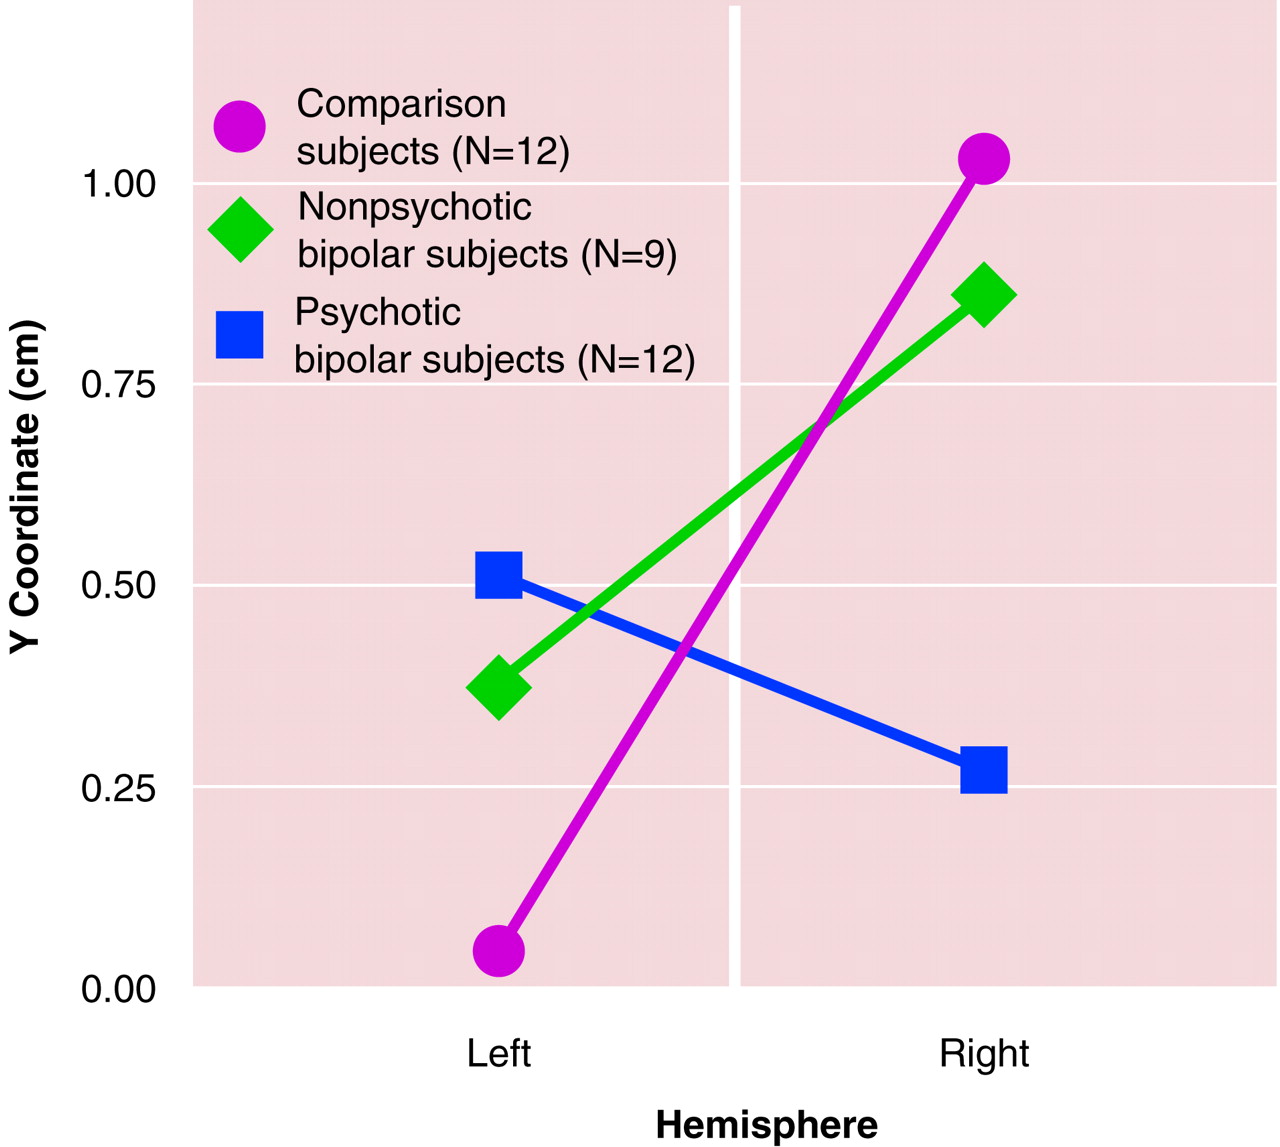
Both orthogonal contrasts were significant. The first contrast, to evaluate differences between bipolar and comparison subjects, indicated that the bipolar subjects had significantly less lateralization overall than the comparison subjects (F=9.18, df=1, 30, p<0.005). The second contrast indicated that the psychotic bipolar subjects actually had more lateralization than the nonpsychotic bipolar subjects (F=4.48, df=1, 30, p<0.04), but the direction was the reverse of that for the comparison subjects and nonpsychotic bipolar subjects (i.e., left source anterior to the right source). These findings are illustrated in
Figure 2.
The group-by-hemisphere interaction for the magnetoencephalographic Z coordinate was also significant (F=4.62, df=1, 30, p<0.02). Post hoc Tukey’s honestly significant difference tests for the left and right hemisphere results revealed no results approaching statistical significance, however. No other equivalent current dipole variables (e.g., source strength, latency, orientation) differed significantly between the groups.
DISCUSSION
Evidence of reversed lateralization of the M20, with sources further anterior in the left than the right hemisphere, was found in the bipolar subjects who had a history of psychosis during their episodes of mood disorder. In contrast, both the comparison subjects and nonpsychotic bipolar patients exhibited the previously described asymmetry, with sources further anterior in the right than left hemisphere
(9,
16).
This study included both male and female subjects. While sex differences in auditory data from magnetic source imaging of schizophrenic patients have been described
(17,
18), to our knowledge sex differences in the localization of the M20 have not been described, nor were they apparent in our data from comparison subjects. Thus, we believed that it is justifiable to combine data on the two sexes in this report. We realize, however, that with respect to sex our study group is too small to properly address this question.
The relative displacement of the source of a magnetic evoked field component can result from at least two separate mechanisms. First, the neural tissue generating the component can be displaced in space in the brain. Alternatively, a different region of cortex can be involved in generating the component in question. We will briefly consider both alternatives. Patients with schizophrenia also demonstrate anomalous asymmetry of the 100-msec-latency auditory evoked field termed M100, which is thought to be generated in auditory cortex in or near Heschl’s gyrus
(17,
19–
22). A recent study by Rojas and colleagues
(23) suggested that this relative displacement of the M100 may not represent a displacement of Heschl’s gyrus in space but, rather, could be the result of a disease-induced cortical reorganization such that a different region of auditory cortex is involved in its production.
The somatosensory M20, the magnetoencephalographic analog of the EEG evoked potential N20, is generated in area 3b of the postcentral gyrus
(24,
25), where it may represent early excitatory postsynaptic potentials
(26). The localizations of these early somatosensory magnetic evoked field sources are used for defining the locations of the postcentral gyrus in presurgical mapping studies
(27–
29). While alterations in the localization of late magnetic sources in the somatosensory cortex can occur as the result of experience, such as amputation
(30,
31) or violin playing
(32), to our knowledge there are no published data supporting the notion that somatosensory cortical reorganization could result in generation of the M20 any place other than the postcentral gyrus. Accordingly, the preliminary implication of these findings is that there may be a relative displacement of the postcentral gyrus in the right and left hemispheres of patients with psychotic disorders, reflecting a different anatomical, rather than functional, localization.
Anomalous brain asymmetry has been described as characteristic of psychotic disorders, with evidence of asymmetry often being less than that in comparison subjects
(2). This difference has been found in both structural
(33–
38) and functional
(20,
39–
42) measures. Although this finding has been described predominantly in patients with schizophrenia or schizophreniform disorders, Crow
(2) suggested that anomalous asymmetry may be characteristic of psychotic disorders more generally, including the affective psychoses, which our findings support. Direct comparisons of subjects with different psychotic disorders would have to be performed, however, to assess this hypothesis.
The development of brain asymmetry in animals is thought to be at least partially under genetic control
(43), although the situation in humans is far from clear
(11). It has been suggested that psychosis-related brain asymmetries may be related to genetic influences stemming from regions of the X chromosome
(44). While the genetics of bipolar disorder are uncertain, evidence of an X chromosome linkage has been described
(45). The possible relationship between genes involving lateralization of the brain and bipolar disorder on the X chromosome may merit further investigation.
Both affective psychosis and the lithium used to treat affective disorders have been associated with subclinical alteration in function of the peripheral nervous system, predominantly in the realm of component amplitude and conduction velocity
(46). We saw no difference between groups in N20 latency or strength, however. Similarly, no differences were noted between patients treated with lithium (N=8) and those not treated with lithium (N=13). We doubt, therefore, that altered function of the peripheral nervous system is related to these findings.
Since none of our subjects were psychotic at the time of the study, our findings suggest that reversed asymmetry may be a trait, rather than state, marker of psychosis. As such, the findings raise the question of the possible utility of such measures of brain lateralization in predicting the clinical course of early-onset affective disorder or in assessing the possibility of disease development in those at known genetic risk. If the findings are replicated and observed to be stable biological markers of a difference in the course of bipolar disorder, such measures might be of significant clinical utility. For patients in whom such a marker predicts the development of psychosis during episodes of mania or depression, early and aggressive medication and psychosocial intervention might decrease the morbidity, mortality, and cost associated with psychotic mood disorders.


