Data Synthesis
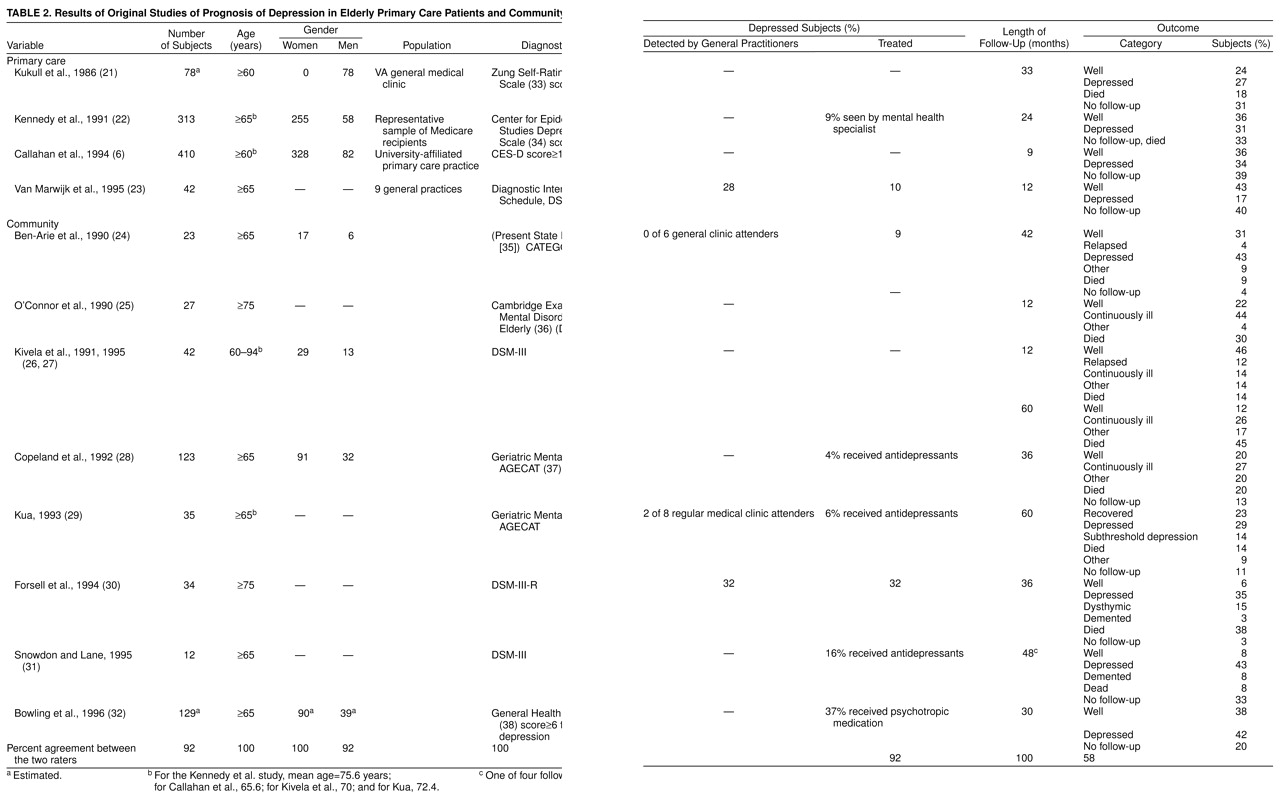
The results of the 12 studies are summarized in
Table 2. Interobserver agreement for nine items of abstracted data ranged from 58% to 100%. The lower level of agreement for the outcome variable (58%) reflected the way it was calculated: for each study, both raters had to have exactly the same percentages in each outcome category. When the criterion of agreement was relaxed the same (give or take 3%), interobserver agreement increased to 92%.
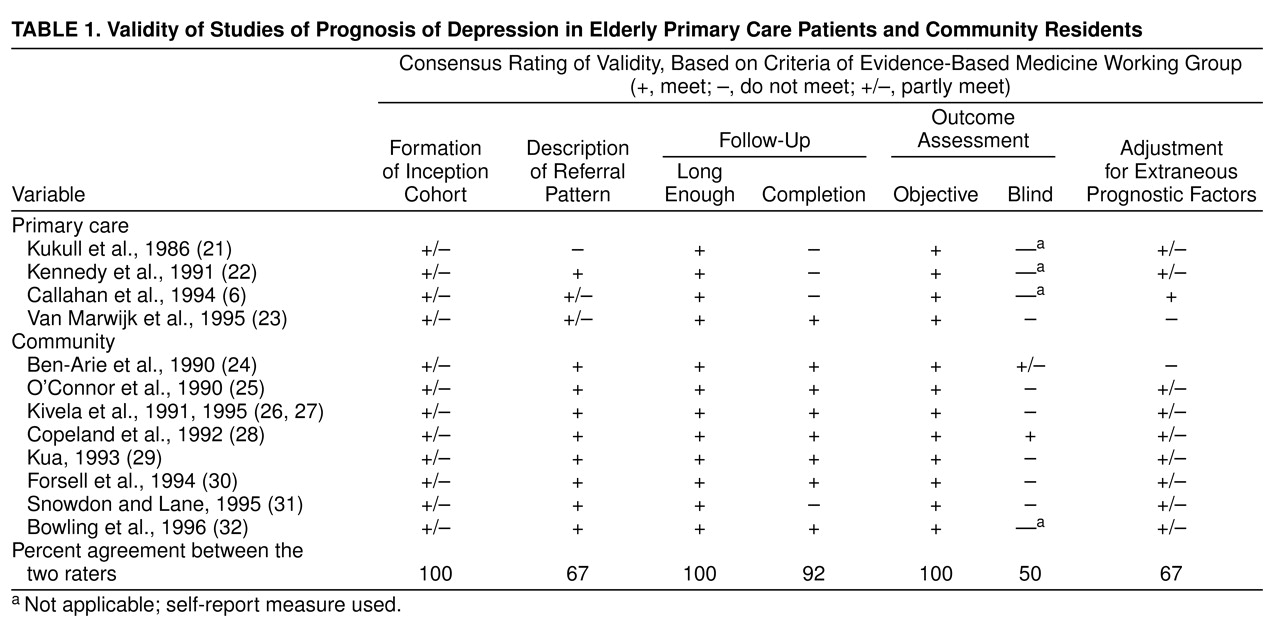
Qualitative: primary care studies. One study used DSM-III criteria (major depression or dysthymia), and three used cutoffs on depression symptom rating scales: in two instances, a score of 16 or more on the Center for Epidemiologic Studies Depression Scale
(34) and, in the third instance, a score of 60 or more on the Zung Self-Rating Depression Scale
(33). Study groups ranged from 42 to 410 patients. Patients’ mean ages were reported in two studies (65.6 and 75.6 years). One study included men only, and in two others, 80% or more of the patients were women. Lengths of reported follow-up varied from 9 to 33 months. One study reported the rate of detection by primary care physicians (28%). Two studies reported rates of eventual antidepressant treatment (9% and 10%, respectively).
Qualitative: community studies. One study each used the Present State Examination-CATEGO
(35), the Cambridge Examination for Mental Disorders in the Elderly (36), DSM-III-R criteria (major depression), or a score of 6 or more for anxiety-depression on the General Health Questionnaire
(38); two studies each used DSM-III criteria (major depression) or the Geriatric Mental State-AGECAT
(37). Study groups ranged from 12 to 129 patients. Subjects’ mean ages were reported in two studies (70 and 72.4 years). Four reported gender distribution: most subjects were women. Lengths of reported follow-up varied from 12 to 60 months. Three studies reported rates of detection of depression by primary care physicians (0% to 32%). Six studies reported rates of eventual antidepressant treatment (4% to 37%).
Qualitative: prognostic factors. A variety of prognostic factors were reported in 10 studies, although measurement of these factors varied from one study to the next. Older age
(22), added supports
(22), poor perceived health
(6), and total number of life events
(26,
27) were associated with poor outcome in one study each; however, alcohol abuse
(21), major life events
(23), and social factors (education, marital status, social participation [
26,
27]) were not. Physical disability
(26,
27,
32) and cognitive impairment (23, 31) were associated with poor outcome in two studies each. Physical illness was associated with poor outcome in four studies
(22,
29,
31,
32) but not in two others
(21,
26,
27). Finally, severe depression was associated with poor outcome in two studies
(6,
32) but not in two others
(26,
27,
31).
Quantitative. Three outcome categories—well, depressed, and died—were consistent across most of the studies. The other outcomes (e.g., dementia, partial remission) were categorized as “other” in this analysis. Some specific outcome categories (e.g., dead) were not evaluated in a few studies; in such cases, we removed these studies from the calculation of the estimates of the regression model parameters for these outcome categories. The percent of subjects well, depressed, dead, and “other” at the end of follow-up was modeled by using a mixed effects regression model.
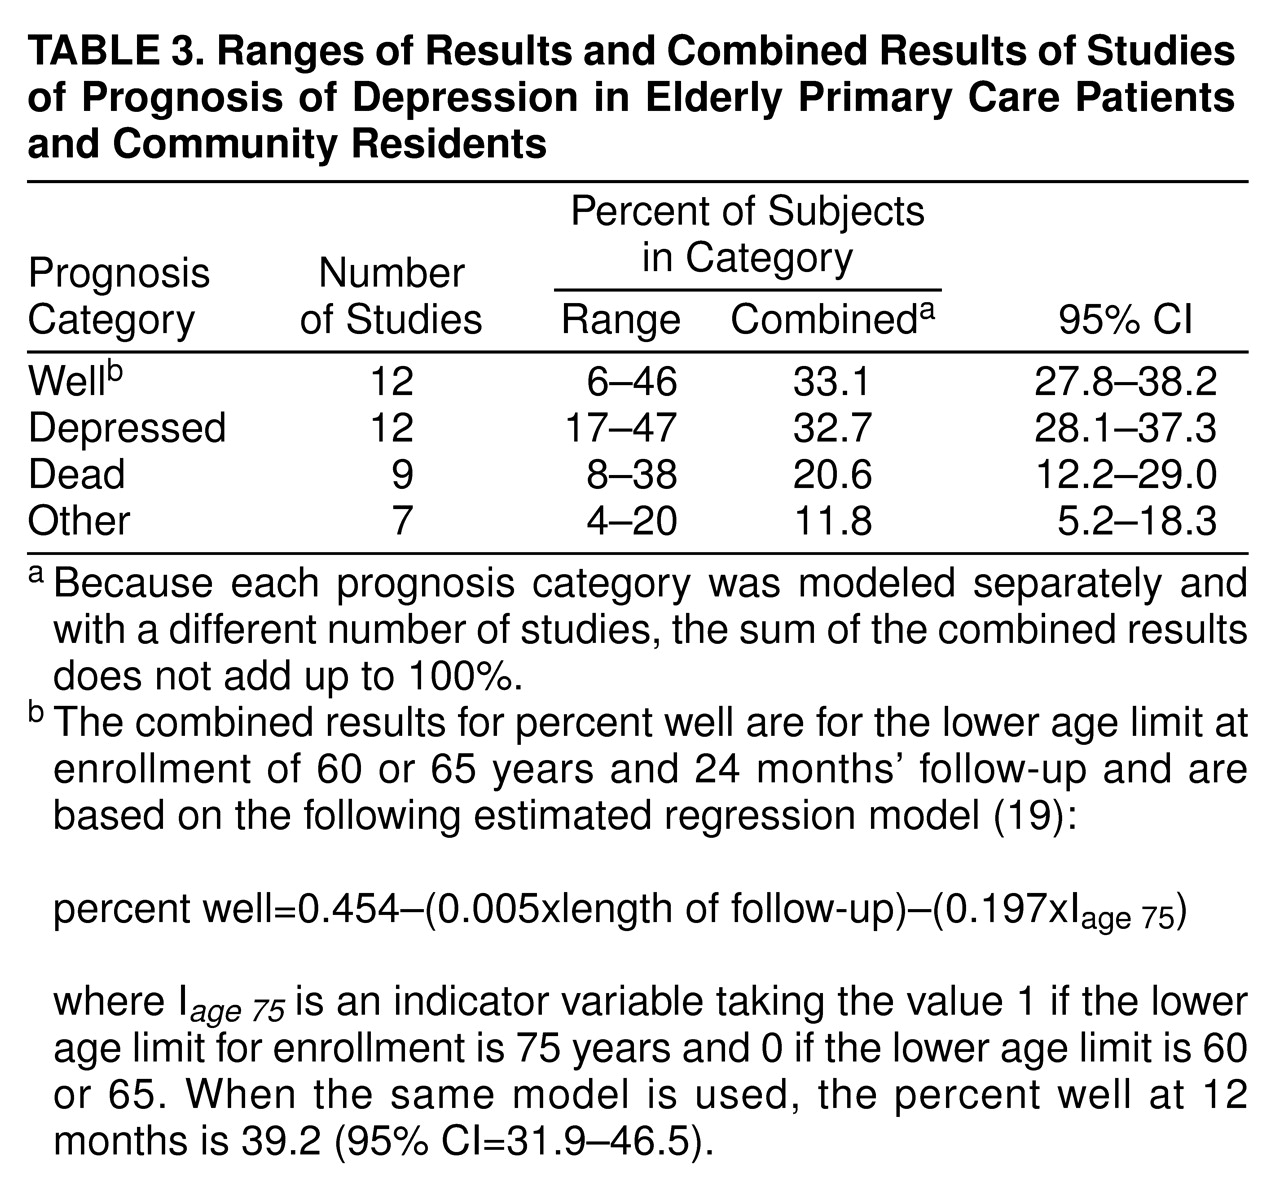
There was significant heterogeneity in the outcomes across studies (
Table 3.). Differences in the length of follow-up and lower age limit for enrollment explained part of this heterogeneity for the outcome category of well, but differences in gender distribution, population, diagnostic criteria, and percent receiving antidepressant treatment did not. However, significant variation among the random effects was still unexplained even after control for length of follow-up and lower age limit for enrollment.
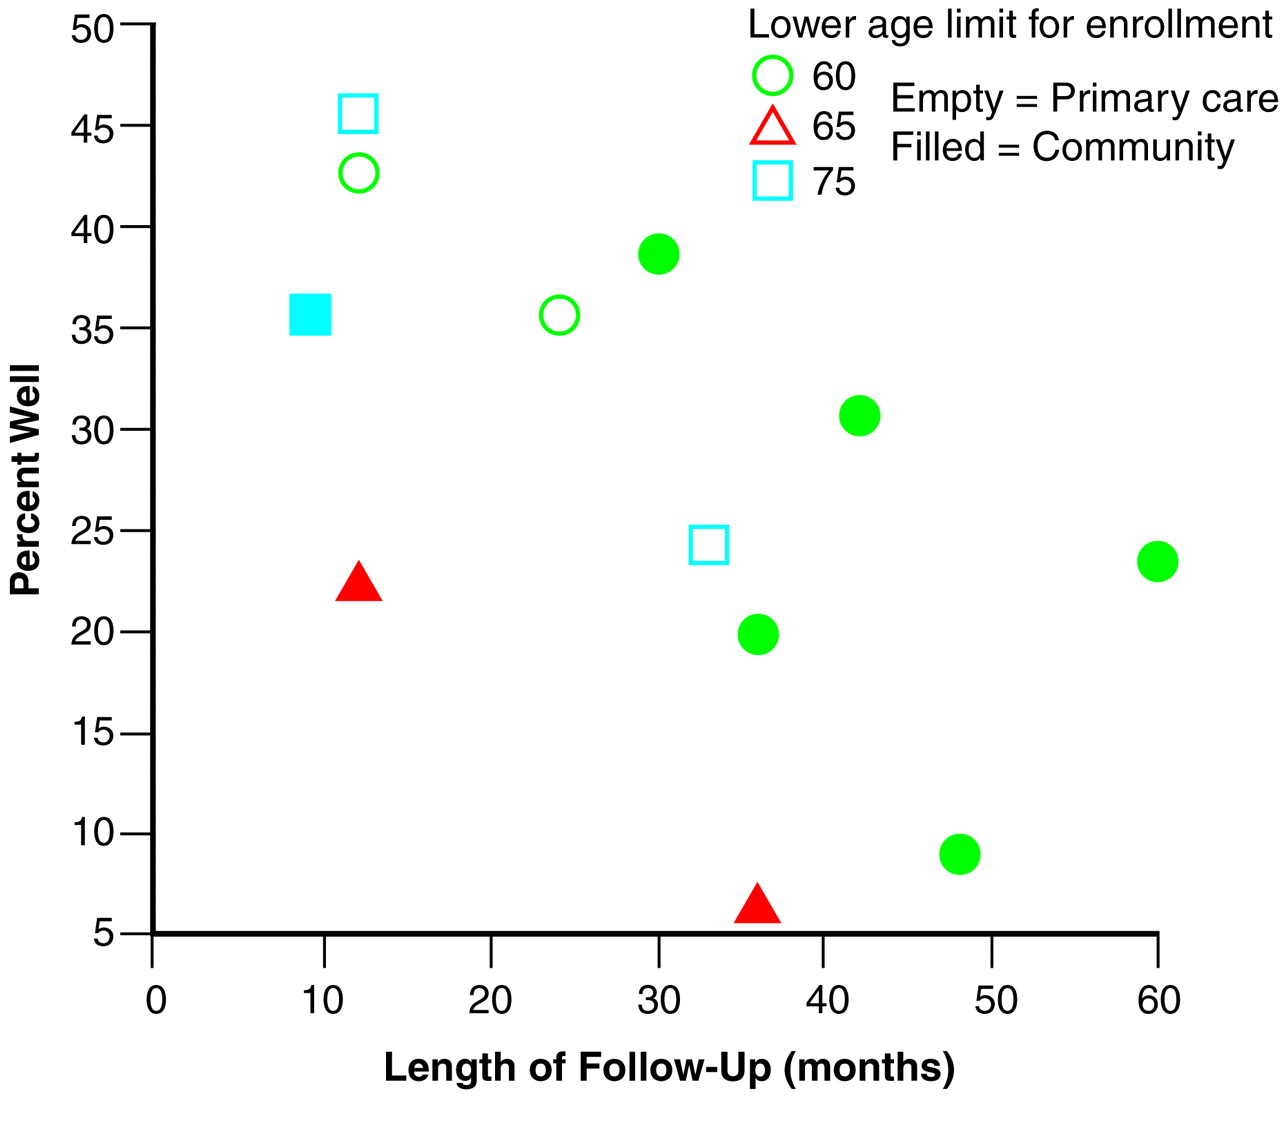
Figure 1 illustrates the significant inverse relationships (p<0.05) between length of follow-up, lower age limit for enrollment, and percent well. Clearly, the percent of subjects well decreases with the increasing length of follow-up and lower age limit of 75. There was no significant difference between lower age limits of 60 and 65; therefore, they were pooled into a single category in the final mixed effects regression model.
Table 3. presents the combined estimate of the percent well and the 95% confidence interval (CI) for a 24-month follow-up and 60 or 65 lower age limit for enrollment. No significant relationship was observed between the other three outcome categories and the covariates. Thus, the final mixed effects regression model for these other outcome categories included only the intercept and the random effect, which is equivalent to simply combining the results of all studies through use of a random effects model
(19). The combined estimates for these other outcomes and their 95% CIs are presented in
Table 3.. Note that only nine studies had “dead” as an outcome category; only seven had an “other” category.
