Despite discrepancies among the findings of several studies
(1–
3), most magnetic resonance imaging (MRI) and postmortem studies to date have found an increase in the volume of basal ganglia structures in patients with schizophrenia compared with age- and gender-matched comparison subjects
(1,
4–
9). It was originally thought that this increase in volume was caused by an aberration in neuronal pruning in patients with schizophrenia
(4,
6). This theory was presented in early reports as a failure of maturational synaptic elimination that would normally reduce the basal ganglia volume during adolescence
(4) or a compensatory response to lessened input from the anterior, temporal, frontal, or thalamic regions
(6). More recent evidence suggests that the effects of neuroleptic treatment may instead be responsible for the observed enlargement
(8–
12). This hypothesis is based on the observation of cumulative effects of neuroleptic medication in first-episode, neuroleptic-naive patients who were scanned at intake and again after several months of treatment with typical neuroleptics
(12). Because similar observations have been made in patients with nonschizophrenic psychiatric illness (affective disorder) who were treated with typical neuroleptics
(13), it is probable that the volume increase is caused by medication, rather than a disease-specific manifestation of schizophrenia.
Two recent studies from our center, using single photon emission computed tomography and positron emission tomography, respectively, reported a relative increase in cerebral blood flow to the basal ganglia following treatment with neuroleptic medication
(14,
15). We hypothesized that neuroleptic-induced receptor blockade caused an increase in basal ganglia blood flow and metabolism and that the increase in basal ganglia volume previously reported
(1,
4–
9) could be attributed to medication-induced changes in blood flow to the region or changes in receptor proliferation
(15).
With the advent of atypical neuroleptic drugs, the effects of typical and atypical neuroleptics, which have differing affinities for dopamine D
2 receptor sites, can be compared. It has been reported that the volume increase caused by typical neuroleptics is reversed following exposure to the atypical neuroleptic clozapine
(9,
16). Since these studies were initiated, both risperidone and olanzapine have been added to the atypical neuroleptic armamentarium. Sufficient time has elapsed since their introduction to gather data on patients scanned at the beginning and end of a 1- to 2-year time period, as previously described for clozapine.
METHOD
We studied 23 male patients with diagnoses in the schizophrenia spectrum: schizophrenia (N=19), psychosis not otherwise specified (N=3), and schizotypal disorder (N=1). Diagnoses were made according to DSM-IV on the basis of a structured interview, the Comprehensive Assessment of Symptoms and History
(18). Patients were chosen for this study according to the stipulation that their initial diagnosis of schizophrenia spectrum disorder remained within that spectrum by the time of their 2-year follow-up. The mean age of patients at intake was 25.57 years (SD=6.19), and the mean age at illness onset was 22.44 years (SD=6.11). After complete description of the study to each patient, written informed consent was obtained.
The following neuroleptic drugs were used with these patients: typical neuroleptics—haloperidol, trifluoperazine, thiothixene, fluphenazine, thioridazine, perphenazine, and chlorpromazine; and atypical neuroleptics—clozapine, risperidone, and olanzapine. The dose-year formula was used to measure neuroleptic exposure. Neuroleptic exposure was calculated as cumulative dose at the time of intake scan and further neuroleptic dose accumulated during the 2 years between intake and follow-up scans
(17). This required conversion of neuroleptic medication to chlorpromazine equivalents
(19). The older equivalents have recently been extrapolated to atypical neuroleptics, by using clinical efficacy as the criterion for determining equivalency as was done for typical neuroleptics in the work of Davis (
19, cited in reference
20). Exposure was then calculated over time and weighted for dose. This was a naturalistic study of 23 patients, most of whom had already been medicated to some extent. At the time of the intake scan, four patients were neuroleptic naive, 14 had been treated with typical neuroleptics only, and five patients had been treated with both typical and atypical neuroleptics. Univariate analysis indicated that mean dose years of typical neuroleptics for the entire study group (N=23) at intake was 4.24 (SD=8.17, range=0–37.25, median=1.25); similarly, mean dose years of atypical neuroleptics for the entire study group (N=23) at intake was 0.81 (SD=3.18, range=0–15.07, median=0).
MRI scans were obtained by using a 1.5-T General Electric Signa scanner (GE Medical Systems, Milwaukee) at the beginning and end of the 2-year period. T
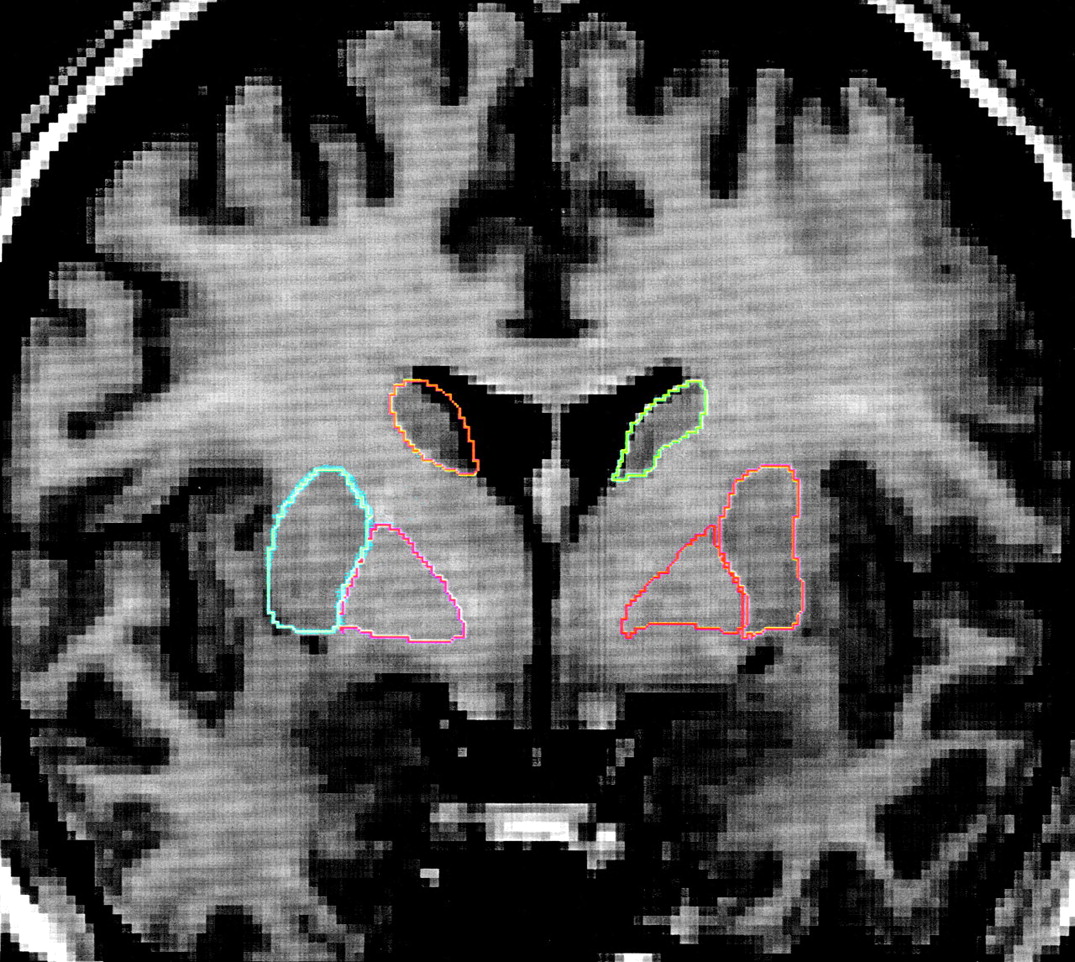
1-weighted images, using a spoiled grass sequence, were acquired with the following parameters: 1.5-mm coronal slices, 40˚ flip angle, TR=24 msec, TE=5 msec, number of excitations=2, field of view=26 cm, and a matrix of 256×256×192 cm. Scans were visually assessed for quality and movement artifacts by using this scale: 4.0=excellent, no obvious movement; 3.0=good, minimal movement; 2.0=fair, some movement; 1.0=poor, substandard. All scans in this study received quality ratings of 2.5 to 4.0. The caudate and lenticular nucleus were manually traced on contiguous 1-mm-thick coronal slices by using BRAINS, a software package developed by the Iowa Mental Health Clinical Research Center
(21). The following criteria were established to ensure consistent and reliable tracing of these two major components of the basal ganglia (caudate and lenticular nucleus). Each component structure was traced on coronal slices from its rostral to caudal aspect, first on the right side of the image, then on the left side. The sequence of tracing was right caudate, left caudate, right lenticular nucleus, and left lenticular nucleus. Tracing commenced when the structure could be seen by the naked eye and ended when the structure was no longer discernible. The tracer was blind to the treatment status of patients. Taken individually, each major component had several defining characteristics that were used to guide tracing of the structure. Complete tracing guidelines are available from Dr. Corson on request. Interrater reliabilities (intraclass r) for the traced regions of interest were as follows: right caudate=0.81, left caudate=0.73, right lenticular nucleus=0.60, and left lenticular nucleus=0.79.
RESULTS
During the 2 years (mean=2.17 years, SD=0.42, range=1.18–3.67, median=2.13) between intake and follow-up scans, additional neuroleptic dose years were accumulated by the entire study group (N=23) as follows: 1) for typical neuroleptics, mean=5.60 dose years (SD=6.55, range=0–19.36, median=2.69); 2) for atypical neuroleptics, mean=5.29 dose years (SD=7.83, range=0–27.76, median=2.26). During the 2-year follow-up period, 13 patients were treated almost exclusively with typical neuroleptics: eight of the 13 had been treated only with typical neuroleptics, whereas five had also been minimally exposed to atypical neuroleptics. For typical neuroleptics, mean=9.05 dose years (SD=6.89, range=0.60–19.36, median=6.74); for atypical neuroleptics, mean=0.93 dose years (SD=1.53; range=0–4.77, median=0). The remaining 10 patients had been exposed mostly to atypical drugs over the previous 2 years. Six of these 10 patients were treated exclusively with atypical neuroleptics (clozapine, olanzapine, or risperidone) during the follow-up period, while four had minimal exposure to typical neuroleptics (primarily haloperidol); this exposure occurred during the early part of the follow-up period in all cases. For atypical neuroleptics, mean=10.96 dose years (SD=9.14, range=1.25–27.76, median=7.18), and for typical neuroleptics, mean=1.14 dose years (SD=1.45, range=0–3.28, median=0).
When viewed as two separate groups in this manner, exposure to neuroleptics at intake for the two groups was as follows: group 1: N=13, typical neuroleptic mean=4.38 dose years (SD=10.11, range=0–37.25, median=1.25), atypical neuroleptic mean=0.25 dose years (SD=0.88, range=0–3.17, median=0); group 2: N=10, typical neuroleptic mean=4.08 dose years (SD=5.17, range=0.09–15.00, median=1.61), atypical neuroleptic mean=1.53 dose years (SD=4.76, range=0–15.07, median=0). There was no significant difference between the mean ages of patients in the two groups. Age at intake was as follows: group 1: N=13, age at first scan, mean=25.77 years (SD=5.80, range=19.00–38.00, median=24.00); group 2: N=10, age at first scan, mean=25.30 years (SD=6.98, range=18.00–41.00, median=23.50). There was also no significant difference in the length of the time interval between the time 1 and time 2 scans across groups: group 1: N=13, time interval between first and follow-up scans, mean=2.12 years (SD=0.54, range=1.18–3.67, median=2.12); group 2: N=10, time interval between first and follow-up scans, mean=2.21 years (SD=0.18, range=2.00–2.61, median=2.17).
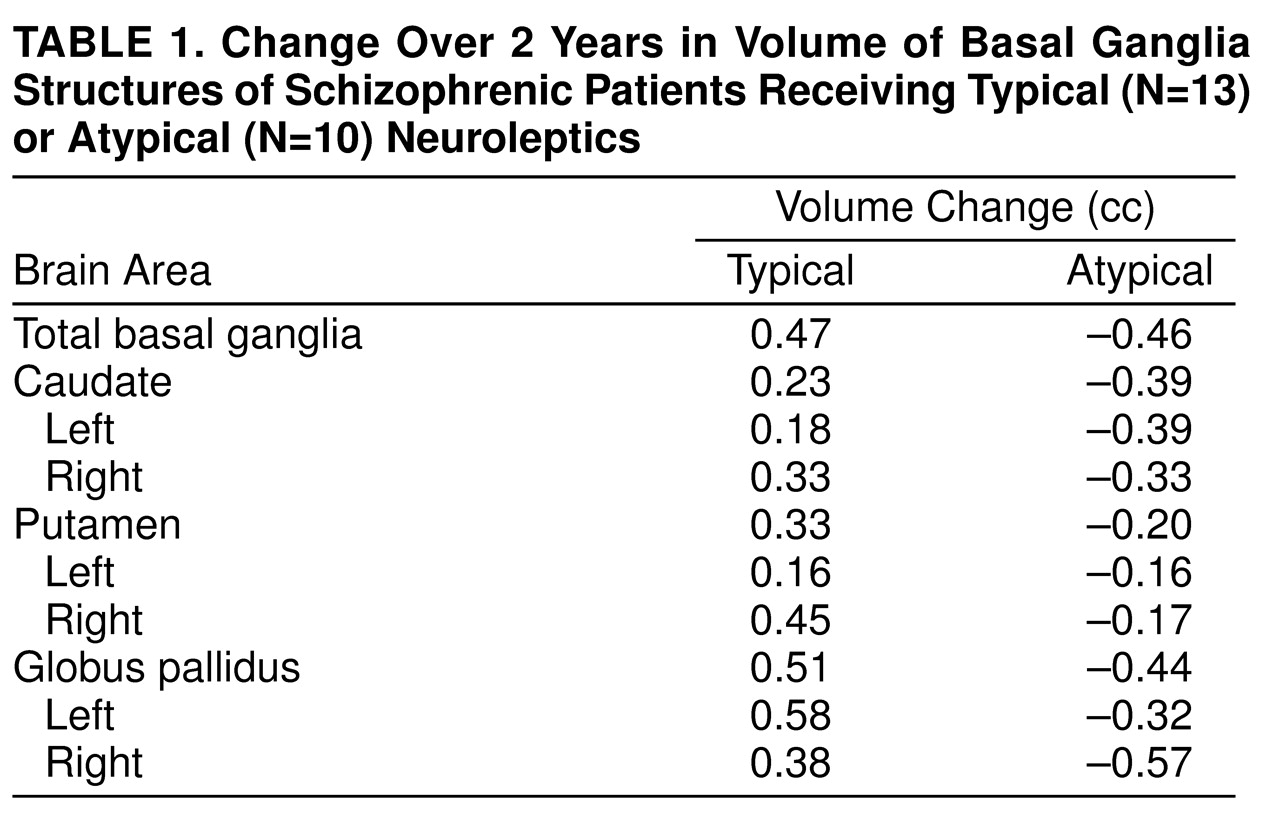
Change in basal ganglia volume over the 2-year interval was compared in these two groups by using a simple repeated measures analysis of variance. There was a significant group-by-time interaction (F=12.92, df=1, 21, p<0.002). This indicates that the changes over time differ for the two groups (
Table 1). Follow-up t tests showed a significant mean decrease in basal ganglia volume for the group of patients who received mostly atypical neuroleptic medication (mean=–0.99 cc, SD=1.06) (paired t test=2.93, df=9, p<0.02, two-tailed). By contrast, the group medicated mostly with typical neuroleptics showed a significant increase in basal ganglia volume (mean=0.52 cc, SD=0.94) (paired t test=1.98, df=12, p<0.04, one-tailed, based on a priori prediction of increase in size; this was the only one-tailed t test used).
Correlation analysis (two-tailed) for the entire study group showed a significant inverse relationship between exposure to atypical neuroleptics and basal ganglia volume change (rs=–0.46, df=21, p<0.03) and a significant positive relationship with typical neuroleptics (rs=0.47, df=21, p<0.03). Using multiple regression analysis, we found that the overall basal ganglia volume change was not significantly accounted for by volume change of any one component structure, although direction of volume change (i.e., greater caudate and lenticular nucleus volume with typical neuroleptic exposure and the reverse with exposure to atypical neuroleptics) was in each case consistent with the model anticipated for that particular class of drug.
DISCUSSION
The basal ganglia structures mediate many of the cognitive and behavioral processes disrupted in schizophrenia
(4,
6–
8,
22). Because of their high density of dopamine D
2 receptors, the basal ganglia structures are a major target to which dopaminergic pathways project. For many years, the clinical pharmacology of schizophrenia has been based on the use of dopamine receptor antagonists as a treatment modality. Typical neuroleptics show a markedly higher dopamine D
2 receptor affinity and occupancy than do atypical neuroleptics
(23–
27), whose efficacy may also be related to their high degree of 5-HT
2 occupancy
(25).
Studies of the relationship between striatal volume and neuroleptic exposure have steadily evolved since Chakos et al.
(10) examined caudate nuclei in patients with first-episode schizophrenia who had minimal previous exposure to neuroleptics. Following 18 months of treatment with typical neuroleptics, a significant volume increase was observed in the caudate nuclei of patients versus comparison subjects, and this finding was attributed to the effects of neuroleptic drugs on the dopaminergic system. In this study, all drugs were in the typical class
(10). This finding has been replicated
(11,
13), and Chakos et al.
(16) extended their original study to observe patients switched from typical neuroleptics to the atypical neuroleptic clozapine, finding a decrement in caudate volumes of as much as 10% after a 1-year exposure. This result has been replicated in a small group of patients with childhood-onset schizophrenia
(9).
Functional imaging studies from our center suggest that neuroleptic treatment is associated with changes in basal ganglia perfusion and that perfusion changes differentially depending on the class of medication—typical or atypical. Vascular engorgement resulting from the greater perfusion could lead to a noticeable volume change
(14,
15). It is also possible that these differential effects could result in differences in receptor size or receptor proliferation. On an ultrastructural level, the greater number of dopamine D
2 receptors in the basal ganglia of patients with schizophrenia has been a replicable finding in postmortem neurochemical studies of schizophrenia
(28). Such an increase in receptor density is considered by many to be a consequence of neuroleptic treatment and has been shown to occur in animals
(8,
29) as well as humans
(25,
30,
31) following chronic exposure to typical neuroleptic medication.
In this group of 23 male patients, we confirm in a within-subjects study design that basal ganglia volumes of patients with schizophrenia, as measured over a 2-year period, change in response to neuroleptic exposure and that the direction of the change differs for typical and atypical neuroleptics. The direction of the volume change correlates with the overall class of neuroleptic used. Basal ganglia volume across the entire study group of 23 patients increased following treatment with typical neuroleptics and decreased following treatment with atypical neuroleptics.
When we examined the major basal ganglia substructures separately, none was found to contribute significantly in itself to the overall basal ganglia volume change. However, component structures of the basal ganglia are now often highlighted as being different with regard to dopamine D
2 receptor structure and function
(22,
23,
32), and various studies reporting basal ganglia volume increase have reported a differential increase for the major substructures
(1,
4,
5,
9,
32).
Finally, another aspect that remains unclear is whether the volume decrement observed in the basal ganglia once medication is changed from typical to atypical neuroleptics is a direct effect of treatment with atypical neuroleptics or whether withdrawal of typical neuroleptics in and of itself results in the same shrinkage pattern
(9,
16). This question has so far been difficult to answer, because virtually no patient in any of the studies reported to date has been treated solely with atypical neuroleptic medication without first having had some previous exposure to the typical class. A case-by-case inspection of our study group gives modest preliminary evidence that atypical neuroleptics could produce basal ganglia volume decrement in and of themselves and not merely as part of a reversal of the mechanism instituted by typical neuroleptics. Four of our patients who had received relatively minor doses of typical neuroleptics at intake (0.43–3.33 dose years) were then switched to atypical neuroleptics, receiving large doses of atypical medication (between 4.73 and 21.67 dose years). These were the four patients who experienced the largest basal ganglia volume decrements (–1.41 to –2.69 cc). Further studies of a larger number of patients exposed solely to atypical medication are needed to elucidate whether this occurs consistently and, if so, what type of mechanism could be responsible for basal ganglia volume shrinkage as an ab initio response to atypical neuroleptic medication.