Anxiety disorders and alcoholism are intimately associated. Anxiety disorders are especially prevalent in groups of alcoholic subjects
(1,
2), and rates of alcoholism are greater among patients with anxiety disorders
(3–
5). Epidemiological studies find substantial comorbidity between alcohol use and anxiety disorders
(6–
8), especially social phobia
(1,
3,
7–
9). Six main explanations for the association between social phobia and alcoholism have been considered. 1) Individuals with social phobia drink alcohol because it reduces social anxiety by a direct psychopharmacologic effect
(10). 2) Individuals with social phobia drink alcohol because they think it will reduce anxiety
(11). 3) Individuals with social phobia are genetically predisposed to both anxiety disorders and alcoholism
(12). 4) Individuals with social phobia have an acquired neurochemical disturbance that predisposes them to alcoholism
(13). 5) Alcohol withdrawal serves as a kindling mechanism for excessive social anxiety
(14). 6) Alcoholism is secondary to problems that accompany anxiety disorders, such as depression, personality disturbances, or problems at work or home
(15).
Specific phobias, by contrast, do not increase the risk of alcoholism
(6–
9), a finding that is consistent with two experimental studies that found no reduction in specific phobic anxiety after consumption of alcohol
(16,
17). Does alcohol reduce social anxiety? Naftolowitz
(18), in a preliminary study of individuals with social phobia and normal comparison subjects, found no reduction in social anxiety during a public speaking task after a moderate dose of alcohol. The present study further investigates the effect of alcohol on social phobic anxiety experienced during an impromptu speech by using a larger group of subjects with social phobia, improved methods of beverage administration, and a challenge that involved continuous public speaking. In addition, the present study allows differentiation of the effect of believing that one received alcohol, as distinct from actually receiving it, on social phobic anxiety.
METHOD
Subjects
Forty subjects (39 Caucasian, one African American), aged 21 to 60 years, participated in the study. After complete description of the study to the subjects, written informed consent was obtained. Most subjects (N=32) were recruited from a pool of patients with suspected social phobia who were seeking (N=10) or currently receiving (N=22) treatment for social anxiety at the University of Michigan Anxiety Disorders Program. The other eight subjects were recruited at an anxiety disorder screening event for the public or by word of mouth. The study group consisted of 26 men and 14 women with a mean age of 29.78 years (SD=6.08) and a mean age at onset of social phobia of 11.5 years (SD=5.78). All subjects were fearful of public speaking and met the criteria of the Structured Clinical Interview for DSM-III-R (SCID)
(19) for social phobia (36 generalized, four specific—public speaking). Subjects were paid $90 for their participation in the study. Exclusion criteria included a lifetime history of DSM-III-R substance use disorder, schizophrenia or organic mental disorder, current primary axis I disorder other than social phobia, any active acute or chronic medical condition, history of adverse reaction to alcohol, current pregnancy or lactation, childbearing potential without use of oral or barrier forms of contraception, and use of medication that would contraindicate a single moderate dose of alcohol. Ten subjects, nine from the placebo group and one from the alcohol group, were taking psychotropic medications for their social phobic complaints. These were clonazepam (N=3), clomipramine (N=1), paroxetine (N=1), imipramine (N=1), imipramine plus clonazepam (N=1), amitriptyline plus fluoxetine (N=1), sertraline plus buspirone (N=1), and clonazepam plus sertraline (N=1). All patients taking clonazepam were using the medication as needed and did not take a dose within 24 hours of arriving at the study center.
Diagnostic Assessment
In addition to the SCID interview, the following inventories with established reliability and validity were administered: the Brief Social Phobia Scale
(20), the CAGE questionnaire
(21) measuring history of problematic drinking, the Beck Depression Inventory
(22), and the Brief Symptom Inventory
(23). In addition, subjects completed the Drinking Habits Questionnaire, which has not been formally tested for reliability and validity. With this instrument, subjects report their current drinking levels (one drink/day or fewer, two to four drinks/day, five or more drinks/day), how long they have been drinking at this rate, and whether they have a history of heavy drinking. Several subjects met SCID criteria for one or more other psychiatric conditions (major depression, N=12, lifetime; N=1, current; dysthymia, N=3, lifetime; N=3, current; panic disorder, N=5, lifetime; N=4, current; panic disorder with agoraphobia, N=2, lifetime; N=2, current; generalized anxiety disorder, N=2, lifetime; N=2, current; simple phobia, N=4, lifetime; N=4, current; obsessive-compulsive disorder, N=5, lifetime; N=1, current; anorexia nervosa, N=1, lifetime; N=0, current; bulimia, N=1, lifetime; N=0, current; and hypochondriasis, N=1, lifetime; N=1, current). Subjects scored in the moderate to severe range of social phobia, as measured by the Brief Social Phobia Scale (mean total score=41.60, SD=12.70). The Beck Depression Inventory indicated that most subjects were not experiencing significant symptoms of depression (Beck Depression Inventory mean total score=8.82, SD=6.00).
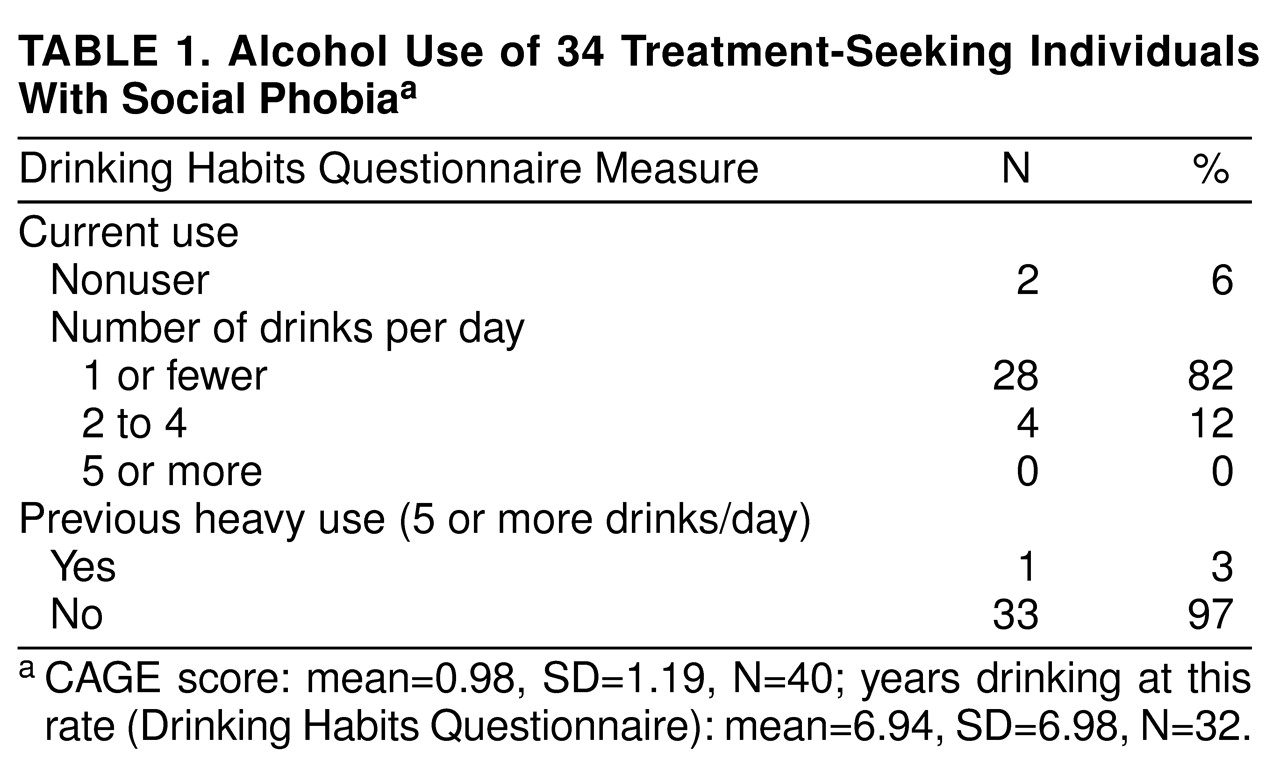
Table 1 presents data related to the subjects’ alcohol use. The CAGE questionnaire and the Drinking Habits Questionnaire indicated that the majority of subjects drank no more than one drink daily, and the mean CAGE score was far below a level indicating drinking problems.
Study Design
This study used a repeated measures design, with two impromptu speaking challenges in a single experimental session. Each challenge consisted of four phases: 10 minutes of adaptation, 3 minutes of anticipation, 10 minutes of speaking, and 10 minutes of recovery. One-half (N=20) of the subjects, chosen at random, received placebo drinks resembling alcoholic beverages before both speaking challenges. The other subjects (N=20) received placebo before the first speaking challenge and beverages containing a moderate dose of alcohol before the second. Anxiety was expected to be lower during the second speech because of some habituation to the challenge. If alcohol reduces social anxiety, the group receiving alcohol should have shown a greater reduction in subjective anxiety, physiologic arousal, and duration of speaking interruptions from the first to the second speaking challenge.
Dependent Measures
A modified version of the Subjective Units of Distress Scale
(24) was used to assess subjective anxiety before, during, and after the speaking trials. The subjective anxiety scale ranged from 0 to 10, with 10 indicating extreme anxiety. The Social Interaction Self-Statement Test
(25), a second self-report measure that provides a positive and negative self-statement score on the basis of responses to 15 statements, was also administered. Self-statements (e.g., “I hope I don’t make a fool of myself,” “I am really afraid of what they’ll think of me”) are thought to be important factors influencing social anxiety
(26). Previous research has supported the validity of this measure as a method of assessing cognitions during a speech task
(27).
The length of time the subject was able to speak was used as a behavioral measure of anxiety. Failure to continue speaking throughout the entire speaking period was considered an indicator of high anxiety.
Heart rate correlates well with other indicators of social anxiety
(27,
28) and was measured in this study by using computer-interfaced biofeedback equipment (model MP100WS, Biopac Systems, Inc., Santa Barbara, Calif.).
Mediating Variables
Subjects rated their intoxication level by using a Likert-type scale ranging from 0 (not at all intoxicated) to 10 (extremely intoxicated). Subjects estimated the amount of alcohol they received by using a second scale ranging from 0.25 oz (one-quarter of a mixed drink) to 5 oz (five mixed drinks). Subjects were categorized as believing they received alcohol if they estimated receiving at least 0.5 oz of alcohol and gave a rating of 2 or more on the subjective intoxication scale following the completion of the recovery phase.
Beverage Manipulation
The placebo drinks consisted of 8 oz of grapefruit juice, 0.33 ml of water/kg of body weight (matching the volume of vodka in the alcoholic drinks), three ice cubes, and 3 cc of 100-proof vodka rubbed on the rim and layered on the top of the ice and grapefruit juice mixture. Other studies have used a similar procedure to produce an alcoholic placebo drink
(29). Before drinking the placebos, subjects were asked to gargle with a small amount of mouthwash (10 cc) in order to attenuate taste acuity. Other studies have successfully used a similar technique in order to enhance the credibility of the placebo condition
(30,
31). The amount of alcohol contained in the placebo drinks was not sufficient to be detected by a Breathalyzer test.
The alcoholic drinks contained 1 ml of 100-proof vodka for each kilogram of body weight (equal to 0.5 ml of absolute alcohol/kg of body weight). The dose of alcohol given in this study is similar to doses given in studies where alcohol appeared to reduce anxiety
(32–
34). A 1-ml/kg dose of 100-proof vodka is roughly equivalent to two mixed drinks for a 130-lb person and about three mixed drinks for a 190-lb person.
The drinks were administered by pouring the entire amount of alcohol or water to be given into 24 oz of grapefruit juice, which was then split into three equal-sized drinks. Ice was added, and in accordance with the method of Levenson et al.
(29), the drinks were administered over a 45-minute period. The first drink was given to the subject at the beginning of the 45-minute drinking period, the second at the 20-minute mark, and the third after 40 minutes. All drinks were administered immediately after the subjects gargled with mouthwash. Subjects were asked to drink the beverages as quickly as possible (most subjects finished each drink within 90 seconds). The purpose of drinking quickly and diluting the alcohol in a large amount of grapefruit juice was to make it more difficult to ascertain how much alcohol was contained in each drink. The 45-minute period of drinking allowed for consistent absorption, with the peak blood alcohol level reached approximately 20 minutes after the consumption of the last drink
(29). The peak blood alcohol level was planned to match the beginning of the speaking period.
Procedure
On the day of the study, subjects were reminded that alcohol would be administered and were informed that neither the research assistant (H.H.) who was administering the drinks nor they themselves would know how much alcohol was in each drink. Subjects were told that they would be informed regarding the amount of alcohol that they had received at the end of the study. Subjects had been asked to fast (apart from liquids) for 2 hours before arriving at the study center. Since the alcohol was not given until over 2 hours had passed after their arrival, a 4-hour period of fasting (apart from grapefruit juice) was completed before alcohol intake.
After the first 45-minute drinking period (placebo for all) was completed, the subjects were escorted to a separate room and seated at a small table across from seats for three audience members. A video camera and tripod were positioned directly opposite the subject. Subjects were instructed in the use of the subjective anxiety scale, which was affixed to the table in front of them, and physiologic monitoring equipment was connected.
The 10-minute adaptation phase was begun by starting the videotaping and physiological monitoring equipment and obtaining the first subjective anxiety rating. Heart rate was monitored continuously, and subjective anxiety ratings were obtained at the 5-minute midpoint and at the 10-minute end point of the adaptation phase. Subjects were asked to avoid speaking or moving during this period. After the adaptation phase, the anticipation phase was begun by giving five cards to the subject, each describing one potential topic to use in the speaking phase. Topics included questions about current and family events (topics are available from Dr. Himle on request). Subjects were instructed to study each topic and were informed that after 3 minutes they would be asked to give a 10-minute speech on as many of the topics as they wished to an audience of three individuals. Physiologic monitoring was conducted continuously, and a subjective rating of anxiety was obtained 20 seconds after the onset and at the end of the 3-minute anticipation period.
Following the anticipation period, blood alcohol levels were obtained by using an Alcosensor III Breathalyzer test (Intoximeters Corporation, St. Louis). Two individuals (at least one of whom had never been seen by the subject) then entered the study room and sat down. The experimenter (J.A.H.) and these two individuals formed an audience of three. Each audience included at least one male and one female member. The subject was asked to begin speaking and to attempt to continue speaking until the 10-minute speaking period had expired. The audience members were dressed in white lab coats and were completely unresponsive to the speaker to enhance the anxiogenic pressure. Physiological monitoring continued, and subjective anxiety ratings were obtained every 2 minutes during the 10-minute speaking period. If the subject stopped speaking for a period of 20 seconds, the experimenter would say, “You can use as many of the topics as you wish. You may go back to a topic also if you wish.” After 10 minutes, the subject was instructed to stop and begin a 10-minute recovery phase, and the audience members who were not experimenters were excused. Physiological monitoring continued, and subjective anxiety ratings were obtained at the beginning, at the 5-minute midpoint, and at the end of the recovery phase.
After completion of the first recovery phase, subjects were escorted to the beverage room and given inventories related to the alcohol they received and their cognitions during the speech. After the inventories were completed, a 1-hour break was given. Patients were instructed that the purpose of the break was to allow any alcohol they received before the first speech to leave their system. This practice was designed to enhance the credibility of the experimental design and the placebo beverages.
After the 1-hour break, a second 45-minute drinking period was administered with one-half of the subjects receiving alcohol and one-half receiving placebo. Following this drinking period, the second adaptation, anticipation, speech, and recovery phases were completed. These phases were conducted in a similar fashion to those for speech one, with the same audience. The topics in speech two were similar to those used in speech one. Following the second recovery period, inventories regarding the alcohol received and cognitions experienced were again administered, and a Breathalyzer measurement was taken. The subjects who did not receive alcohol were excused, whereas those who did receive alcohol were asked to remain at the study center until their blood alcohol level dropped below 0.02 mg/ml.
Statistical Analysis
Analysis of variance (ANOVA) for repeated measures, Student’s t tests, and chi-square analyses were used as indicated. In some repeated measures analyses, the numbers of data points available for each phase of a given speaking trial were not equal (e.g., two measures of subjective anxiety and 3 minutes of heart rate monitoring during the anticipation phase compared with five measures of subjective anxiety and 10 minutes of heart rate monitoring during the speaking phase). Given that repeated measures analyses require equal numbers of observations for each experimental phase, random selection of the available data points was used to produce equal numbers/durations of observations across the various phases of the speaking trials. Only statistically significant and especially important nonsignificant results of repeated measures analyses are reported.
RESULTS
Tests of Randomization
Random assignment to receive either alcohol or placebo was performed separately for men and women in order to balance the sex ratios of the two groups. The groups did not significantly differ on marital status (χ2=0.10, df=1, p=0.75, N=40), mean age (t=0.96, df=38, p=0.34), mean age at onset (t=1.10, df=36, p=0.28), comorbid DSM-III-R diagnoses, CAGE questionnaire ratings (t=1.25, df=38, p=0.22), any of the three components of the Drinking Habits Questionnaire (current use: χ2=0.68, df=1, p=0.71, N=34; years drinking at current rate: t=0.05, df=30, p=0.96; and previous heavy use: χ2=1.31, df=1, p=0.25, N=34), or any other psychometric measure, with the exception of the physical symptom subscore of the Brief Social Phobia Scale (t=2.06, df=38, p=0.05). However, with Bonferonni’s correction, that result was no longer significant. These results indicate that random assignment was effective in producing similar groups.
Independent Variable Manipulation
The 20 subjects who received the 1-ml/kg dose of 100-proof vodka consumed an average of 70.59 ml (SD=11.88) of alcohol. Their mean peak blood alcohol level was 0.03 mg of ethanol/100 ml of blood. Subjects in the two groups did not significantly differ in their perception of the alcohol received before speech one (when all received placebo). The mean amount of alcohol they believed they received was 0.80 drinks for the alcohol group and 1.25 drinks for the placebo group (t=1.24, df=38, p=0.22). Mean subjective intoxication scores were 1.4 for the alcohol group and 1.8 for the placebo group (t=0.91, df=38, p=0.37). The rate of falsely believing that they received alcohol before speech one was 45% (N=9) for the alcohol group and 50% (N=10) for the placebo group (χ2=0.10, df=1, p=0.75, N=40).
The groups differed in the amount of alcohol that subjects believed they received before the second speech (t=2.42, df=38, p=0.03). The alcohol group estimated an average of 1.46 drinks (SD=0.8) received compared with 0.79 drinks (SD=0.97) for the placebo group. Mean subjective intoxication levels obtained after the second speaking trial also differed between groups (alcohol group=2.93, placebo group=1.70; t=2.40, df=38, p=0.02). More subjects from the alcohol group (80%, N=16) believed they received alcohol before challenge two compared with the placebo group (50%, N=10), but this difference was not significant (χ2=2.75, df=1, p=0.10, N=40).
Alcohol Versus Placebo
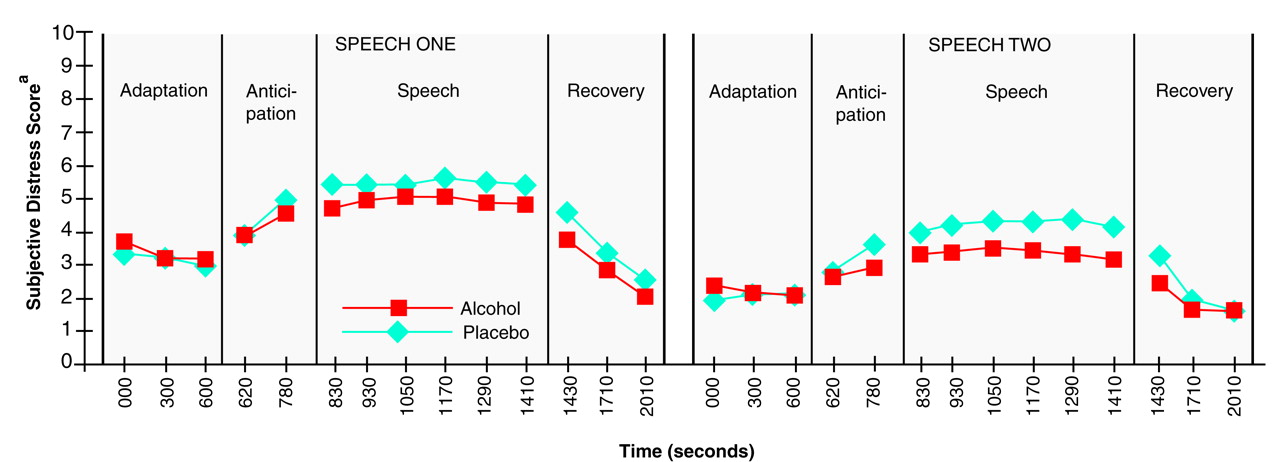
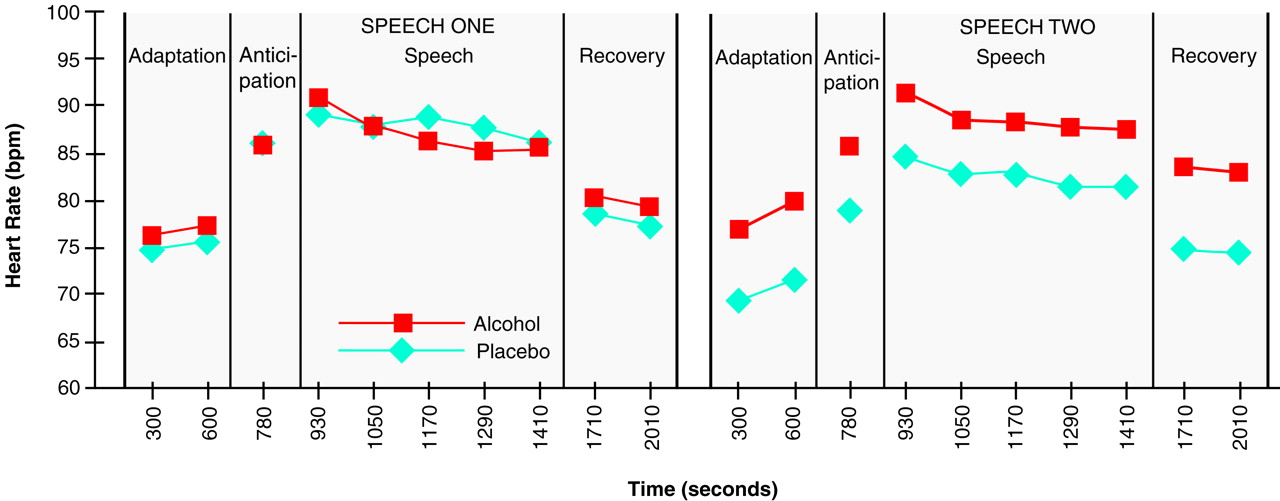
Figure 1 and
Figure 2 are graphic displays of subjective anxiety ratings and heart rates experienced during the two four-phase trials for the alcohol and placebo groups. Overall, a significant main effect of the speeches on subjective anxiety (F=62.44, df=1, 38, p=0.0001) was found, indicating that, as expected, anxiety experienced during the first speaking challenge was greater than that experienced during the second. A significant main effect of time period was also found for the subjective anxiety rating (F=28.13, df=7, 266, p=0.0001) and heart rate (F=42.12, df=3, 144, p=0.0001). The amount of anxiety was greatest during the speaking periods, moderate during the anticipation phases, and lowest during the adaptation and recovery periods. Subjective anxiety rating and heart rate did not differ significantly between the alcohol and placebo groups. The repeated measures analysis did not reveal a significant main effect on subjective anxiety of group (F=0.41, df=1, 38, p=0.53) or the speech-by-time-period-by-group interaction (F=1.22, df=7, 266, p=0.29). As for heart rate, the repeated measures analysis also did not reveal a significant main effect of group (F=0.96, df=1, 38, p=0.33) or for the speech-by-time-period-by-group interaction (F=0.53, df=3, 114, p=0.66).
Negative and positive cognitions were evaluated by using the Social Interaction Self-Statement Test. Speech one produced greater mean negative and lower mean positive Social Interaction Self-Statement Test subscores than speech two. Significant main effects of speech on positive (F=32.60, df=1, 28, p=0.0001) and negative (F=3.99, df=1, 28, p=0.06) cognitions were found. Alcohol did not have a detectable effect on negative (group: F=0.46, df=1, 28, p=0.51; group-by-speech interaction: F=0.93, df=1, 28, p=0.34) or positive (group: F=2.39, df=1, 29, p=0.13; group-by-speech interaction: F=0.64, df=1, 29, p=0.43) cognitions.
Nearly all subjects spoke the entire 10 minutes of each of the two speaking periods, so comparisons of time speaking were not meaningful.
Intoxication and Drinking History Effects
The influence of intoxication level and drinking history on subjective anxiety ratings and heart rates was investigated by using only those subjects who actually received alcohol before speech two. The subjects were classified into two groups: those above (N=12) and those below (N=8) the mean score on the intoxication scale described previously. Intoxication level did not significantly influence the subjective anxiety rating or heart rate experienced during the second speech. Neither the main effects (subjective anxiety, group: F=0.20, df=1, 18, p=0.66; heart rate, group: F=0.20, df=1, 18, p=0.66) nor the interaction were significant (subjective anxiety, group-by-time-period-by-speech: F=0.57, df=7, 126, p=0.78; heart rate, group-by-time-period-by-speech: F=0.96, df=3, 54, p=0.42).
Drinking history did not significantly influence the effect of alcohol on social anxiety. By means of the Drinking Habits Questionnaire, subjects were classified into two groups: those scoring below (N=8) and those scoring above (N=7) the mean. No significant main or interaction effects on subjective anxiety rating (group: F=0.003, df=1, 13, p=0.96; group-by-time-period-by-speech: F=0.95, df=7, 91, p=0.47) or heart rate (group: F=0.46, df=1, 13, p=0.51; group-by-time-period-by-speech: F=0.45, df=3, 39, p=0.72) were found.
Beliefs About Receiving Alcohol
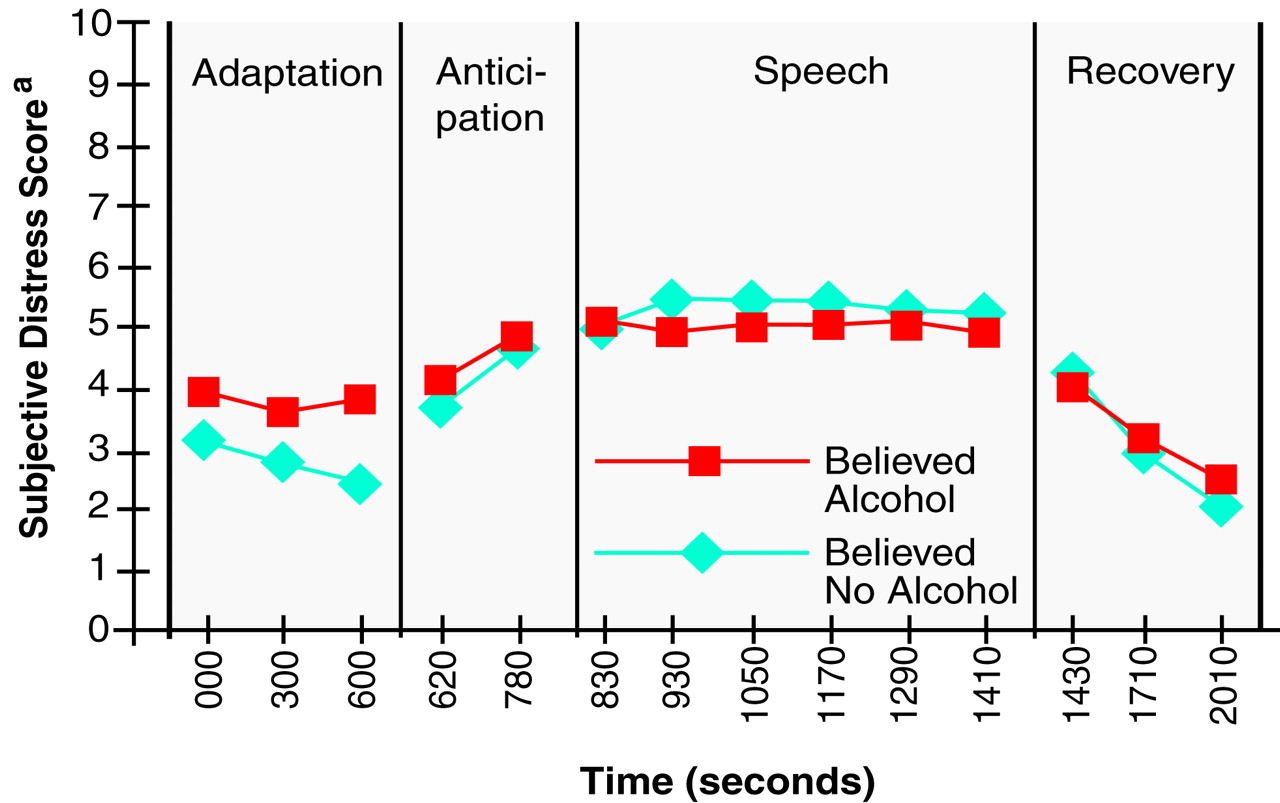
The effects of believing one received alcohol were examined by using data from speech one only, since no alcohol was consumed before this period. Repeated measures ANOVAs were used to test whether those who were fooled into thinking they received alcohol before speech one (N=19) experienced less subjective anxiety, fewer negative cognitions, more positive cognitions, and lower heart rate during speech one than those who accurately estimated the amount of alcohol they received (N=21). Subjects who believed that they received alcohol reported subjective anxiety ratings that significantly differed from those of subjects who believed that they did not receive alcohol (group: F=0.31, df=1, 38, p=0.58; group-by-time period: F=2.24, df=7, 266, p=0.03). The significant interaction effect and
Figure 3 indicate that those who believed they received alcohol had greater anticipatory anxiety and a smaller increase in anxiety from adaptation to the speaking phase. Negative cognitions (t=2.21, df=30, p=0.03) were less prevalent among those who believed that they received alcohol (mean score=36.13, SD=8.28) than among those who did not believe that they received alcohol (mean score=45.88, SD=15.16). The level of positive cognitions (t=0.62, df=30, p=0.54) and heart rate (group: F=1.06, df=1, 38, p=0.31; group-by-time period: F=1.26, df=3, 114, p=0.29) did not significantly differ between the two groups.
DISCUSSION
The hypothesis that the subjects who received alcohol would experience a greater improvement in anxiety from speech one to speech two was not confirmed. Subjective anxiety ratings, mean heart rates, and positive and negative cognitions did not significantly differ between the alcohol and placebo groups. In addition, subjects’ drinking history and intoxication level did not significantly influence the effect of alcohol on subjective anxiety rating or heart rate. The failure of alcohol to reduce social anxiety is consistent with the results of Naftolowitz’s study of individuals with social phobia
(18) and other experimental studies of nonclinical subjects exposed to social stressors
(33,
35–
37).
The findings of the present study related to the effect of believing that one received alcohol are complex and difficult to interpret, but finding significant differences on two different measures of anxious response suggests that these expectancies did have an effect. Inspection of
Figure 3 indicates that the significant group-by-time interaction for subjective anxiety ratings was caused by a combination of high anxiety during the adaptation phase and a small increase in anxiety when they began to speak for subjects who believed that they had received alcohol. This suggests that the expectancy of an alcohol effect may have increased anticipatory anxiety but buffered anxiety in the midst of the performance task. The buffering impact of the belief that one received alcohol is supported by the significantly lower rate of negative self-perceptions in those who believed that they received alcohol than in those who did not. Perhaps the expectation of an alcohol effect allowed subjects to “blame” the alcohol for perceived performance deficits rather than attribute such deficits to themselves, but this cognitive shift had only a subtle impact on subjective emotional state. This interpretation is clearly speculative, and the findings could be caused by type II errors. But the possibility that any effect of alcohol on social anxiety is more of a cognitive/expectancy effect than a pharmacological/emotional effect is intriguing and deserves further study.
One issue of concern regarding the methodology used in this study rests on the inclusion of subjects who were taking medication. It is important to note that the main statistical analyses in this study rely on changes from speech one to speech two for each subject. Given this methodology, subjects essentially serve as their own comparison subjects, making the fact that some subjects were taking medication less problematic than seems apparent at first. However, two potential issues remain: 1) Did the medicated subjects experience altered intoxication levels because of drug-alcohol interaction? 2) Did the subjects taking medication experience a differential effect from their medication during speech one compared with speech two, thereby compromising intrapersonal control? Clearly, medication could influence the intoxicating effect of alcohol; however, since only one subject in the alcohol group was taking medication, this issue is not especially troublesome. With regard to medication affecting speech one differently from speech two, one potential issue is benzodiazepine withdrawal. If one were to consider subjects taking the long-acting benzodiazepine clonazepam to be in a different stage of withdrawal at speech one compared with speech two (2 hours apart), it is conceivable that their level of anxiety at speech two would have been artificially elevated. However, since nearly all subjects using medication were in the placebo group, elevated anxiety would have made it more likely to find a significant difference between the alcohol and the placebo groups, a result contrary to that found in the present study.
Three more important threats to the validity of the overall results of this study are the dose of alcohol administered, the nature of the study group of individuals with social phobia, and the type of social challenge presented. Although most subjects who received alcohol rated themselves as being moderately intoxicated, it is possible that the dose of alcohol used in this study did not fit into the therapeutic window where alcohol succeeds in reducing social anxiety. The same dose of alcohol also failed to reduce social anxiety in Naftolowitz’s study of individuals with social phobia and comparison subjects. However, it is important to note that similar doses have been found to reduce anxiety in other studies investigating the effect of alcohol on anxiety
(28,
37). It is also of interest that two previous studies at our center failed to find a substantially higher dose of alcohol effective in reducing specific phobic anxiety
(4,
17).
A second note of caution relates to the nature of subjects with social phobia. Excluding subjects with drinking problems from the study, for obvious ethical reasons, makes it possible that many of those who would have benefited from alcohol while speaking were excluded from the study. However, standing in contrast to this argument is the fact that the subjects with the greatest history of alcohol intake did not experience greater benefit from the alcohol that they received. A second issue related to the study group is the use of mostly treatment-seeking, clinical subjects. These results do not necessarily generalize to nonclinical individuals with social phobia in the community, who, on average, are less impaired with social fear
(38). However, it is difficult to conceive of a reason why more severely phobic individuals would benefit less from alcohol than would nonclinical individuals with social phobia. Interestingly, four of five experimental studies testing the effects of alcohol on nonclinical social anxiety found that alcohol failed to improve anxiety
(10,
33,
35,
37,
39).
Finally, the public speaking challenge used in this study limits the generalizability of the present results. Although Beidel et al.
(26) demonstrated that an impromptu speech is a reliable method of inducing anxiety among persons with social phobia, it is possible that anxiety associated with other stimuli (e.g., mock party, small gathering) would have been improved through a moderate dose of alcohol. However, using phobic situations other than speaking may create more problems than it solves, since such situations are not as commonly feared by individuals with social phobia
(12).
Another methodological consideration relates to some of the measurement tools used in this study. The value of heart rate as a dependent measure in this study may have been compromised by elevations in heart rate caused by the direct effect of ingesting alcohol
(28). It is possible that heart rate differences between the alcohol and placebo groups would have been found had heart rate not been artificially elevated during speech two for subjects who received alcohol. A second measurement issue relates to the standard used for classifying subjects as believing that they received alcohol (one-half of a drink and at least mild subjective intoxication). It is clear that using another standard for classifying subjects’ beliefs about receiving alcohol, or using other measures related to alcohol intake and intoxication levels, could have altered the results of this study.
A final methodological issue relates to statistical power. The statistical power in this study was sufficient to detect an alcohol effect size of 0.8 for the alcohol versus nonalcohol conditions. The effect of alcohol on subjective anxiety in this study was about half of 0.8. In order to detect an effect this small, a similar experiment would have to include 60 subjects in each group. Given this small effect size, it is reasonable to conclude that alcohol did not have a meaningful effect on subjective fear.
Moving beyond methodological considerations, one conclusion from this study is clear: alcohol does not always reduce social anxiety. It is important to note that the bulk of evidence to date suggests that alcohol rarely, if ever, reduces social anxiety. Nearly all studies of clinical individuals with social phobia and normal comparison subjects confronting socially frightening stimuli fail to find alcohol anxiolytic. Clearly, these results conflict with the popular perception that alcohol is a social lubricant by virtue of its ability to reduce anxious distress in social situations. Further studies, using different doses of alcohol and varied social phobic stimuli, are needed to more definitively conclude that this popular perception is wrong. Future studies should also more directly assess the impact of the expectancy itself on the cognitive and emotional components of social discomfort.
