Description of the Eligible Families
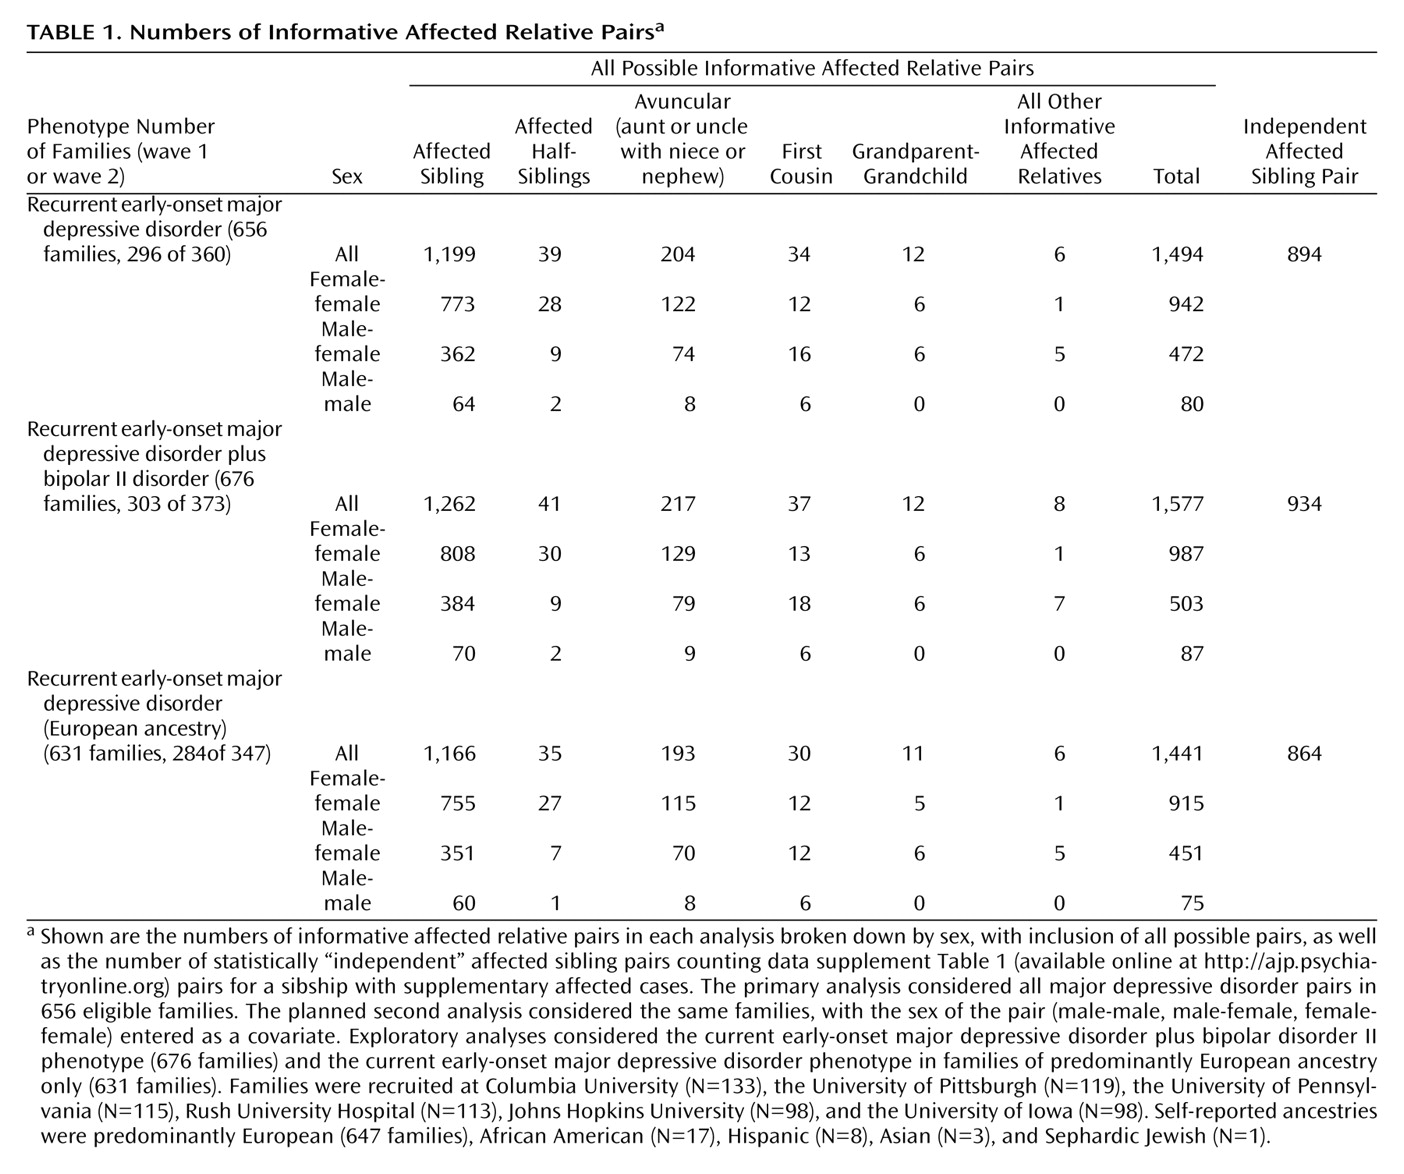
Table 1 shows the numbers of families and of affected relative pairs for the three sets of families used in the analyses (families that were informative with current early-onset major depressive disorder cases considered as affected, with bipolar II disorder cases added, or with current early-onset major depressive disorder only but restricted to European ancestry). All types of pairs were considered in the analyses. Three additional families were excluded (for identical or unrelated genotypes in the two siblings). The table note provides information about distribution of families by recruitment site and self-reported ethnicity. Our recruitment concentrated on families from a single broad ethnic group (Europeans) to reduce genetic heterogeneity, but volunteers with other ancestries were accepted.
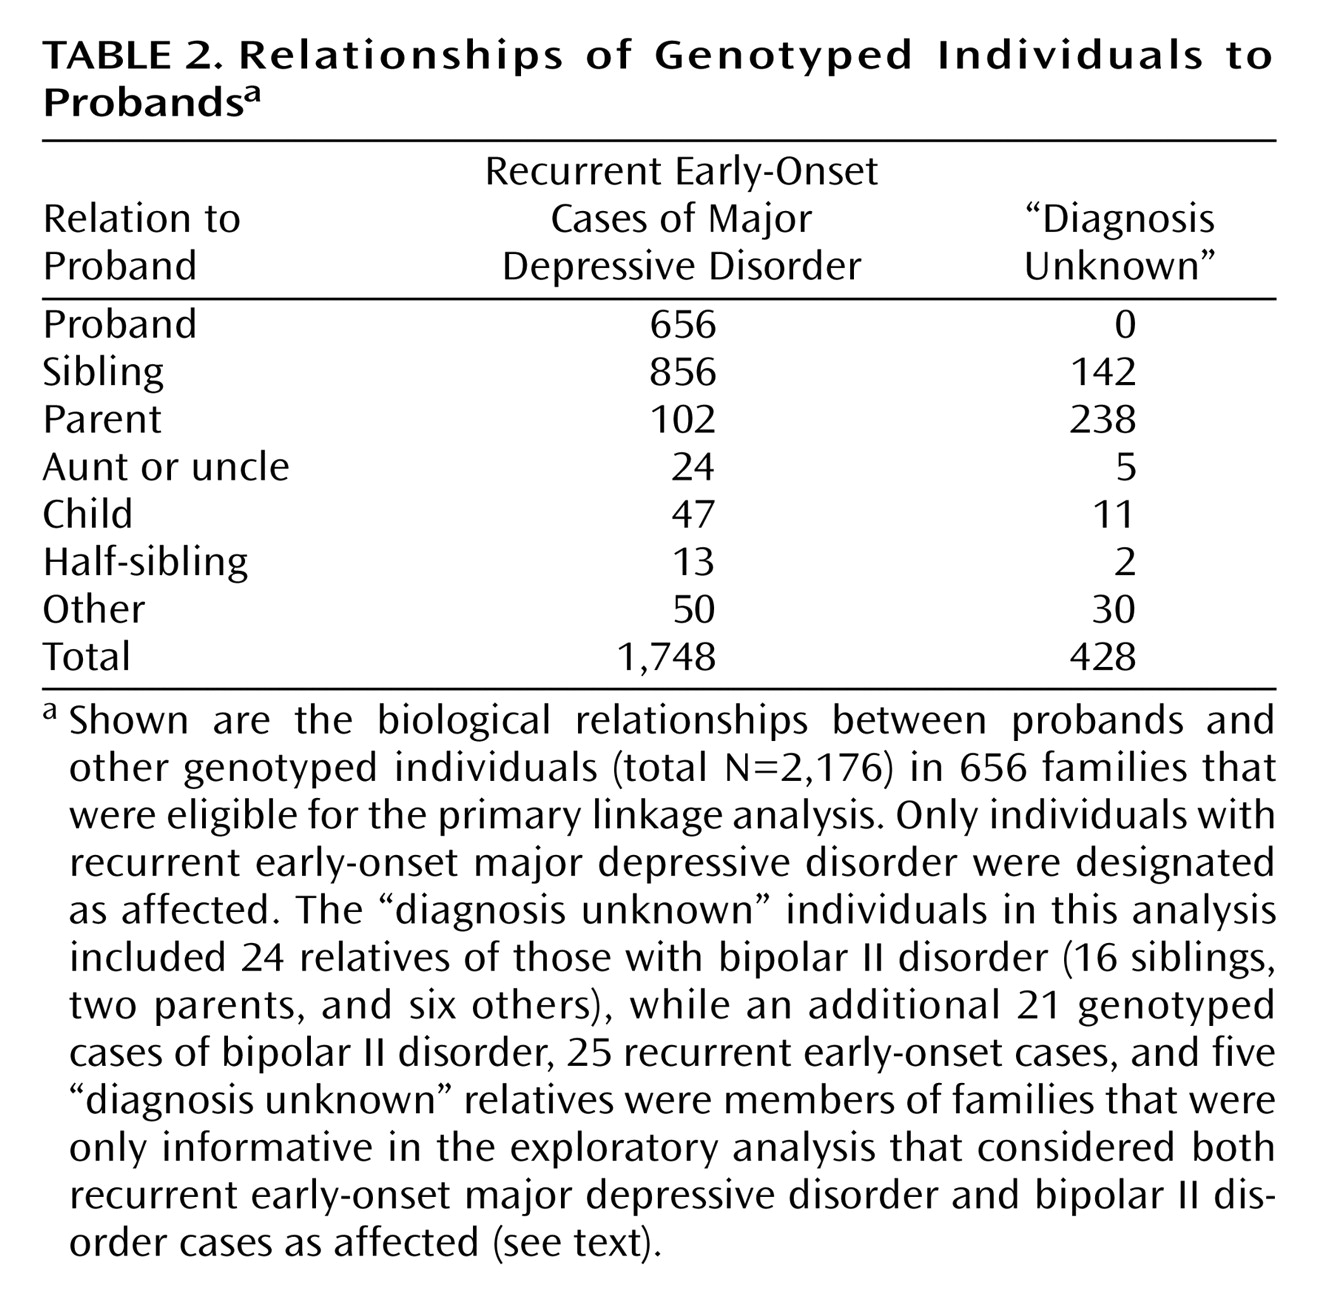
In the 656 families in the primary current early-onset major depressive disorder analysis, there were 1,748 affected, interviewed genotyped individuals, including 1,720 with recurrent major depressive disorder and 28 with one major depressive episode lasting 3 years or longer. The other 428 genotyped relatives were treated as “diagnosis unknown,” including 24 with bipolar II disorder and 404 who provided only blood specimens or were interviewed and received ineligible diagnoses. Relationships of family members to probands are shown in
Table 2 . In the 20 families that were eligible only when the bipolar II disorder cases were added, 51 individuals were genotyped (25 current early-onset major depressive disorder cases, including 20 probands and five parents, 21 bipolar II disorder siblings, and four siblings and one parent with “diagnosis unknown”).
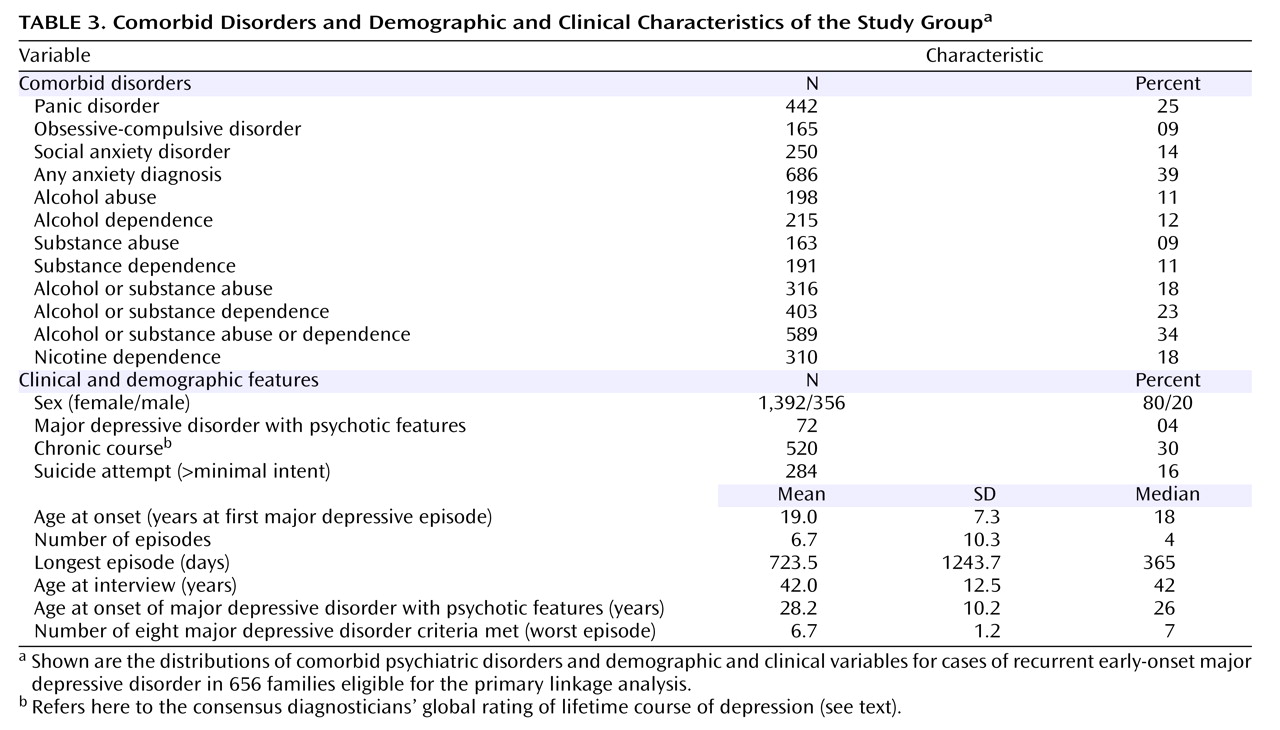
Table 3 provides information on comorbid disorders and on clinical, demographic, and course-of-illness variables. Cross-site interrater reliability and agreement of clinical ratings have been previously described
(31) .
Primary Linkage Analysis
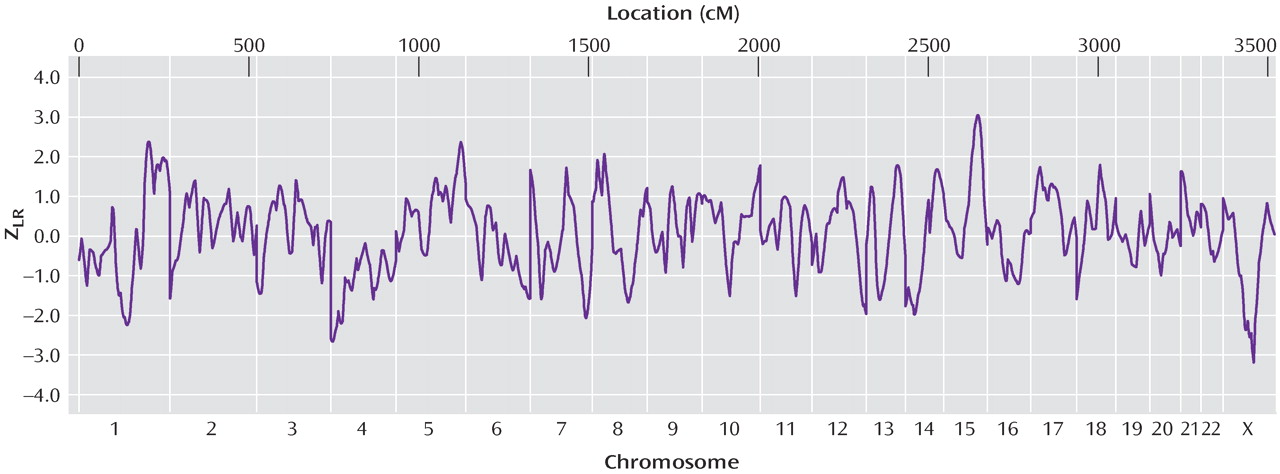
Figure 1 illustrates genomewide Z
LR for the primary linkage analysis.
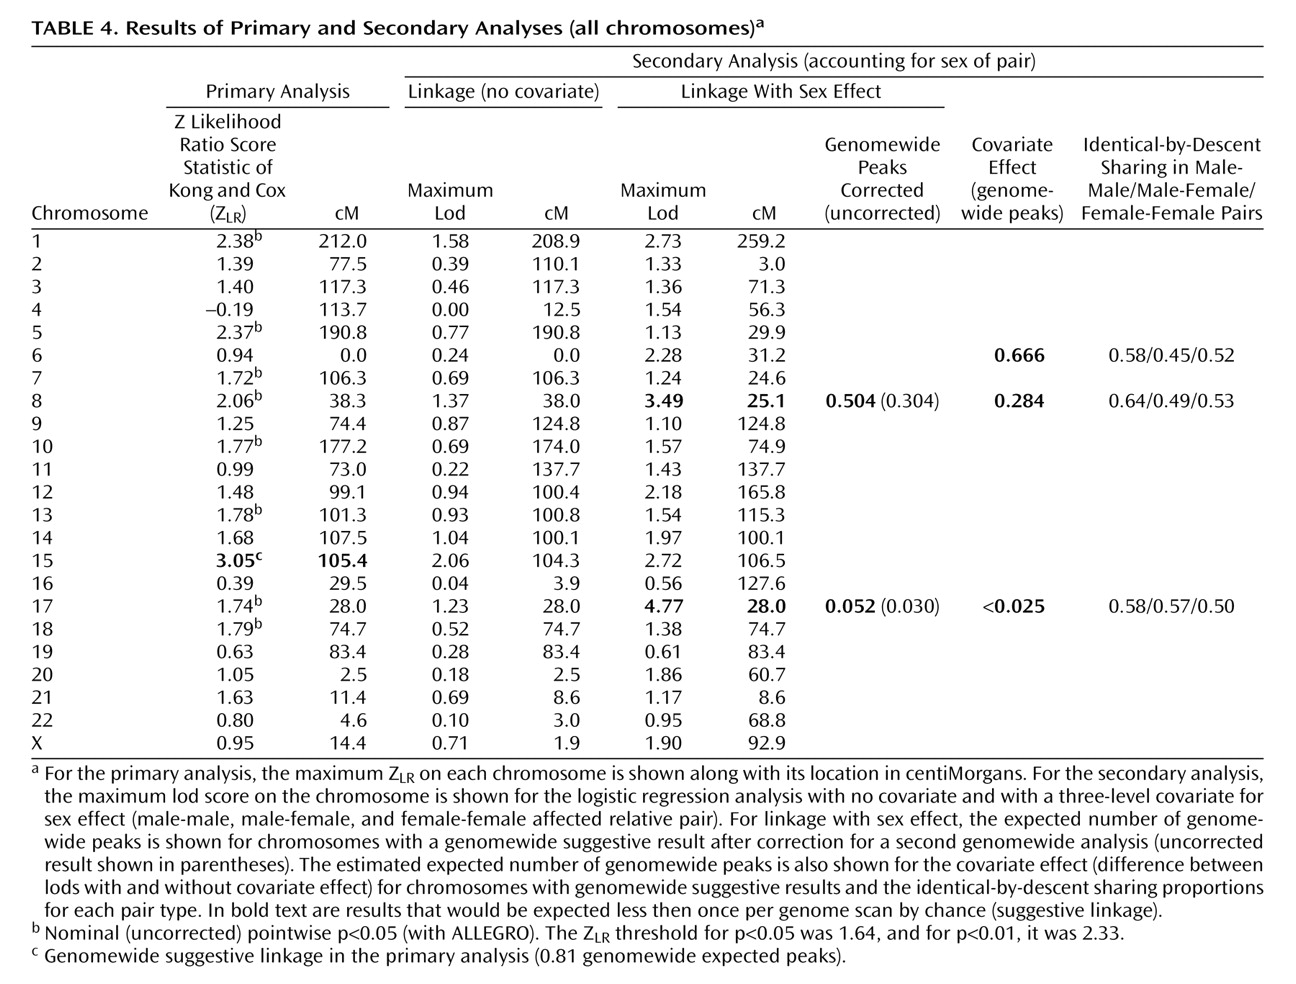
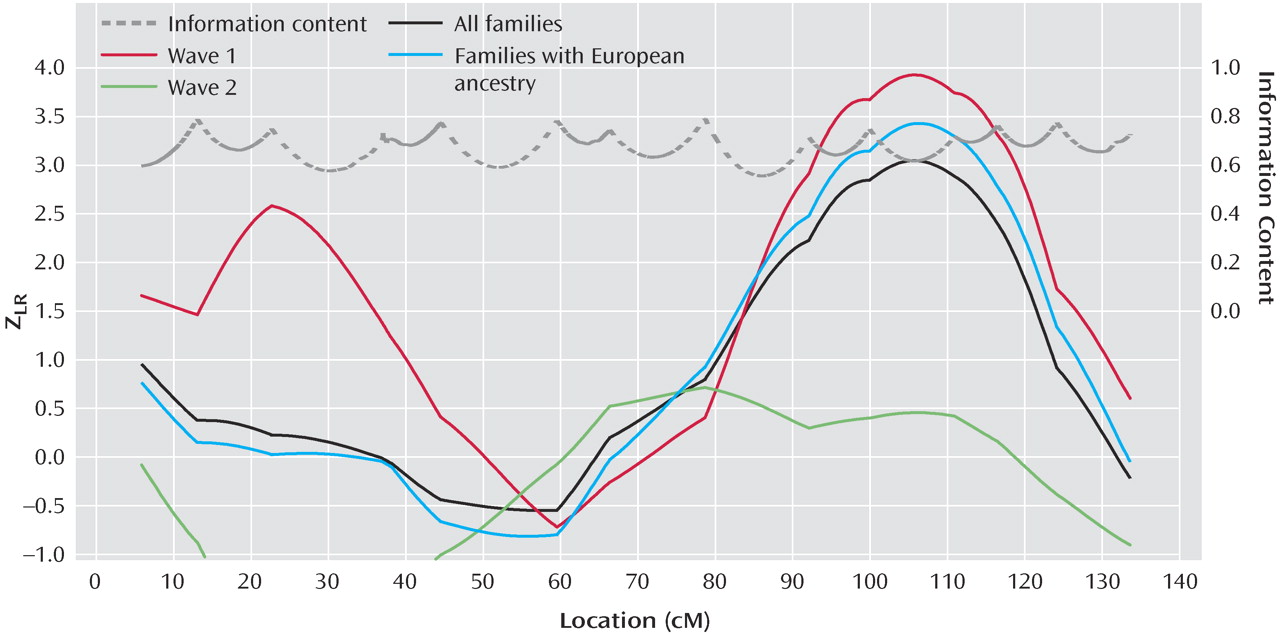
Table 4 shows the maximum scores on each chromosome. Genomewide suggestive linkage (a score expected by chance once or less per genome scan) was observed on chromosome 15q25-q26 at 105.43 cM, between markers D15S652 (99.9 cM, 90.247 megabase) and D15S816 (110.9 cM, 92.750 megabase). The genetic map is substantially different for men and women in this region, but similar results were observed when the analysis was repeated with sex-specific map distances (Z
LR =3.04, lod=2.0). Results are shown in
Figure 2 for 15q analyses for wave 1, wave 2, all families, and European families, and details are shown in data supplement
Table 1 and
Table 2 . We previously reported a wave 1 Z
LR of 4.14 at 103.2 cM on 15q
(1) . Here, with the group changes described above and in data supplement text, the Z
LR was 3.93 at 105.4 cM (0.049 expected genomewide false positive peaks). No nominally significant evidence for linkage was observed on 15q in wave 2. The analysis of all families was considered primarily a priori. Interpretation of this result must await linkage fine mapping. No other region produced genomewide significant or suggestive evidence for linkage. Linkage information content with ALLEGRO’s exponential measure averaged 0.699 across the genome (evaluating 10 points per interval) and 0.712 under the 15q peak (30 cM).
Linkage Analysis With Sex of the Pair as a Covariate
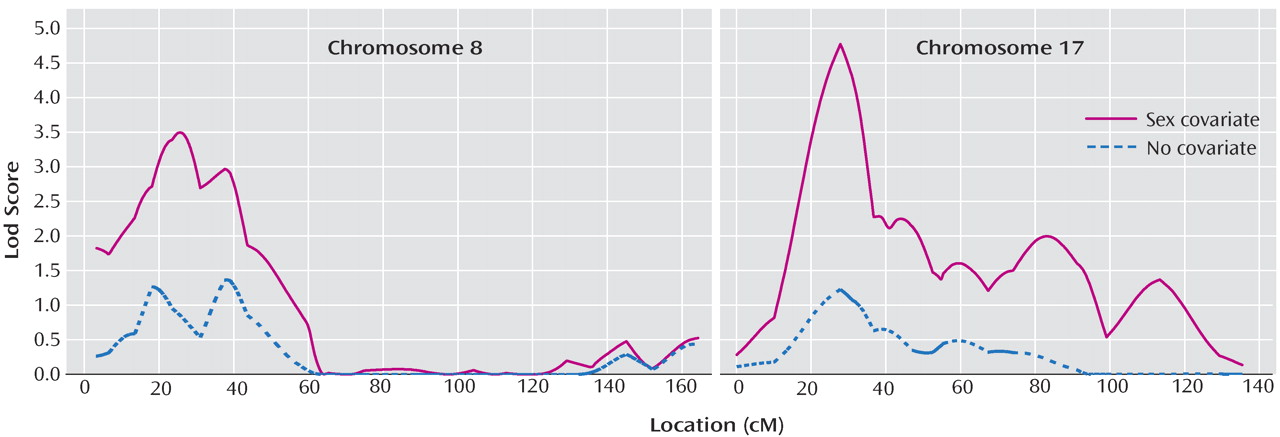
Table 4 and
Figure 3 summarize these results. For the primary outcome (“Linkage With Sex Effect”), the number of expected genomewide peaks of the observed size after correction for multiple testing was <1 for chromosomes 17p12 (28.04 cM near marker D17S974), which came very close to the genomewide 0.05 level, and 8p22-p21.3 (25.09 cM, near D8S1106). As shown in the last column of
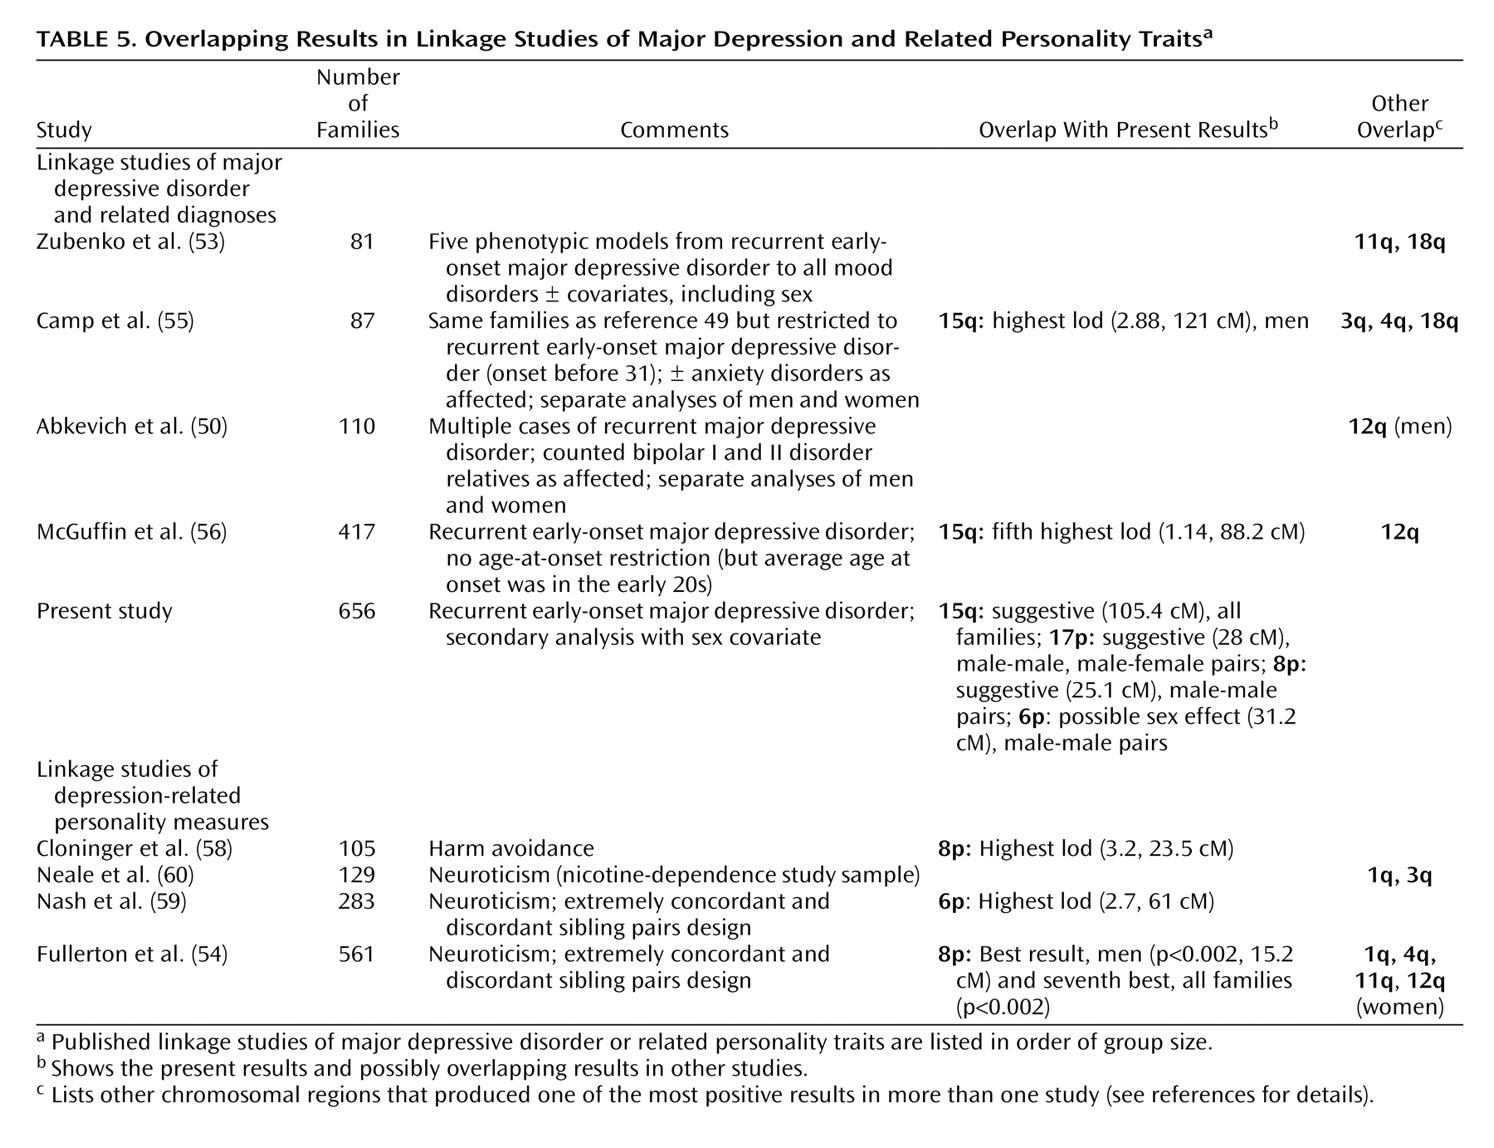
Table 5, increased identical-by-descent sharing was observed on 8p only in the small number of male-male pairs, while on 17p, it was observed in male-male and male-female pairs. Results on 8p and 17q were similar when sex-specific map distances were used to combine identical-by-descent sharing probabilities; with sex-averaged versus sex-specific maps, the difference between the lods allowing and not allowing for sex was 3.54 versus 3.47 for 17q and 2.12 versus 2.03 for 8p with almost identical identical-by-descent sharing probabilities. Without covariates, the lod score on chromosome 15 was suggestive, consistent with the primary analysis.
Estimated empirical significance is also shown for the covariate effect (how often one would observe by chance a given increase in lod score). Chromosome 6p (31.19 cM) produced a suggestive result with identical-by-descent sharing increased in male-male pairs and decreased below 50% in male-female pairs. This finding might be less plausible biologically, although in theory it could occur if an allele increased the risk of major depressive disorder in men and decreased it in women or if two or more loci in one region had different sex effects.
Exploratory Analyses
When bipolar II disorder cases were added, maximum scores for the primary analysis (data supplement
Table 3 ) and secondary analysis (data not shown) were similar but slightly lower. For example, the maximum Z
LR on chromosome 15q was reduced from 3.05 to 2.80. Note that only a few families had more than one case of bipolar II disorder, so separate linkage analyses of this disorder were not feasible.
Because allele frequency estimates can affect linkage scores when parental genotypes are unavailable
(45 –
49), inclusion of families from several ethnic backgrounds with different frequencies could bias the results. Thus, European families were analyzed separately. Scores were similar in most regions and were
higher on 15q: for wave 1, the Z
LR was 4.31 in European families (105.43 cM, genomewide expected peaks=0.014) versus 3.93 for all ethnicities; in all 631 European families, the Z
LR was 3.43 (106.53 cM, genomewide expected peaks=0.27) versus 3.05 (expected peaks=0.81) for all ethnicities. Similar increases were seen in secondary analyses (data supplement text and
Table 4 and
Table 5 ).
We also examined linkage with sex covariate effects on chromosome 12q, where significant linkage to mood disorders was reported in men at 110 cM
(50) . Here, identical-by-descent sharing was increased in male-male (0.59) versus male-female (0.52) and female-female (0.53) pairs from 100 cM to 113 cM, but this effect did not reach suggestive genomewide significance. Note, however, that in the 62 families that were informative for linkage when only male cases were considered affected, nominally significant evidence for linkage (i.e., without genomewide correction) was observed in the previously reported region, with the peak score at 97.84 cM (lod=0.86, p<0.03).
Clinical differences were observed between wave 1 and 2 families. Wave 1 cases had earlier age at onset (t=2.18, df=1713.7, p=0.03), more major depressive episodes (t=4.39, df=1769.5, p=0.00001), and more panic attacks (t=2.72, df=1673.3, p<0.007), whereas wave 2 cases were more likely to be rated as having a chronic course (χ 2 =11.26, df=1, p=0.0008), although the two sets of cases did not differ in substance dependence, abuse, or gender. However, these differences did not appear to predict chromosome 15q linkage. For example, when families from each site were analyzed separately, the Philadelphia and Pittsburgh sites produced the greatest evidence for linkage in wave 1, but for both sites, wave 1 cases had slightly older ages at onset (0.05<p<0.10 for each site), whereas all of the other variables mentioned were not significantly different except for more episodes occurring in wave 1 families for Pittsburgh but not Philadelphia. Comorbid diagnoses aggregated in families as expected in analyses of sibling-sibling concordance in independent affected sibling pairs, with significant odds ratios observed for panic disorder (odds ratio=2.16, 95% CI [95% confidence interval]=1.5–3.1); panic with agoraphobia (odds ratio=4.51, 95% CI=2.43–8.37); alcohol dependence (odds ratio=3.15, 95% CI=1.86–5.35), substance dependence (odds ratio=2.54, 95% CI=1.43–5.41), obsessive-compulsive disorder (odds ratio=2.66, 95% CI=1.21–4.22), nicotine dependence (odds ratio=2.46, 95% CI=1.59–3.82), and nicotine persistence (odds ratio=4.37, 95% CI=3.05–6.26). More detailed logistic regression analyses of the effects of clinical covariates on linkage results will be presented elsewhere.
No significant cross-site heterogeneity was observed for identical-by-descent sharing in affected relative pairs on chromosome 15q (maximum lod score assuming homogeneity=2.06 at 98.51 cM, identical-by-descent=0.537; maximum lod score assuming site heterogeneity=3.87 at 98.51 cM, p=0.41).
