In the preceding article
(1), we reported on a genome scan of 656 families with two or more genotyped cases of recurrent early-onset major depressive disorder with a map of microsatellite DNA markers (short tandem repeat polymorphisms) at an average spacing of 9 cM. In the primary analysis, the greatest evidence for linkage was observed on chromosome 15q25-q26 with a Z likelihood ratio score statistic of Kong and Cox (Z
LR )
(2) of 3.05 (Kong-Cox lod score of 2.02), with 0.81 false positive peaks of this size expected per genome scan (“suggestive” linkage). In the 631 families of predominantly European self-reported ancestry, the maximum result was a Z
LR of 3.43 (0.27 expected false positives). We have now detected genomewide significant evidence for linkage in this region in European families in a fine-mapping analysis with 88 single nucleotide polymorphisms (SNPs) spanning 45 centimorgans (cM) around the previous peak.
Results
The data set included genotypes from 2,161 European individuals, including 1,687 with diagnoses of recurrent early-onset major depressive disorder and 474 coded as “diagnosis unknown.”
Table 1 shows the numbers of each type of informative affected relative pair. There were 1,443 affected relative pairs, counting all possible pairs, with 864 “independent” affected sibling pairs.
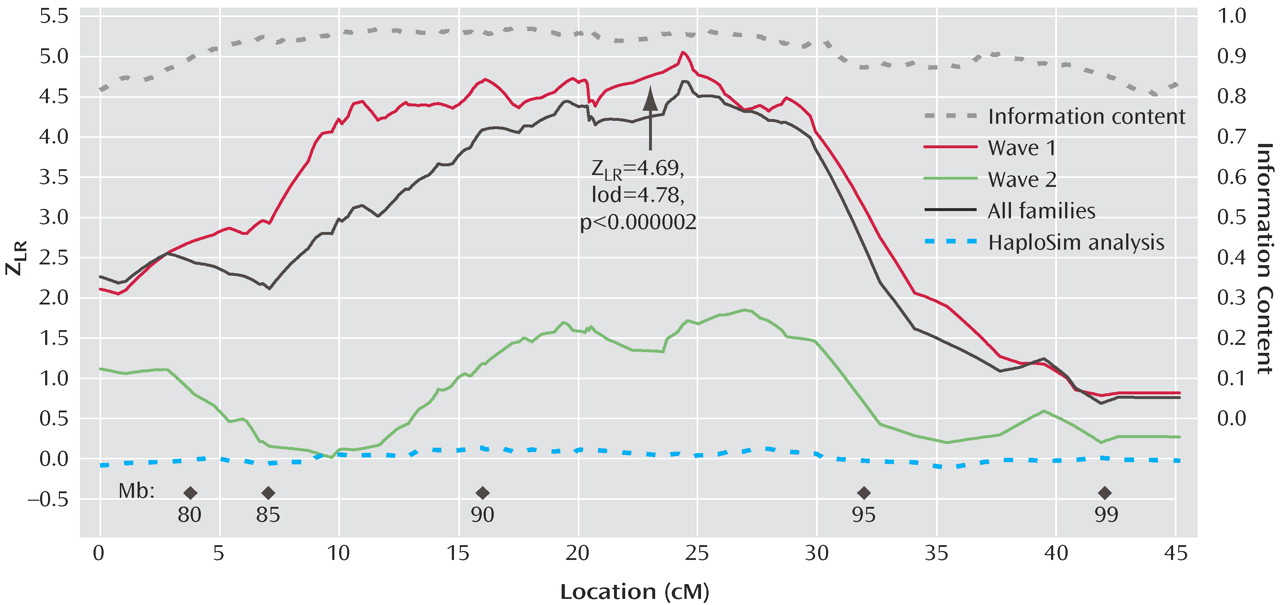
Figure 1 illustrates the linkage analysis results, and
Table 2 lists the maximum results. A maximum Z
LR of 4.69 (equivalent Kong-Cox lod score of 4.78) was observed at 109.8 cM (92.6 megabase), with an exact p=0.0000014, representing highly significant genomewide evidence for linkage. Significant linkage was still observed after removal of each of the two markers (at 24.27 and 24.59 cM on the map of this interval) closest to the peak score (maximum Z
LR of 4.62, p=0.000002, and 4.49, p=0.000004, respectively). For the five markers closest to the peak score, the distances between the adjacent markers were 0.147–0.308 megabase, with pairwise r
2 values from 0.00 to 0.01. Analyzed separately, wave 1 families produced strong evidence for linkage (p=0.0000003), and wave 2 families produced nominally significant evidence for linkage (p<0.04). Mean information content values were 0.919 (entire region) and 0.938 (one lod support region around the linkage peak).
Table 2 also shows results from the genome scan in this region, where the average information content in the 30 cM surrounding the linkage peak was 0.712.
The HaploSim analysis revealed small average (0.04) and maximum (0.13) differences between the full identical-by-descent and recoded replicates. At 24.37 cM (the location of the peak score), the mean difference was 0.049.
Discussion
Linkage fine mapping has demonstrated highly significant genomewide evidence for linkage to recurrent early-onset major depression on chromosome 15q25-q26. Therefore, it is likely that there are DNA sequence variations in one or more genes in this region that increase susceptibility to major depression. Further study is required to identify these variations and to elucidate their pathophysiological role. We refrain from speculating on possible candidate genes in the region until systematic association data are available from a larger data set because there are many diverse but unproven hypotheses about the physiological mechanisms that might contribute to depression susceptibility. There is some support for linkage of major depressive disorder on chromosome 15q in two other studies: Camp et al.
(28) observed their strongest evidence for linkage in men at approximately 121 deCODE cM (LOD=2.88, without correction for multiple tests), 12.4 cM from the extrapolated peak location in our fine-mapping analysis (109.6 cM); and McGuffin et al.
(29) observed their fifth-largest peak in their primary analysis, at 88.2 deCODE cM (LOD=1.14). Meta-analysis or combined analysis would be necessary to determine whether statistically significant evidence for linkage is observed across studies.
We note one possible source of bias. The a priori primary analysis was the ALLEGRO analysis of all families. The fine-mapping study included only European families because there were too few non-European families to include in ongoing association (linkage disequilibrium mapping) studies. Because we knew before the fine-mapping study that evidence for linkage on 15q in the short tandem repeat polymorphism genome scan was stronger in European families, we would not have accepted as significant a fine-mapping result that barely reached the genomewide threshold of p<0.00002. But the final empirical p value of <0.000002 was lower than that threshold by an order of magnitude, and therefore, we interpret it as highly significant.
Although the combined analysis was primary, we analyzed wave 1 and wave 2 separately because we had reported on wave 1 families in a published preliminary analysis
(30), and most of the evidence for linkage in the genome scan came from wave 1 families
(1) . Although the study was not designed as a formal internal test of “replication” because the group size of each wave was too small to detect linkage reliably for loci with small effects, it is reassuring that fine mapping increased the evidence for linkage in wave 2 families, with a nominal p
< 0.05. We interpret the results as being consistent with the findings of Göring et al.
(31) that in smaller data sets, inflated evidence for linkage can be observed for loci with small genetic effects and that when this occurs, subsequent data sets will produce weaker findings, with combined analyses or very large data sets converging toward the true effect size.
To examine this issue further, we estimated the locus-specific increase in relative risk to siblings of affected cases versus population risk (λ
siblings ) attributable to the 15q locus. The pedigrees were broken into nuclear families, and GENEHUNTER 2.1
(24) was used to estimate the mean identical-by-descent sharing proportion at each map position in affected sibling pairs. Our primary analysis used all types of affected relative pairs, but affected sibling pairs are useful here because under the assumption of a single locus underlying the linkage signal (which may not be the case), locus-specific λ
siblings can be estimated approximately as 0.25/z
0, where z
0 is the proportion of affected sibling pairs sharing 0 alleles identical by descent
(32) . (More accurate estimation of λ
siblings requires modeling of the ascertainment scheme
[33], but failure to correct for ascertainment often introduces only a small bias
[34] .) The estimates of z
0 in wave 1, wave 2, and all families were 0.181, 0.223, and 0.2059, respectively, resulting in λ
siblings estimates of 1.38, 1.12, and 1.21. If the true value was as high as 1.38, our power analyses
(3) suggest that strong evidence for linkage would probably be observed in most or all major depressive disorder linkage data sets of reasonable size (including our wave 2 subgroup), and this has not been the case (see reference
1 for a review). Thus, the extremely positive wave 1 result is likely to be an inflated estimate
(31), with the true locus-specific λ
siblings on 15q likely to be closer to the value of 1.21 observed in the full group or less.
Therefore, we consider our findings to be consistent with a major depressive disorder susceptibility locus on chromosome 15q25-q26 that increases risk to siblings by around 20% or less. Alternatively, there could be several susceptibility loci in the region with smaller effects. It may be possible to confirm this linkage with combined analysis or meta-analysis of multiple major depressive disorder groups and to identify the susceptibility gene or genes through genetic association studies in large groups of informative families or of cases and comparison subjects.


