A crucial component of interpersonal communication is the ability to correctly perceive affective facial expressions
(1) . However, patients suffering from an acute episode of depression have a diminished ability to distinguish facial affects, in particular those of happiness and sadness
(2 –
4) . Patients have difficulty in recognizing happy facial expressions
(4) and instead misidentify them as sad
(5) .
We previously reported on the neural correlates of implicit processing of sad facial expressions in a longitudinal study using functional magnetic resonance imaging (fMRI)
(6) . During an acute depressive episode, sad facial expressions were associated with greater activity in the amygdala, ventral striatum, and frontoparietal cortices than was observed in healthy comparison subjects. Following treatment with fluoxetine, there was an attenuation of this activity in patients to a level comparable with that in the comparison subjects, who had also undergone follow-up scans. The affected regions were consistent with neuropsychological models of facial emotional processing
(7 –
9) and, more broadly, with antidepressant treatment studies in depression
(10 –
12) . The present study was a complementary investigation of happy facial expressions in the same subjects.
Awareness of the emotional tone of a facial expression begins at an implicit level
(7), and the processing of facial affects is distinct from that of facial identities
(8) . Haxby et al.
(9) proposed that the processing of facial expressions and the recognition of facial identity are served by discrete but overlapping neural systems. The model describes a hierarchical structure consisting of a core system for initial visual analysis and extended neural streams for facial affective expressions and for identity recognition. The core system comprises the extrastriate cortices bilaterally, which include the inferior occipital gyrus, lateral fusiform gyrus, and superior temporal sulcus, and the affective processing system that measures the emotional tone of the facial expression includes the parietotemporal cortices, amygdala, insula, and limbic regions.
Within the core system, Surguladze et al.
(13) observed a linear relationship of activation in the extrastriate regions to increasing intensities of emotional facial expressions, indicating that modulation of the neural network begins at this early stage of processing. In the affective processing system, the amygdala has a key role in the recognition of emotions, principally of negative valences, such as fear
(14,
15) . Processing facial expressions of happy affective valences, in contrast, engages subcortical regions in the basal ganglia
(15) . In healthy individuals, activation in the ventral striatum and putamen have been consistently reported with happy faces
(15 –
18), while individuals suffering from depression
(19) have shown low activation in response to happy faces in subcortical and limbic regions, in a cluster that encompassed the thalamus, caudate nucleus, putamen, amygdala, and hippocampal region. The observation by Lawrence et al.
(19) was a cross-sectional study of patients with depression, all of whom were receiving antidepressant medication.
In the present study we report the investigation of the neural correlates of happy facial processing in a longitudinal study of depression. Medication-free patients participated in fMRI scans during an acute episode and following 8 weeks of treatment with the antidepressant fluoxetine, and healthy comparison subjects underwent the same scans at the same time points. During the scans, the subjects viewed a standardized series of faces
(20) that were morphed to present different intensities of happiness. Using this activation procedure, we were able to estimate both the mean difference between the affective stimuli and baseline trials and the dynamic range of brain response to affective intensity. The design of the experiment allowed the identification of brain regions that showed significant effects of group (depressed patients versus healthy volunteers), time (baseline versus week 8), and the interaction of group and time (indicative of an antidepressant treatment effect) for both the overall capacity and dynamic range of response to happy faces.
We hypothesized that patients with depression would have less neural response to happy faces than healthy comparison subjects in the basal ganglia and limbic regions, namely the caudate, putamen, and hippocampal regions. More speculatively, we expected that patients with depression would show less neural response in the extrastriate cortices than would healthy individuals.
Method
Subject Characteristics
The study groups and experimental design have been described previously
(6) . Briefly, participants meeting the DSM-IV criteria for major depressive disorder
(21), assessed by the Structured Clinical Interview for DSM-IV (SCID)
(22), were recruited through local newspaper advertisements. The inclusion criteria were an acute episode of major depressive disorder, unipolar subtype, and a score of at least 18 on the 17-item Hamilton Rating Scale for Depression (HAM-D)
(23), without comorbid psychiatric disorders or medical illnesses. All patients were free of psychotropic medication for a minimum of 4 weeks at recruitment. Nineteen patients completed the study, 13 of whom were women. The patients’ mean age was 43.2 years (SD=8.8), their mean full IQ was 109.2 (SD=14.5), and the baseline HAM-D score was 21.1 (SD=2.3). The healthy comparison subjects were recruited by advertisement in the community, were matched by age, gender, and IQ, and had no history of psychiatric or medical disorders. Of the 19 comparison subjects, 11 were women. Their mean age was 42.8 years (SD=6.7), their mean full IQ was 116.4 (SD=18.8), and their baseline HAM-D score was 0.3 (SD=0.7). All subjects provided written informed consent in accordance with the guidelines of the Institute of Psychiatry and South London and Maudsley National Health Services (NHS) Trust Ethics (Research) Committee.
Experimental Design
In a parallel-group, repeated-measures design, all subjects were scanned in four separate sessions. In the first session, the subjects were familiarized with the MRI unit and underwent a structural MRI for neuroradiological examination. The subjects then participated in three separate 60–90-minute fMRI sessions: at baseline or week 0, at 2 weeks after baseline, and at 8 weeks after baseline. During each session the subjects performed a number of activation tasks, and we have previously reported the results of a formally analogous test of neural processing of sad facial affect in the same subjects
(6) . In the current article, we present the data acquired at week 0 and week 8 for the happy facial affect task.
The depressed patients received antidepressant treatment with fluoxetine, a selective serotonin reuptake inhibitor, 20 mg orally once daily. The treatment was begun as soon as possible after the baseline fMRI session (typically less than 1 day) and continued until completion of the study protocol 8 weeks later. The patients were clinically assessed every 2 weeks by a psychiatrist (C.H.Y.F. or A.J.C.) for the study duration, and depressive symptoms were serially rated by using the HAM-D. All patients recruited into the study were able to complete the protocol.
Test for Implicit Recognition of Happy Facial Affect
Ten faces (five male) from a standardized series of happy facial expressions
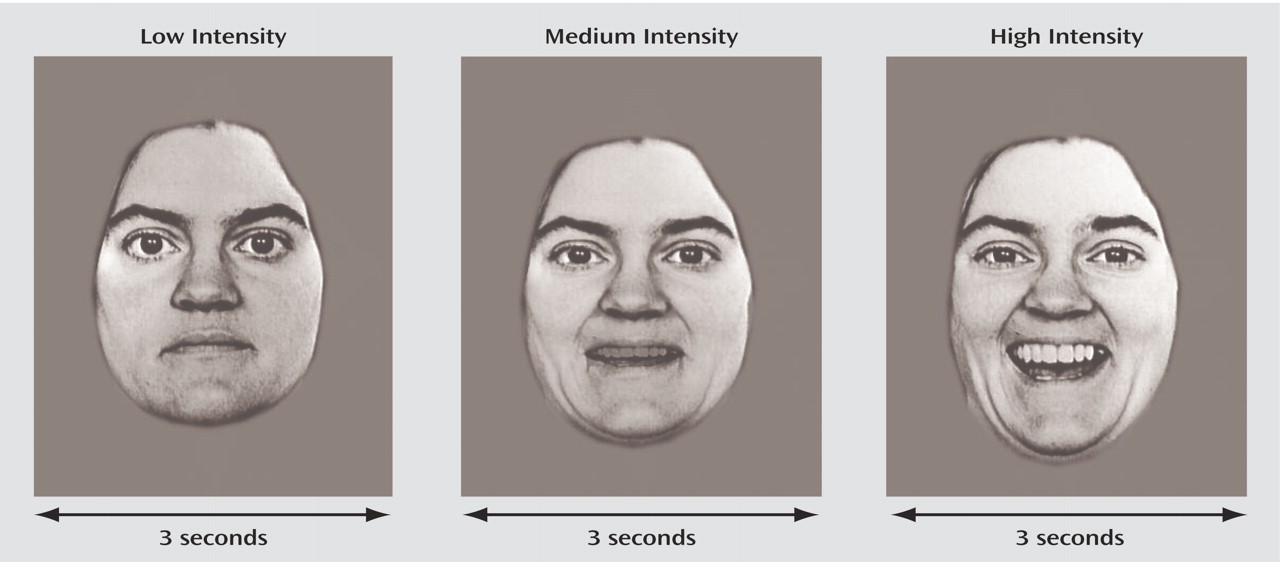
(20) were morphed to represent three intensities of happiness: low, medium, and high (
Figure 1 ). In an event-related fMRI task, facial stimuli and baseline trials (crosshair fixation) were presented in random order. Each stimulus was presented twice at each intensity (60 faces in total), along with 12 baseline trials (crosshair visual fixation point), for a total of 72 trials. Each condition was presented for 3 seconds with the intertrial interval randomly varied according to a Poisson distribution, with a mean intertrial interval of 5 seconds, for a total duration of 360 seconds (6 minutes). The same stimulus set was used at baseline and at 8 weeks.
For each facial trial, the subject was asked to indicate the gender of the face (male or female) by lateral movement of a joystick; no hand movement was required in response to a baseline trial. Reaction time and accuracy of gender decision during scanning were recorded for each trial.
fMRI Data Acquisition
Gradient echo single-shot echoplanar imaging was used to continuously acquire 180 T 2 *-weighted image volumes on a neuro-optimized 1.5-T IGE LX System (General Electric, Milwaukee, Wis.) at the Maudsley Hospital, South London and Maudsley National Health Service Trust, London, for the duration of the procedure. For each volume, 16 noncontiguous axial planes parallel to the intercommissural plane were collected with the following characteristics: TR=2000 msec, TE=40 msec, slice thickness=7 mm, slice skip=0.7 mm, in-plane resolution=3×3 mm.
fMRI Data Analysis
Following correction of differences in slice timing and the effects of head movements
(24), linear regression was used to estimate experimentally induced signal changes. Each column of the regression matrix was convolved with a pair of Poisson kernels (λ=4 or 8 seconds). Statistic maps, or t maps, representing each of these two standardized effects for each individual at each scan session were registered in the standard space of Talairach and Tournoux
(25) by an affine transformation to a template image
(26) .
Regression analysis modeled two mutually orthogonal aspects of brain activation at each voxel: 1) overall facial processing capacity, i.e., the mean difference in elicited response between baseline trials and all facial trials taken together, and 2) facial processing dynamic range, or load-response, i.e., linear change in response elicited by facial trials presented at low, medium, and high levels of affective load.
Factorial effects of interest were identified in a 2×2 analysis of variance (ANOVA) model with a main effect of group (patients versus comparison subjects), main effect of time (week 0 versus week 8), and group-by-time interaction. To identify brain regions associated with symptomatic response, the change in HAM-D symptom score for each patient over 8 weeks of treatment was regressed on the corresponding change in overall affective capacity estimated over the same time period, by subtracting the t map at week 0 from the corresponding map at week 8.
The statistical significance of these factorial effects and regression coefficients was decided by a cluster-level permutation test that involved applying a preliminary probability threshold (p<0.05) to the voxel statistic maps and shrinking all suprathreshold voxels toward zero, thus creating a set of suprathreshold voxel clusters that were spatially contiguous in three dimensions. The sum of suprathreshold voxel statistics was tested by a permutation test
(27) with a clusterwise probability of type I error of p<0.005. At this size of test and over the search volume of clusters tested, less than one false positive cluster is expected per map. Further methodological details can be accessed at http://www-bmu.psychiatry.cam.ac.uk/bamm.
Results
The behavioral and fMRI data are summarized in the following. Further details are available as supplementary material at http://www-bmu.psychiatry.cam.ac.uk/~js369/pubabcd_happy/pububdex.html.
Behavioral Data
ANOVA showed a main effect of group on latency (F=6.6, df=1, 34, p<0.02): the reaction time over all trials was longer for the patient group than for the healthy comparison group. There was also a main effect of time on latency (F=6.1, df=1, 34, p<0.02): all subjects showed a shorter reaction time at week 8 than at week 0. There were no significant effects of affective intensity nor any significant interactions for latency.
For accuracy of explicit gender recognition, there was a significant effect of group (F=5.3, df=1, 34, p<0.03): the patients were less accurate at identifying the gender of the facial stimuli than the healthy comparison subjects. There was also a main effect of intensity: the subjects were less accurate at the low intensity of the happy facial expressions (F=27.6, df=2, 33, p<0.001). The interaction of intensity with group fell short of significance (F=3.2, df=2, 33, p<0.054). There was no main effect of time, nor any significant interaction effects for the accuracy of gender judgment.
Main Effect of Group
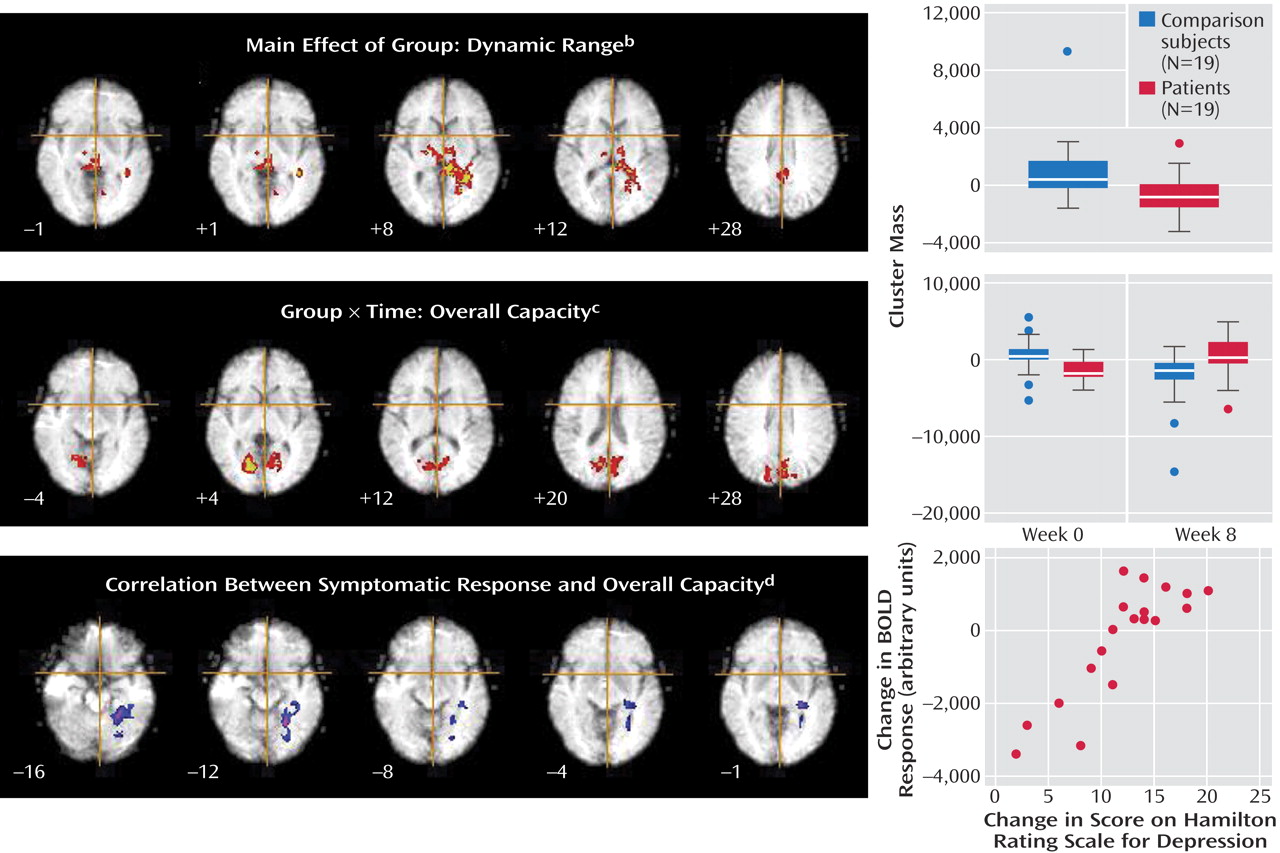
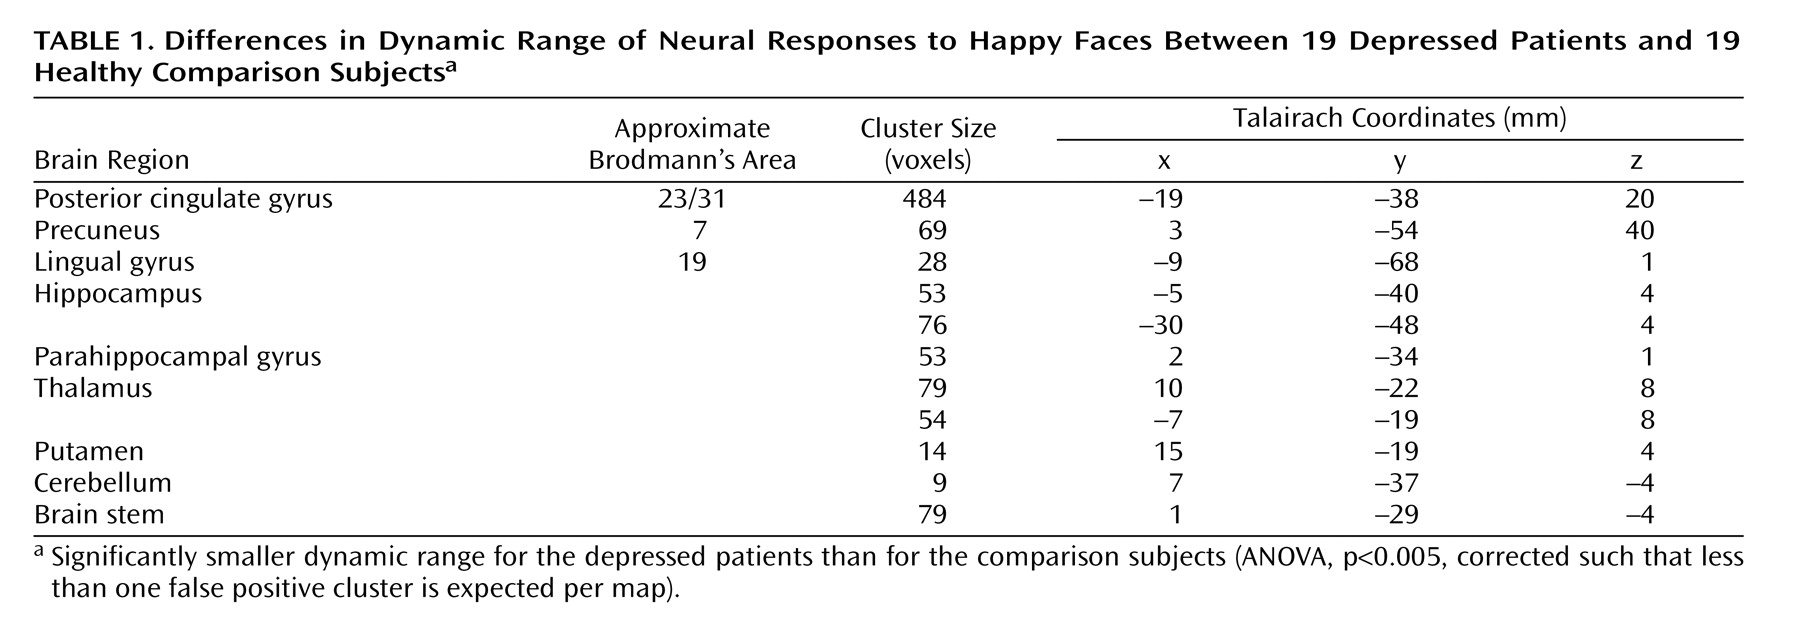
The patients had a smaller dynamic range than the comparison subjects in the right putamen, bilateral thalamus, bilateral hippocampal region (left>right), left lingual gyrus, precuneus, posterior cingulate gyrus, and right cerebellum (
Figure 2,
Table 1 ). The main effect of group reflected an attenuated response in dynamic range at both the baseline and week 8 follow-up scans in the patients relative to the comparison subjects. There were no differences in overall capacity between groups.
Interaction of Group and Time (Effect of Antidepressant Treatment)
A significant interaction for overall capacity was observed in the cerebellum and extrastriate cortical regions: bilaterally in the lingual gyri and cuneus, extending to the precuneus and posterior cingulate gyrus. Post hoc analysis indicated that the overall capacity for processing happy faces was significantly lower in the acutely depressed patients than in the healthy subjects at baseline (F=7.6, df=1, 36, p<0.009) and that it increased significantly in the patients after antidepressant treatment (F=7.0, df=1, 36, p<0.02) (
Figure 2,
Table 2 ). There was no significant group-by-time interaction for the dynamic range of response.
Relationship Between Symptomatic Response and Overall Capacity
There was a significant association between the change in HAM-D score and overall capacity in the following regions of the left brain: lingual gyrus, hippocampal region (including the parahippocampal gyrus), and cerebellum. These regions showed a significant positive correlation such that the patients who had the greatest clinical improvement after treatment showed the greatest overall capacity in happy face processing (
Figure 2,
Table 3 ).
Main Effects of Time
There was a significant reduction over time in overall capacity bilaterally in the anterior and posterior cingulate gyri, medial prefrontal cortices, inferior and middle frontal cortices, precentral gyri, right inferior parietal cortex, left precuneus and cuneus, and cerebellum. A significant reduction in dynamic range over time was found in the following regions in the right brain: lingual and inferior occipital cortices, hippocampal region, inferior frontal cortex, insula, inferior parietal and superior temporal cortices, precentral gyri, and cerebellum. All figures and tables are available as supplementary material at http://www-bmu.psychiatry.cam.ac.uk/DATA.
Discussion
Impairments in affective facial processing have significant implications for interpersonal relationships in depression
(1) . Although happy expressions are the most easily recognized of the affective facial expressions, they are typically misconstrued by patients suffering from depression
(2 –
5) . We previously reported the neural correlates associated with sad facial expressions in patients with depression during an acute episode and following treatment, as compared with a matched group of healthy comparison subjects who participated in the same scans at the same time points
(6) . The present study is a complementary investigation of the neural correlates of implicit processing of happy faces. The most striking observation was that the patients had less neural response to happy faces than did the healthy volunteers. This is in marked contrast to the processing of sad faces, in which neural activations were abnormally exaggerated in depression
(6) . Moreover, the core regions involved in face processing subsequently showed significant increases in activation in response to happy faces following antidepressant treatment, and baseline activation in the hippocampal region was significantly associated with patient clinical response.
Main Effect of Group
In relation to the healthy subjects, the patients with depression showed a smaller dynamic range of responses to happy facial expressions in limbic, subcortical, and extrastriate regions. The hippocampus is part of the “limbic cortex” and has a crucial role in normal and impaired affective functioning
(28 –
31) . In healthy volunteers, Critchley et al.
(18) observed increased activation in the hippocampal region during implicit processing of happy faces. The present study suggests that hippocampal function in response to happy faces is impaired in depression. In addition, the hippocampus is engaged in memory encoding and retrieval of both facial identity and affective facial expressions
(32) . There may have been some involvement of memory processes in the present study, as the stimuli consisted of a series of faces of varying intensities that were randomly presented and included several repetitions of each expression.
The patients with depression also showed a smaller dynamic range in the putamen. In healthy individuals, activation of the putamen is consistently reported with happy faces
(16) and pleasant pictures
(33), as well as during memory recall following induction of a happy mood
(34) . In patients with depression, reduced activation has been observed with happy faces
(19), and more recently there has been a report of a smaller dynamic range than in healthy individuals
(35) . The ventral striatum and putamen are implicated in reward and motivation
(36) . Facial expressions provide social cues
(1), which may be reflected by implicit imitation in the observer
(37), and lesions in the basal ganglia lead to impaired recognition of affective facial expressions
(38) . For healthy volunteers, the task of viewing happy faces is highly salient and may be experienced as pleasant
(1), a process that is impaired in patients with depression
(2 –
5) . The basal ganglia receive projections from the neocortex and have reciprocal connections via the thalamus
(39) . An additional observation in the present study was a smaller dynamic range in the thalamus among patients with depression than among healthy volunteers. This contrasts with our finding for sad faces, whereby patients with depression showed greater activation in subcortical regions than did healthy volunteers
(6) .
Extrastriate cortical activation is elicited by emotional scenes
(40) and facial expressions
(13,
41), and it appears to be driven by the affective nature of the stimuli rather than by their complexity
(42) or by eye movements
(43) . Moreover, Surguladze et al.
(13,
35) reported a linear association of activation in extrastriate regions with increasing intensity of happy facial expressions in healthy volunteers, which we also observed in the present study, while patients with depression showed an impaired dynamic range.
Our finding of a smaller dynamic range in limbic, subcortical, and extrastriate regions provides a neural substrate for the behavioral expression of impaired recognition of happy faces in depression. Notably, the attenuation in dynamic range was evident at both the baseline and follow-up scans, indicating that impairments in regions of the emotional processing network of happy facial expressions not only are present during an acute depressive episode but persist into the remission phase. This suggests that the impairment in these regions may be a trait feature of depression, which has implications for its pathophysiology, clinical course, and treatment strategies.
Effects of Antidepressant Treatment
The lingual gyrus and cuneus showed impaired activation in the depressed patients at baseline, then a significant improvement following 8 weeks of treatment, which suggests an improvement in their implicit processing of happy faces. Activity in extrastriate regions has been proposed to be mediated through the amygdala
(44), which is a key site of impairment in models of depression
(28 –
31) . Although no differences in amygdala activation were observed in the present study, previously we noted changes in its activity in response to sad facial expression
(6) . In the present study, there may nonetheless have been modulation of extrastriate activity by the amygdala that would be measurable by an effective connectivity analysis.
Relationship Between Symptomatic Response and Overall Capacity
In the patient group, some regions also showed a significant relationship with clinical response to treatment. Greater overall capacity in the left hippocampal region in medication-free patients at baseline was associated with a greater improvement in clinical symptoms following antidepressant treatment. Several researchers have observed a high level of limbic-subcortical activity in depression that is attenuated after antidepressant treatment
(10,
11), a feature that may be specific to pharmacological therapy, as this has not been observed with cognitive behavior therapy
(45) . The hippocampus is a key node in models of depression
(28 –
31), and high levels of activity in the hippocampal region at baseline may indicate a resilience in neural responsivity in those patients who subsequently showed a clinical improvement.
The engagement of the hippocampus in the present study also indicates a specificity in the affected neural regions that may be task related, as we previously observed a positive relationship between treatment response and activation response to sad faces in other regions, namely the anterior cingulate cortex, striatum, and cerebellum
(6) . Seminowicz et al.
(46) reported significant differences in the effective connectivity between the hippocampus and subgenual cingulate cortex in patients with depression who showed either a successful or a poor response to antidepressant treatment. This analysis reveals a relevant relationship between cortical and limbic regions that is predictive of clinical response to therapy and that may be modulated by the task performed.
As well, there was a clear lateralization of the significant associations, toward the left hemisphere. One of the most replicated observations in the electroencephalographic (EEG) literature is the finding of frontal asymmetry, with greater alpha activity over the left than the right frontal regions in subclinical and clinical depression
(47) . As alpha activity is inversely related to cortical activation, this is believed to reflect relatively greater right frontal and attenuated left frontal activity. Davidson
(48) has conceptualized this in an approach/withdrawal motivational model in which right frontal activity is associated with avoidance or withdrawal behaviors and left frontal activity with general approach behaviors. Moreover, Bruder et al.
(49) noted greater left hemispheric activation in patients who showed a clinical response to fluoxetine than in nonresponders. Although the neural regions mediating the EEG activity are not well defined, these observations broadly parallel our findings. Of note, the left lateralization of the treatment response relationship was elicited by happy facial stimuli, while the task with sad faces showed bilateral regional associations
(6), which is consistent with the right visual field bias for positive emotions
(50) and the engagement of approach behaviors
(48) .
Study Limitations
All patients in the present study received fluoxetine as their treatment, which limits the interpretation of the neural responses as an effect of pharmacotherapy. In order to distinguish the treatment effects of medication from state changes associated with the natural course of the illness, comparison with a placebo-treated group of patients is necessary. We had initially considered including a group of patients who would receive placebo, but we decided to maintain full treatment options in the present study for ethical reasons. To account for possible test-retest effects, the comparison group consisted of matched healthy individuals who underwent the same scans at the same time points. The main effect of time revealed decreased responses in multiple cortical and limbic regions, likely reflecting effects of repeated scanning on affective neural processing networks, although possible systematic measurement errors cannot be fully excluded. In order to ascertain the specificity of the neural findings, all subjects also participated in a basic sensory stimulation task, which did not show any differences between groups or between the baseline and follow-up scans
(6) .
Summary
Patients with depression had lower neural responses to happy facial expressions in limbic, subcortical, and extrastriate cortical regions as compared with healthy volunteers. Attenuated extrastriate activation at baseline showed an increase following antidepressant treatment. The affected regions encompass the core visual system and emotional processing stream involved in face perception. The findings reveal a neural substrate for impaired recognition of happy facial expressions in depression and demonstrate the ameliorative effects of antidepressant treatment. The observations in the present study complement our previous finding of greater neural responses to sad facial expressions among the same group of depressed subjects than among healthy subjects. These data offer further support for a network of regions implicated in depression and indicate the importance of task specificity in engaging components of the neural network.


