The prevalence of seasonal affective disorder in the general population has been studied in many countries and at different latitudes, since the major theory explaining the disorder is that it is caused primarily by lack of daylight in winter. However, the prevalence estimates have varied considerably among studies, and there is no general agreement on the linkage to latitude
(1). These differences could be related to study methods and, in particular, could be related to the psychometric properties of the Seasonal Pattern Assessment Questionnaire
(2), which is used for diagnosis of seasonal affective disorder. In an earlier publication
(3), we argued that the Seasonal Pattern Assessment Questionnaire has not been validated for different climatic and geographic conditions. In a recent review of the literature on prevalence and latitude, Mersch et al.
(4) concluded that “if latitude influences prevalence, this influence is only weak.” Mersch et al. also discussed possible reasons for the great variability in reported prevalence. However, they did not discuss the possibility that scores on the Seasonal Pattern Assessment Questionnaire could be influenced by the time of the year in which the study is conducted. To investigate whether time of the year when the Seasonal Pattern Assessment Questionnaire is completed influences the results, we administered the questionnaire in the four different seasons to subjects from the general population of a small fishing community in northern Norway.
Method
Participants were recruited in Gamvik, Norway, as part of the National Screening Institute’s national screening program for cardiovascular diseases. Gamvik is located at 70 degrees north latitude, close to the North Sea and east of North Cape, and is one of the northernmost communities in Norway. In winter the sun is below the horizon continuously from mid-November to mid-January, and in summer it is above the horizon continuously from mid-May to mid-July. Invitations for participation in the cardiovascular screening program were mailed to all inhabitants born during the period 1925–1970 (N=550). The screening team used a mobile unit and stayed in Gamvik for three days in March 1997. The weather conditions during these days were extremely bad, with a snowstorm making all travel difficult. This reduced the participation rate somewhat, but about two-thirds of the invited inhabitants did attend.
Of those who attended the cardiovascular screening, 250 participants were invited to participate in a study of melatonin. Of that group, 231 (92.4%) gave informed consent to participate, and 200 (80.0%) answered the study questionnaire in one or more seasons. After the screening, the participants were mailed a questionnaire at approximately 3-month intervals, in June, September, and January 1998. Since some participants did not answer immediately, the sampling period at each interval could be as long as 2 months. The two-page questionnaire mainly asked participants about their experiences with daily life, including sleep, physical activities, coffee drinking, etc., on the day the questionnaire was completed.
The questionnaire contained all questions from the Seasonal Pattern Assessment Questionnaire. This instrument asks the subject to rate his/her pattern of seasonal variation in six areas—sleep, social activity, mood, weight, appetite, and energy level—on a 5-point scale from 0, no changes, to 4, extremely marked changes. The six scores are summed to produce a global seasonality score, which can range from 0 to 24. A subject is considered to have a seasonal affective disorder if the global seasonality score is 11 or more, the subject feels worst in January and February, and the seasonal changes are experienced as a problem of at least moderate degree.
The study was approved by the regional ethics committee of north Norway. After complete description of the study to the subjects, written informed consent was obtained. The Norwegian Data Inspectorate approved the collection and storage of the data.
Results
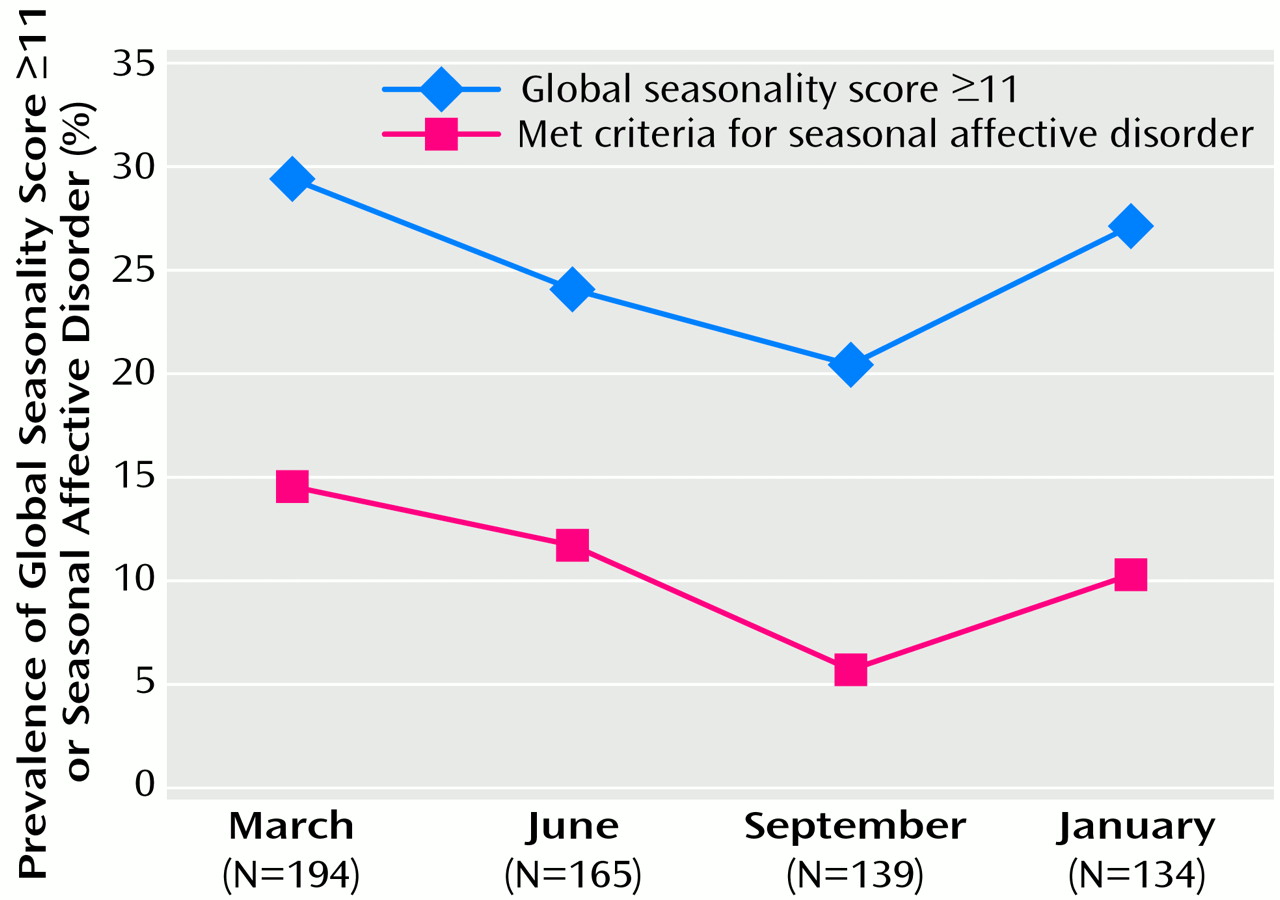
The female-to-male ratio among the 200 study participants was 1:2, and 52.5% of the subjects were age 50 or older. The percentages of the subjects who had a global seasonality score of 11 or more and the percentages of subjects who met the full seasonal affective disorder criteria at the four time points in the study are shown in
Figure 1. The percentage who met criteria for seasonal affective disorder varied from 5.6% to 14.4% during the year. The highest prevalence values occurred in March, and lowest in September, with a difference of 8.8% (95% confidence interval=2.6%–15.0%). The same pattern was found when we analyzed the data for only those individuals who answered the questionnaire in all four seasons (data not shown).
The interobserver values for the Seasonal Pattern Assessment Questionnaire showed kappa values between 0.47, for March versus June, and 0.19, for March versus January.
Discussion
Our study found that the results on the Seasonal Pattern Assessment Questionnaire showed a clear seasonal pattern. In addition, the test had low-to-medium reliability when it was repeated several times over 1 year. This study was undertaken in one of the northernmost populated areas of Norway, where there are extreme shifts in the amount of daylight during the year. The highest and lowest scores did not coincide with the seasonal light rhythm. The number of people who met criteria for seasonal affective disorder was highest in March, when the day and night have about equal lengths, and lowest in September, which is darker. This result could be an effect of the bad weather in March during the year the study was conducted. Thus, the questionnaire could be invalidated by general weather conditions.
A seasonal pattern in responses to the Seasonal Pattern Assessment Questionnaire and differences in the seasons when previous studies were conducted could explain the differences between these studies in the estimated prevalence of seasonal affective disorder. Only three studies that we are aware of have tried to evaluate the effect of month of completion of the questionnaire on the estimated prevalence
(5–
7). These studies suggest that response to the questionnaire does not vary with the season, but in our view the question remains open.
In addition, the subjects who participated at all four time points throughout the year in our study did not give consistent responses, despite the fact that the Seasonal Pattern Assessment Questionnaire clearly asks for a general rating of symptoms. Our results suggest that subjects may misinterpret the questionnaire and provide a rating of symptoms for the season in which they are responding rather than an overall rating.
We conclude that the Seasonal Pattern Assessment Questionnaire is not reliable for comparison between populations in different geographic areas unless it is adjusted for seasonal effects in the performance of the test.


