Site maintenance Wednesday, November 13th, 2024. Please note that access to some content and account information will be unavailable on this date.
Skip to main content
Full access
Images in Neuroscience
Published Online: 1 August 2001

The Human Genome: Microarray Expression Analysis
Publication: American Journal of Psychiatry
All cells in the human body contain the full set of human genes, but only selected genes are expressed in any particular cell population. The distinctive pattern of genes expressed in any cell is its genetic script, its distinctive gene expression signature. An abnormality in the expression of a gene can lead to risk for disease or disease manifestation. Many laboratories are looking for abnormal gene expression in brain regions from individuals with a psychiatric illness to provide a molecular basis for the disease. Chromosomal DNA is expressed through transcription into RNA; RNA expression can be assessed by using cDNA microarrays on a global scale in a target cell population. Microarray profiling allows simultaneous analysis of thousands of expressed genes in a single experiment. RNA expression profiling provides the basis for comparing patterns of differential gene expression in brain tissues from individuals with a brain disease. With some attention to selecting the optimal target tissue informative about the psychiatric diagnosis, this technique can implicate genetic alterations in the illness.
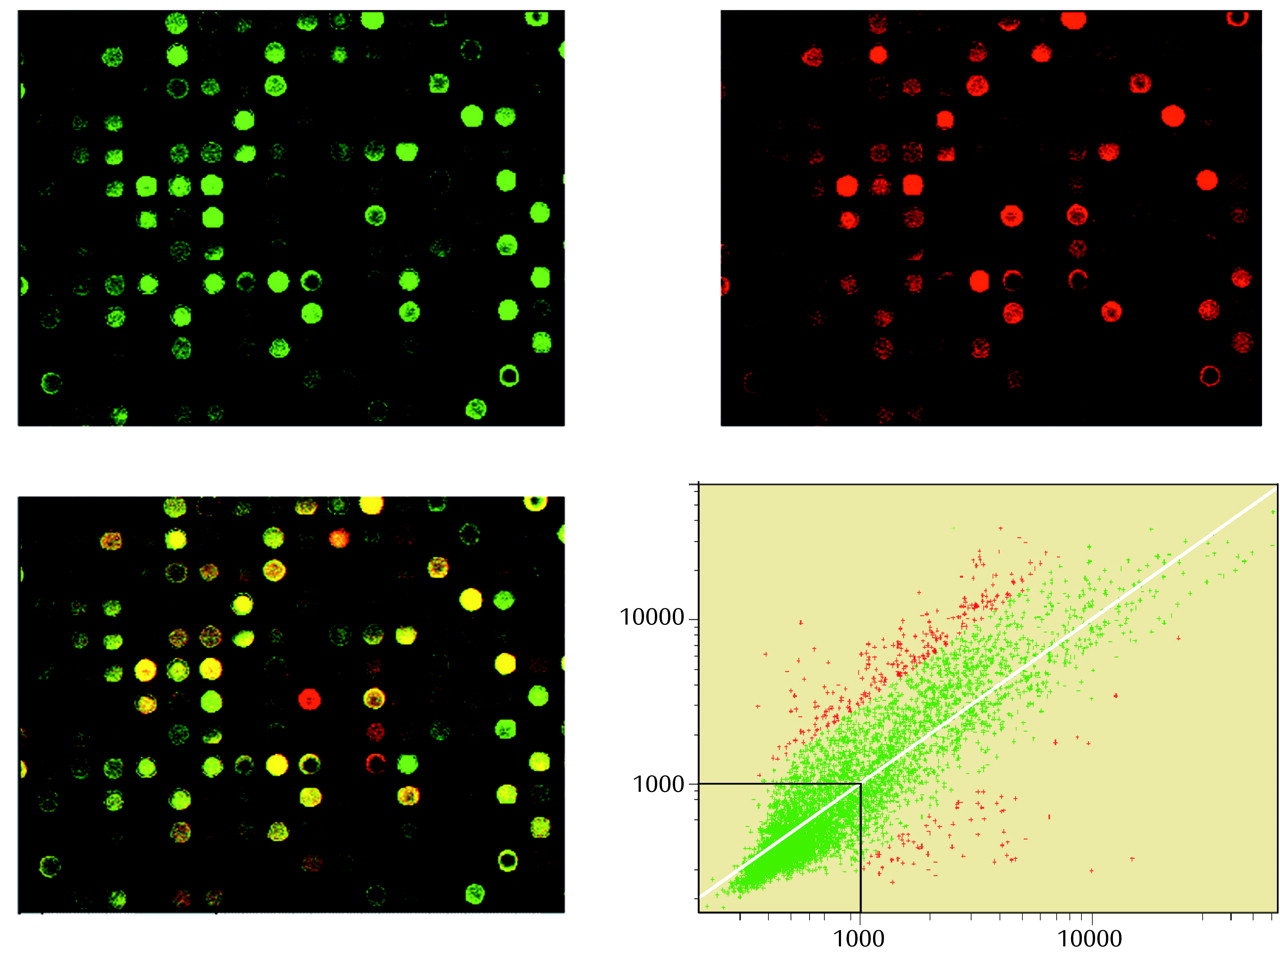
The figure shows the tools for microarray profiling. Known fragments of DNA are printed onto a glass slide in a microgrid design, with up to 20,000 spots per glass slide. The location and identification of each spot are followed electronically. RNA from the experimental and the control tissue are identified by using a different fluorescently labeled probe for each tissue. On the cDNA microarray, the individual labeled RNA strands will find their complementary DNA sequence and complex (hybridize) with it, thus affixing its fluorescent signal to the known DNA. The red spots alone (upper right) are from tissue 2 expression (e.g., postmortem tissue from a subject with psychiatric illness); the green spots alone (upper left) are from tissue 1 expression (e.g., postmortem tissue from a matched healthy subject). The conjoint picture (lower left), made from a confocal laser camera, shows the genes expressed similarly in each tissue (yellow) and the genes expressed distinctively in either tissue 1 or 2 (still green or red, respectively). This technique allows the simultaneous assay of the relative expression levels of all the genes printed on the microarray from experimental and control tissue. The analysis of the results requires complex computer analysis programs (e.g., lower right), many of which are publicly available. This technique complements hypothesis-testing experimental approaches by providing a way of doing unbiased sampling of gene expression in a tissue.
Figure.
A representative experiment to identify gene expression profiles in human tissue. mRNA (0.5 mg) extracted from tissue 1 was labeled with a reverse transcriptase reaction in the presence of CY3-labled dUTP. mRNA (0.5 mg) extracted from tissue 2 was labeled with a reverse transcriptase reaction in the presence of CY5-labeled dUTP. The resultant probes were mixed and hybridized overnight to a prefabricated microarray on a 1 × 3-inch glass slide. The relative levels of expression for the genes represented on the microarray were determined by scanning the hybridized microarray with a green laser to detect CY3 fluorescent intensity (upper left) and a red laser to detect CY5 fluorescent intensity (upper right). The two images are overlaid (lower left) and the level of CY3 and CY5 intensities for each spot on the microarray determined, indicating the relative difference in expression for that gene between the two tissues. After normalization for overall signal strength, the intensities from each CY dye on a given spot are plotted against each other (lower right). Spots above the diagonal line represent genes that are expressed at a higher level in tissue 1, and spots below the diagonal line represent genes that are more highly expressed in tissue 2.

Footnote

Address reprint requests to Dr. Tamminga, Maryland Psychiatric Research Center, University of Maryland, P.O. Box 21247, Baltimore, MD 21228; [email protected] (e-mail). The image is courtesy of Dr. Brockman.

Information & Authors

Information

Published In

Go to American Journal of Psychiatry
American Journal of Psychiatry
Pages: 1199
PubMed: 11481149

History

Published online: 1 August 2001
Published in print: August 2001

Authors

Details

Jeffrey A. Brockman, Ph.D.
Carol A. Tamminga, M.D.

Metrics & Citations

Metrics

Citations

Export Citations

If you have the appropriate software installed, you can download article citation data to the citation manager of your choice. Simply select your manager software from the list below and click Download.

For more information or tips please see 'Downloading to a citation manager' in the Help menu.

Format
Citation style
Style
Copy to clipboard

View Options

View options

PDF/EPUB

View PDF/EPUB

Get Access

Login options

Already a subscriber? Access your subscription through your login credentials or your institution for full access to this article.

Personal login Institutional Login Open Athens login
Purchase Options

Purchase this article to access the full text.

PPV Articles - American Journal of Psychiatry

PPV Articles - American Journal of Psychiatry

Not a subscriber?

Subscribe Now / Learn More

PsychiatryOnline subscription options offer access to the DSM-5-TR® library, books, journals, CME, and patient resources. This all-in-one virtual library provides psychiatrists and mental health professionals with key resources for diagnosis, treatment, research, and professional development.

Need more help? PsychiatryOnline Customer Service may be reached by emailing [email protected] or by calling 800-368-5777 (in the U.S.) or 703-907-7322 (outside the U.S.).

Media

Figures

Other

Tables

Share

Share

Share article link

Share