Magnetoencephalographic Results
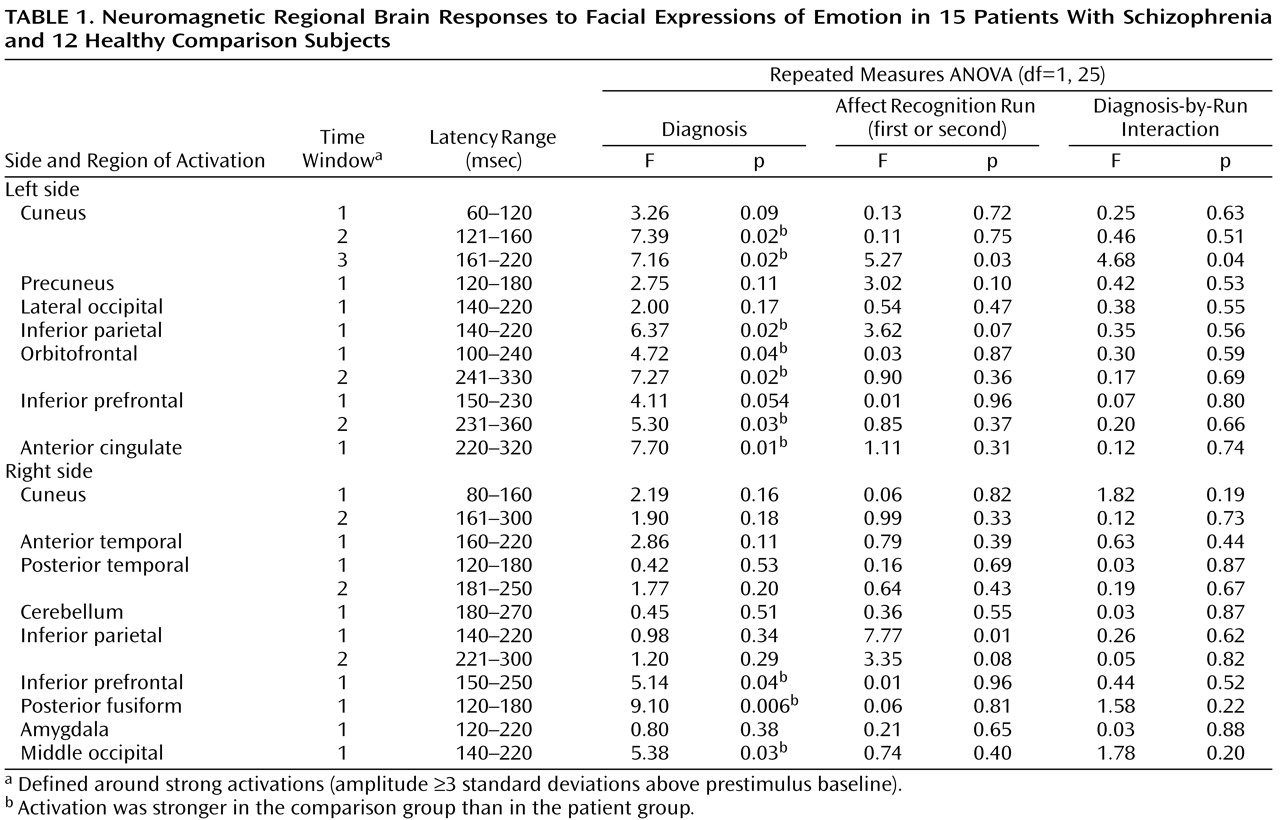
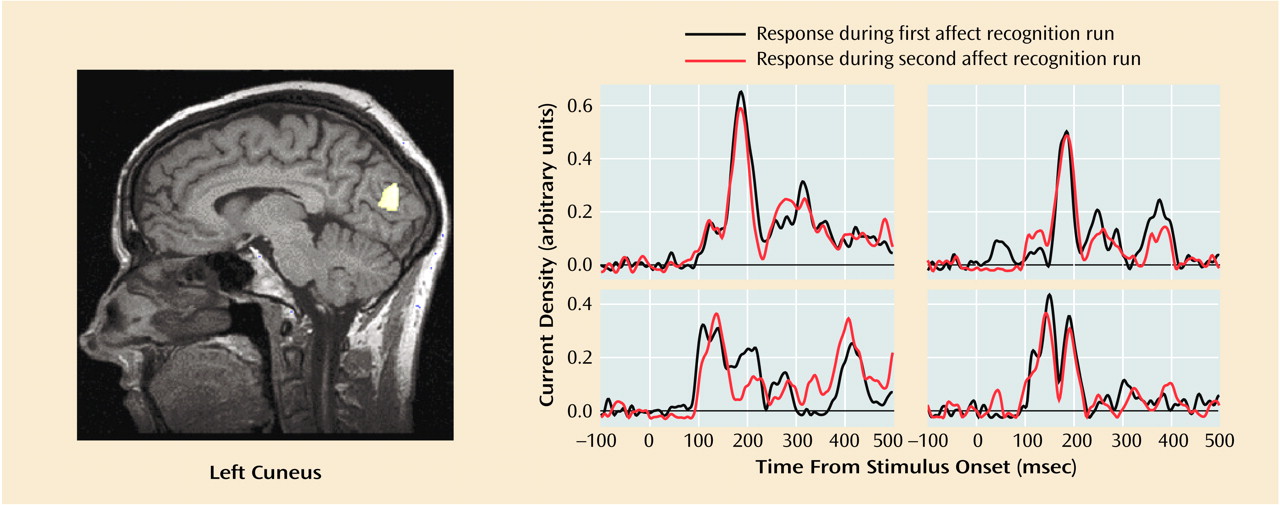
Subjects showed reliable regional activations at circumscribed latencies during categorization of facial expressions of emotion (an example is given in
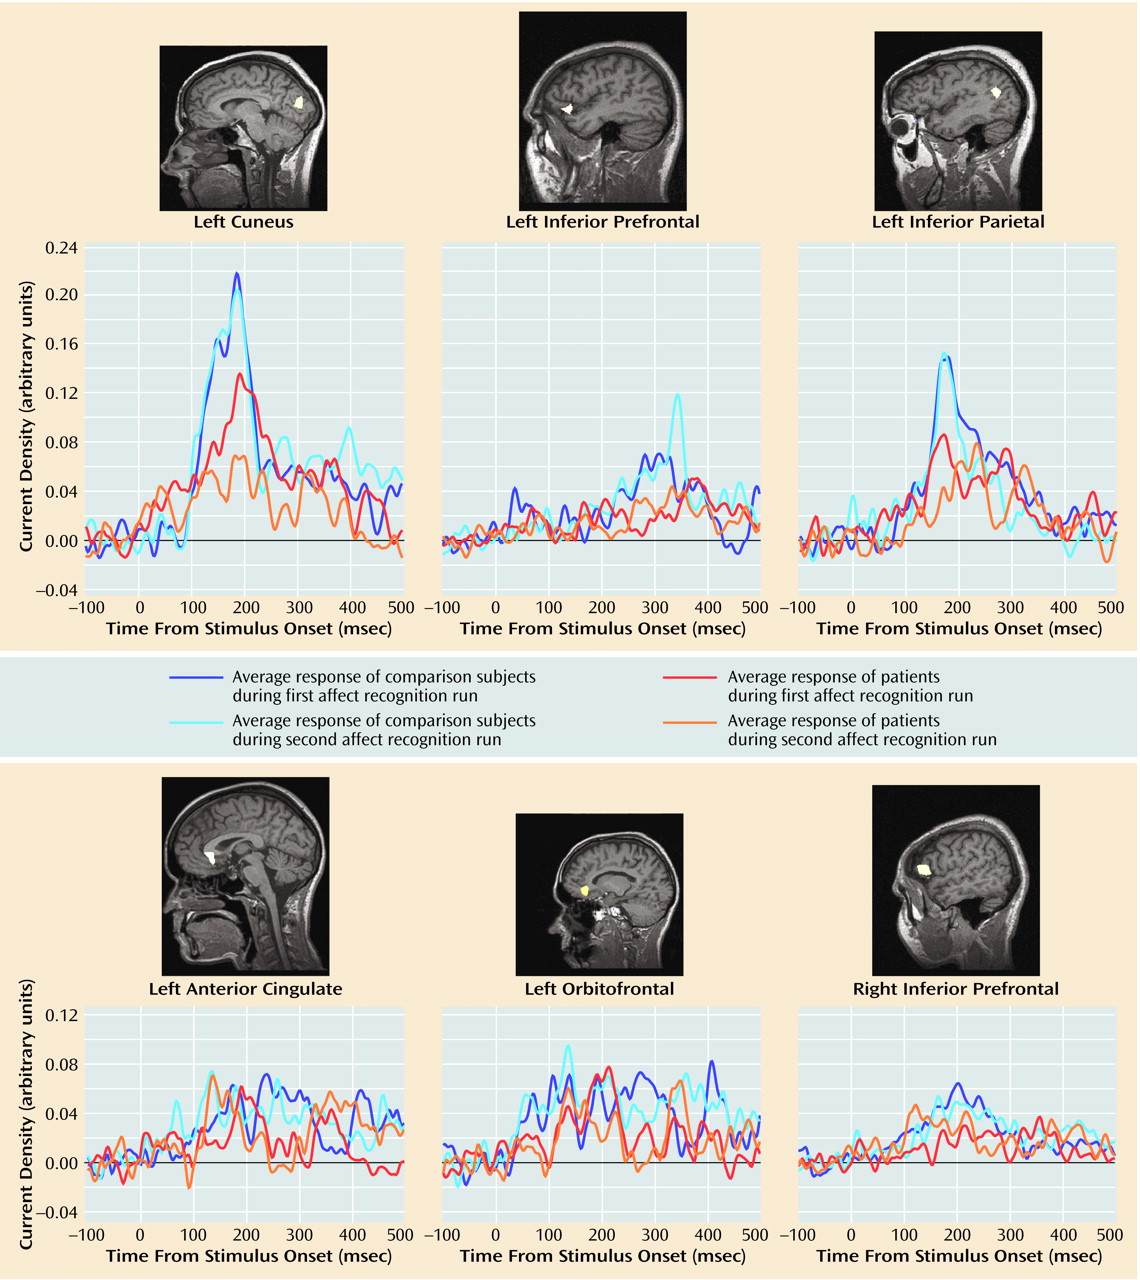
Figure 1). We found strong activations in 16 regions of interest within a total of 23 time windows (examples are shown in
Figure 2). As shown in
Table 1, 10 out of these 23 regional activations (in eight out of 16 regions of interest) were significantly stronger in the comparison group than in the patient group.
Group differences in peak latencies between the comparison subjects and patients were observed only in two regions of interest: the left orbitofrontal cortex within time window 1 (first affect recognition run: mean=127 msec [SD=24] versus 149 msec [SD=25], respectively; second affect recognition run: mean=135 msec [SD=27] versus 147 msec [SD=21]) (F=4.40, df=1, 25, p<0.05) and in the right inferior prefrontal cortex within time window 3 (first affect recognition run: mean=288 msec [SD=44] versus 332 msec [SD=52], respectively; second affect recognition run: mean=295 msec [SD=48] versus 325 msec [SD=58]) (F=5.34, df=1, 25, p<0.03). We are aware of the statistical weakness of finding differences in only two out of 23 comparisons, but we decided to mention this observation because in both cases the differences occurred in both of the affect recognition runs in the same regions of interest.
Correlations between current density and affect recognition performance (number of correct responses) were found in six out of 16 regions of interest (
Table 2). Correlations between latencies and task performance were not found.
The activations that differentiated groups by strength showed a relative consistent evolution in time across subjects: left cuneus (second activation), right posterior fusiform, right middle occipital, left inferior parietal, left cuneus (third activation), right inferior prefrontal, left anterior cingulate, left inferior prefrontal (second activation), left orbitofrontal (second activation).
Within the face and object categorization tasks, healthy subjects showed stronger neuromagnetic responses to neutral faces in four regions: left cuneus within time window 3 (F=5.09, df=1, 25, p<0.04), left inferior parietal cortex within time window 1 (F=7.75, df=1, 25, p=0.01), right middle occipital cortex within time window 2 (F=6.71, df=1, 25, p<0.02), and right middle fusiform gyrus within time window 2 (160–300 msec) (F=4.85, df=1, 25, p<0.04). Differences in four out of 23 comparisons are statistically weak but nevertheless are important to be mentioned. Correlations were not computed for this task, since behavioral performance reached 100% in both groups.
Differences in responses to blurred faces were only detected for one regional activation (out of 23 regions of interest/time windows), which is at chance level. Significant correlations between activations and task performance were not found.
We did not find an association between medication and behavioral performance in any of the face-processing tasks (df=13). Furthermore, chlorpromazine-equivalent doses were not associated with the regional activations (df=13).
Only two correlations between SANS global scores and regional activations were significant, which is at chance level (df=13). Positive symptoms were not associated with current density at all (df=13).
