MRI Image Acquisition
All scans were obtained on the same GE 1.5-T Signa scanner (GE Medical Systems, Milwaukee) by using the same three-dimensional spoiled gradient recalled echo in the steady state imaging protocol (axial slice thickness=1.5 mm, time to echo=5 msec, repetition time=24 msec, flip angle=45º, acquisition matrix=192×256, number of excitations=1, and field of view=24 cm). Foam padding was placed around the subject’s head to minimize scanner noise and help steady the head position. Vitamin E capsules, one in each ear and one taped to the left lateral inferior orbital ridge, were used to standardize head placement. Scans were evaluated clinically by a neuroradiologist and had no gross abnormalities. Researchers evaluating the scans for research measures were blinded to the subjects’ diagnoses. Total and regional gray and white matter volumes were generated by a fully automated system that classifies tissue according to voxel intensity using a probabilistic atlas and provides lobar (frontal, parietal, temporal, and occipital) parcellation of cortical gray matter volumes. Total cerebral volume was defined as the algebraic sum of all gray matter pixels and white matter pixels, excluding the cerebellum and brainstem. More detailed descriptions of the procedure have been given elsewhere
(37,
39,
40).
Anatomical boundaries for classification of brain voxels were based on a total of 4,000 points selected by a trained neuroanatomist for gray matter, white matter, CSF, fat, and background, by using reference space and the coordinate system from Talairach space
(41) (for example, the left lateral ventricle extends from –36 to 0 on the x axis, from –56 to 29 on the y axis and from –14 to 28 on the z axis in Talairach space). Complete information on anatomical boundaries is available on request and on our web site (http://intramural.nimh.nih.gov/chp/).
Occasionally scans were not available due to a variety of reasons (e.g., refusal from the patient, presence of metal objects in the body) or were discarded because of poor quality (i.e., motion artifact) by the automated processing software.
Statistical Analyses
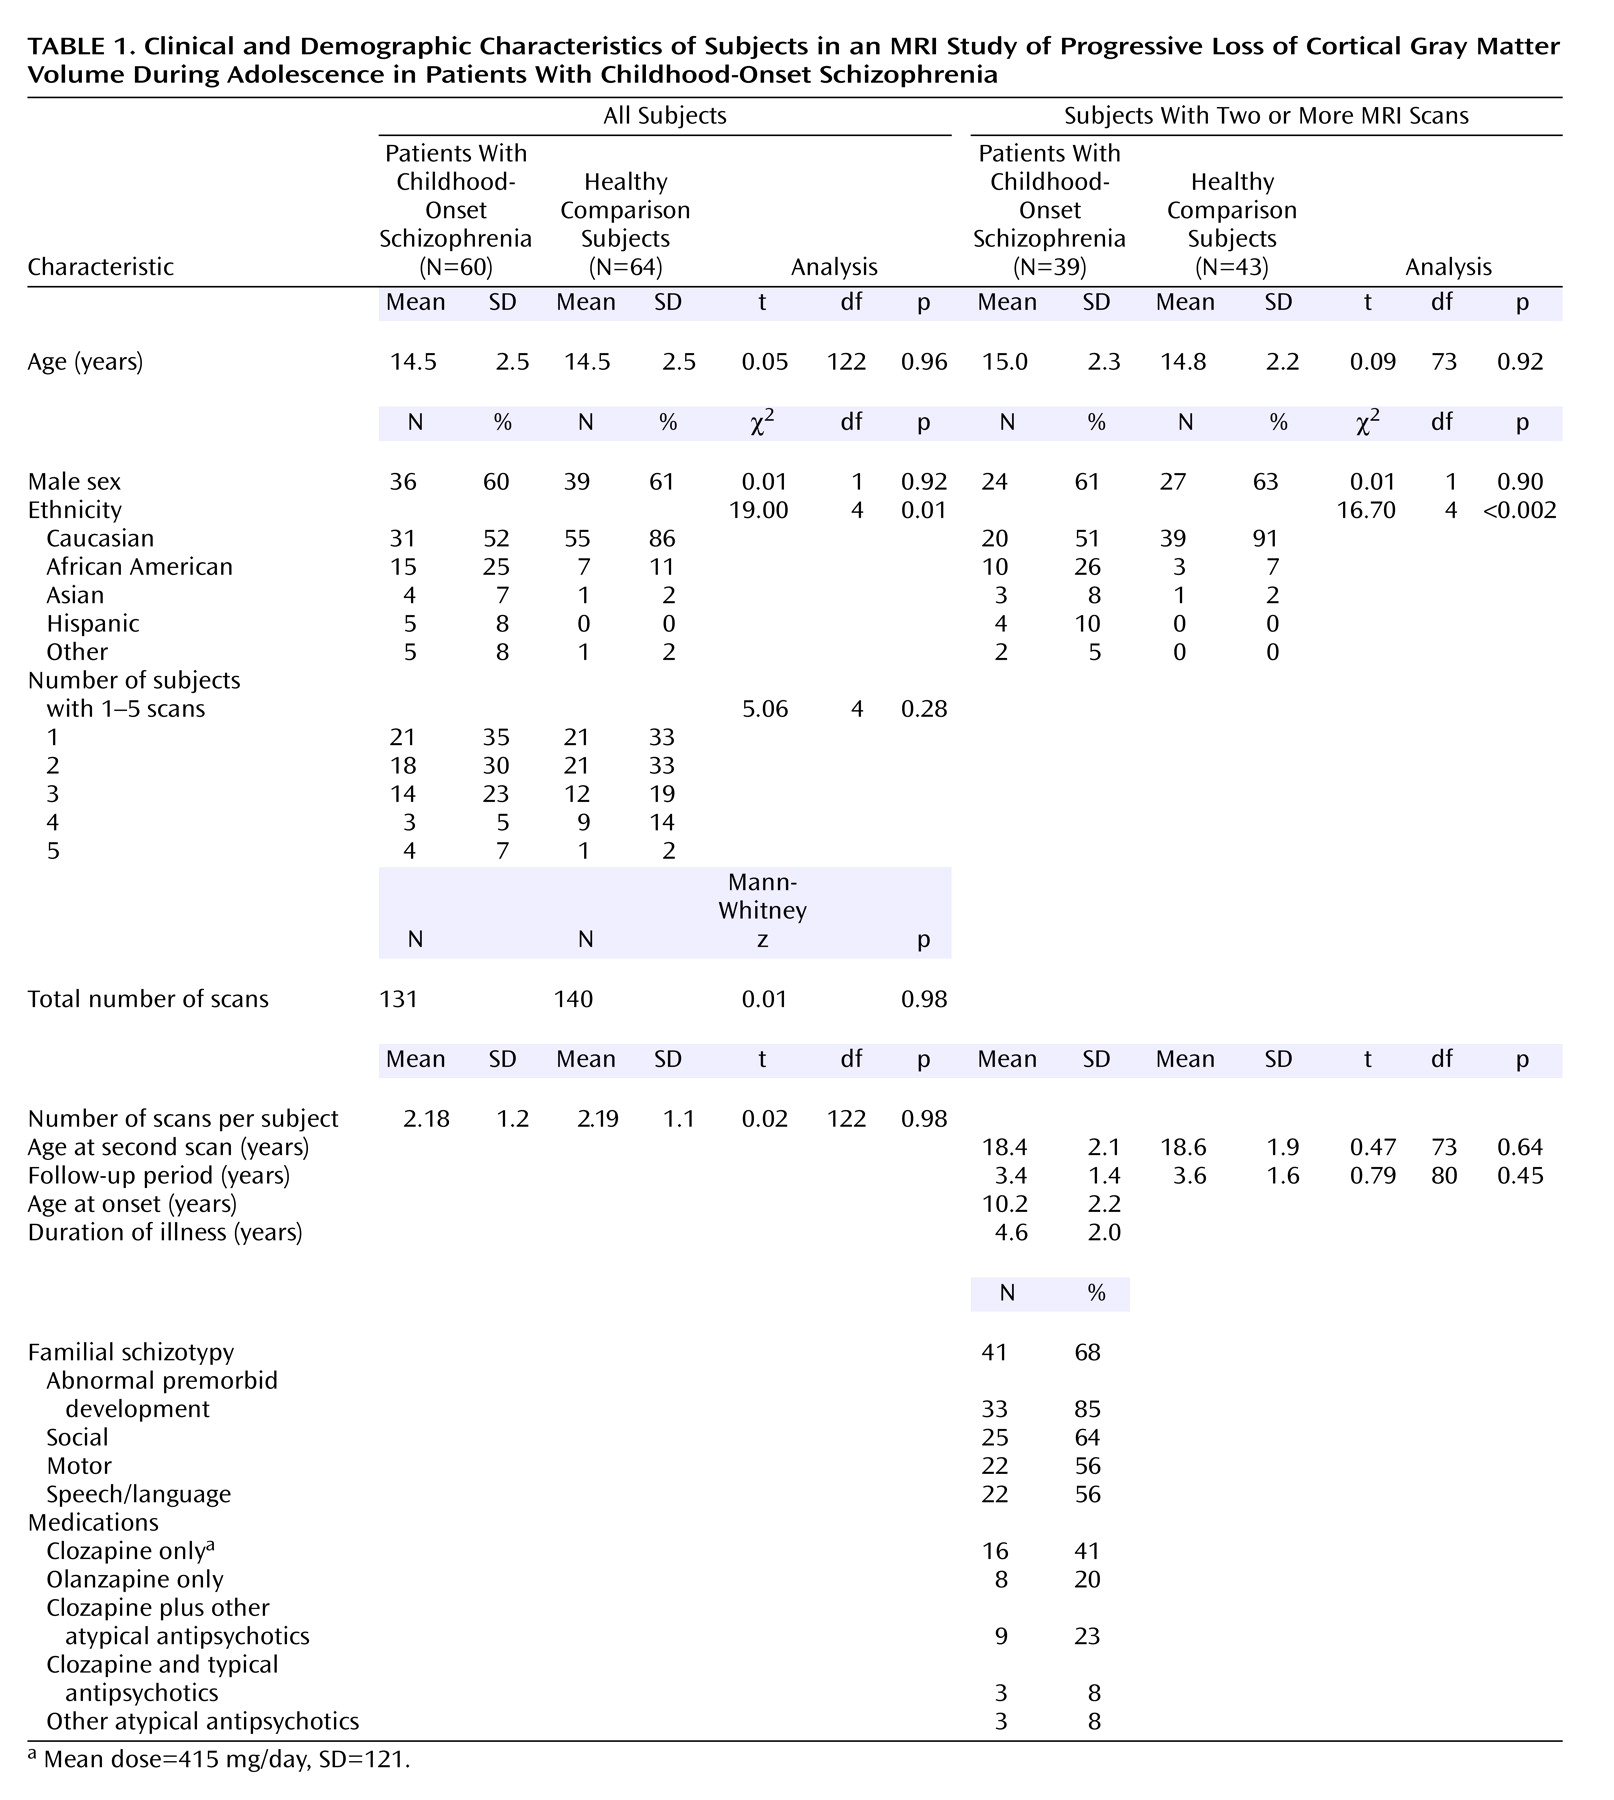
Demographic characteristics were compared for the childhood-onset schizophrenia group and the healthy comparison group and for subgroups with two or more scans by using t, Mann-Whitney, or chi-square tests, as appropriate.
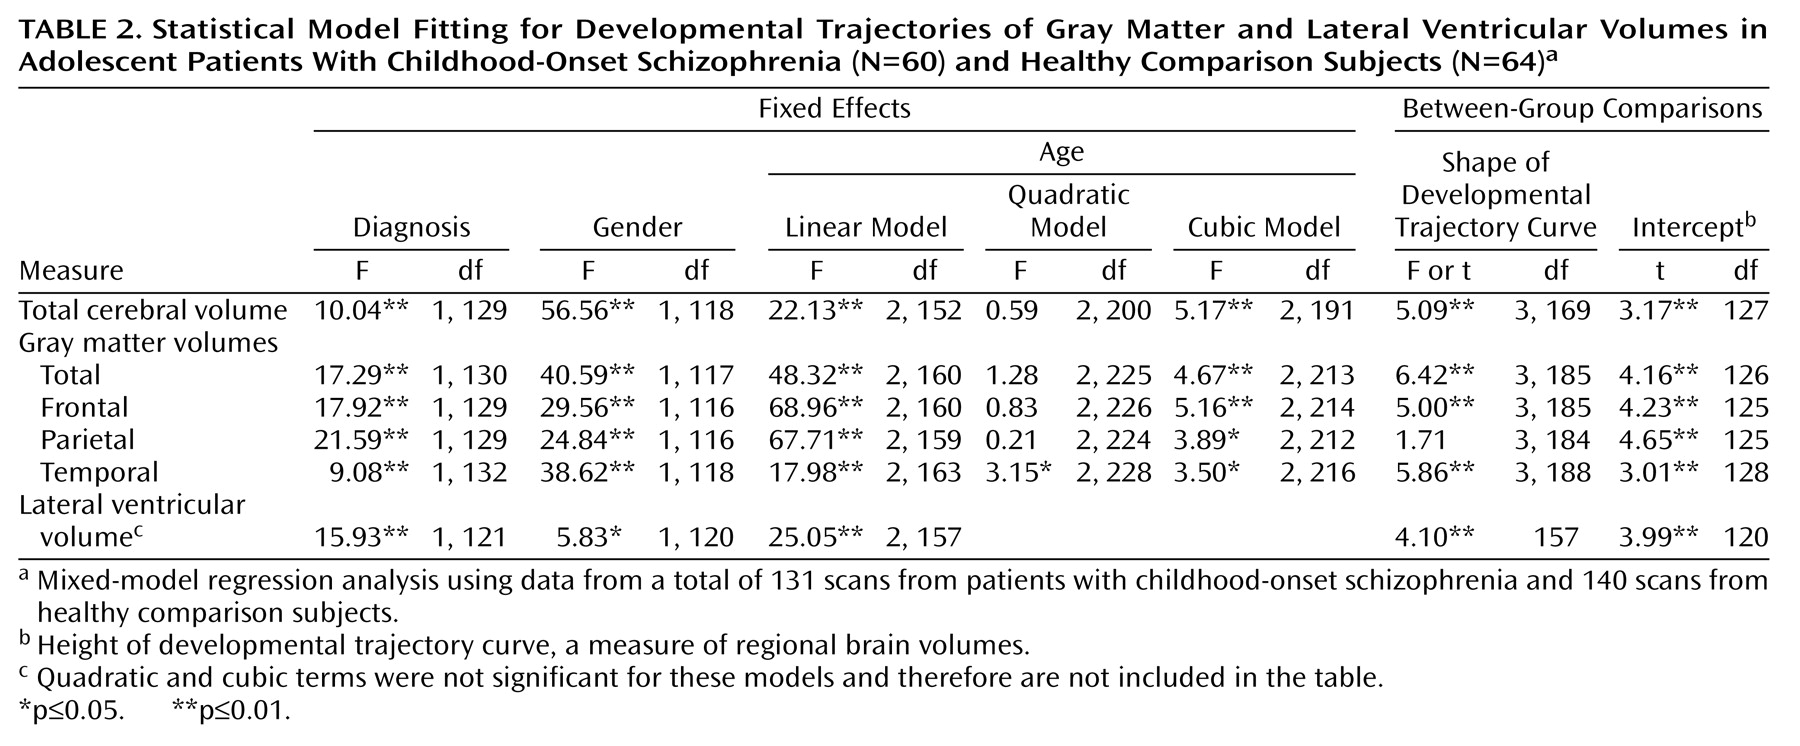
To evaluate age-related volumetric changes, developmental trajectories were generated by using mixed-model regression. All available scans for each subject were used for these analyses. A total of 131 scans were available for the 60 subjects with childhood-onset schizophrenia, and 140 scans were available for the 64 healthy comparison subjects.
Mixed-model regression has several advantages over more common statistical techniques such as polynomial regression or repeated measures analysis of variance. Specifically, it accounts for unbalanced data measured at irregular time intervals and for within-person correlation, such as multiple measures obtained from the same person. We were thus able to include participants with varying numbers of scans (one to five) and increase the statistical power to examine volume and age relationships.
Briefly, for a given structure, the ith individual’s jth measurement was initially modeled by using the following equation:
sizeij=intercept+di+Am(sex=m)+Af(sex=f)+B1(age–mean age) +B2(age–mean age)2+B3(age–mean age)3+eij,
in which di is a normally distributed random effect that models within-person dependence; the intercept, A, and B are modeled as fixed effects; eij represents the usual normally distributed residual error; Am and Af show how the individual’s sex affects the volume measurements; and B1, B2, and B3 show how volume changes with age. The initial models allowed for gender/diagnostic interactions in the shape of the growth curves. However, these models were not significant improvements over the final model that imposed parallel trajectories for male and female subjects. Due to space considerations these analyses were omitted.
In the final models, the intercept and
B terms were allowed to vary by diagnostic group, producing two growth curves with different height and shape characteristics. F tests were used to determine whether cubic, quadratic, linear, or constant growth models best fit the data. After the order of the model was determined (linear, cubic, or quadratic), F tests were used to see if the diagnostic curves differed in shape (i.e., if the coefficient for age terms differed between the groups). Parameter estimates of the fixed effects were used to generate fitted values in the graphs. Outliers were checked visually, and collinearity among explanatory variables was not an issue, as age, sex and diagnosis were not significantly correlated. Additional details regarding the mixed-model regression analysis are given elsewhere
(37,
42,
43).
Polynomial regression analyses using the first data point for each subject, mixed-model regression analyses using data only from subjects with two scans, and volumetric slope comparisons using data from scans before and after age 20 were also performed, but these analyses were not found to be informative owing to the insufficient number of cases.
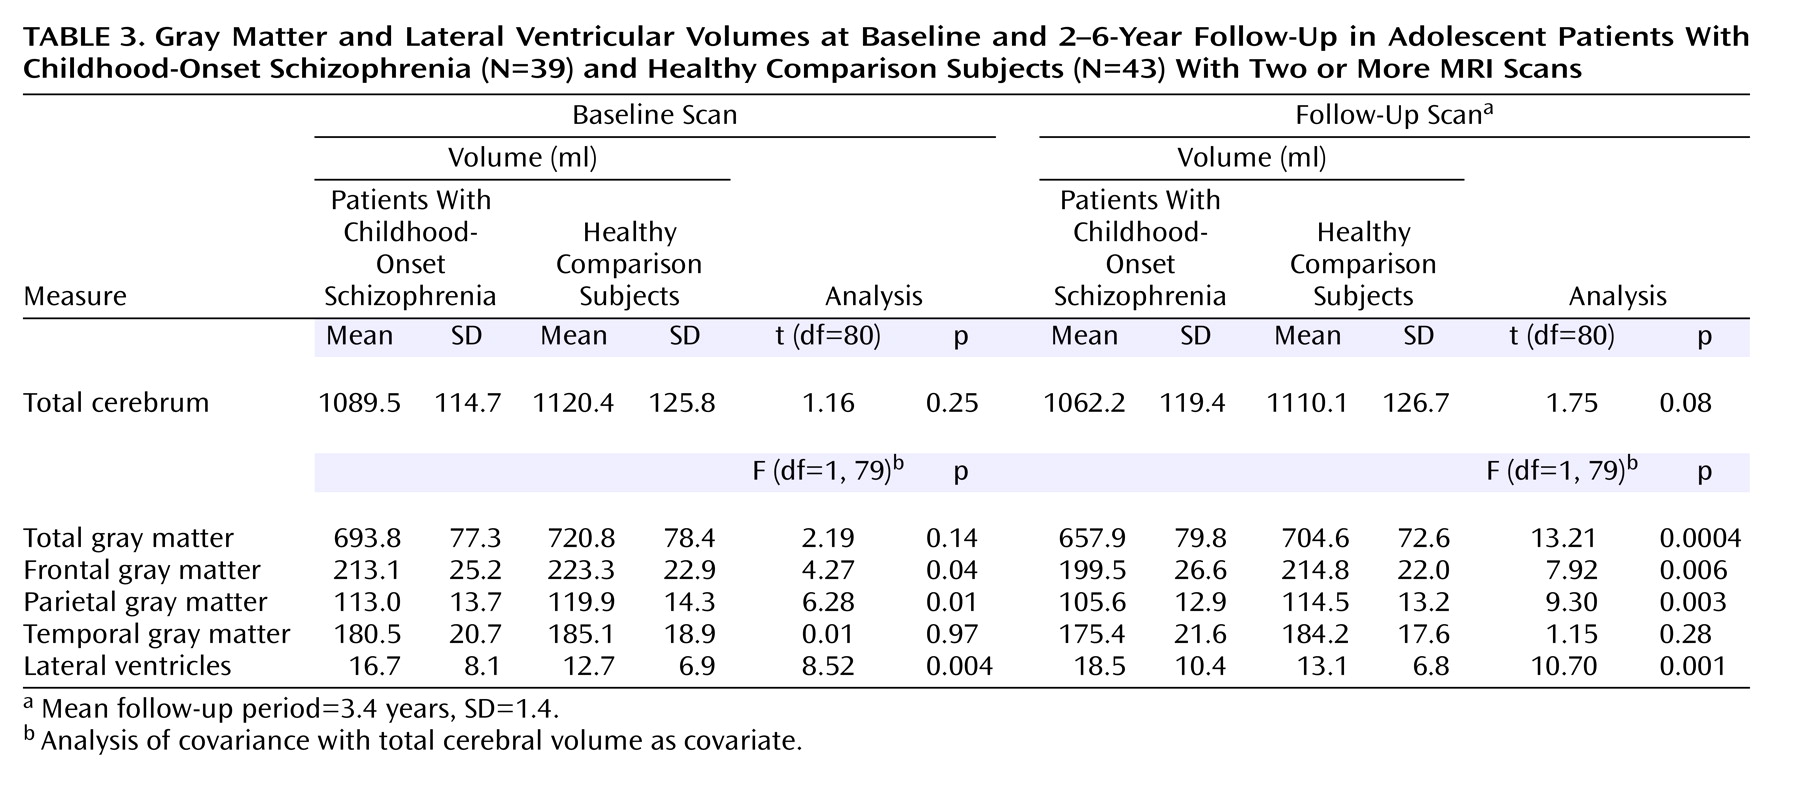
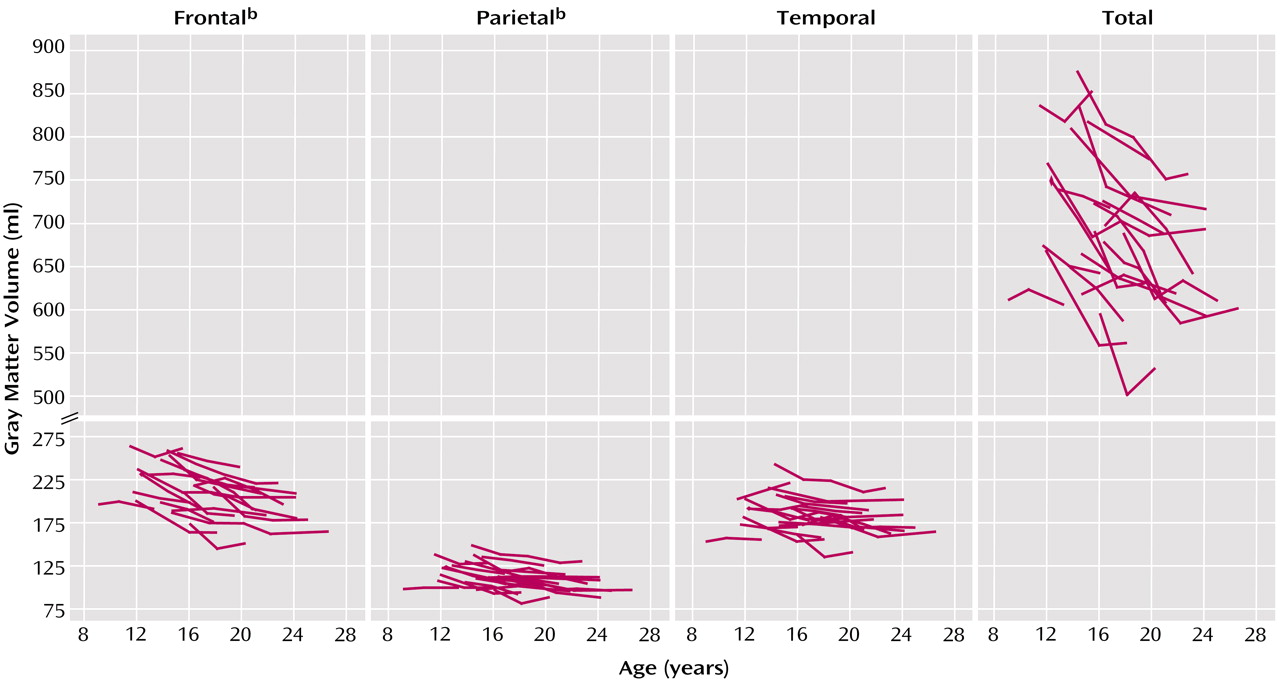
The rate of total gray matter volume change was calculated for the subjects with childhood-onset schizophrenia and the healthy comparison subjects who had at least two MRI scans available before age 21 (39 subjects with childhood-onset schizophrenia and 43 healthy comparison subjects). The total gray matter slope was defined as the follow-up scan value minus the first scan value divided by time elapsed between scans and expressed as milliliters per year (a negative value represented cortical volume reduction). This calculated linear slope was used as an approximation of the nonlinear/cubic developmental trajectory. By using the linear approximation we were able to examine the relationships between volumetric change and corresponding clinical measures in a straightforward, easily accessible manner.
For subjects with childhood-onset schizophrenia who had three or more scans (N=21), we used paired t tests to compare the total and regional gray matter slopes between the first and second scans versus the second and last (usually third) scans.
For the subjects with childhood-onset schizophrenia subjects who had two or more scans (N=39), baseline and follow-up clinical and neuropsychological measures were compared by using paired t tests. Finally, for this subgroup, the rate of gray matter reduction was examined as an outcome variable in relation to developmental and clinical measures by using stepwise regression analysis.
All statistics were performed by using SPSS 11.0.1
(44) or NCSS 2001
(45).
