Urban birth and upbringing are associated with later risk for schizophrenia
(1–
4). A plausible explanation for this finding is that one or more environmental risk factors for later psychotic outcomes that operate early in life are prevalent in urban areas
(5). If urbanicity represents an as yet unknown environmental risk factor for schizophrenia, the question arises as to what degree this risk interacts with personal vulnerability factors, in particular familial liability to psychosis, which is thought to largely represent the influence of shared genes rather than shared environment
(6,
7). Biological synergism between genetic liability and environmental risk is thought to be common in multifactorial disorders such as schizophrenia
(8–
11). However, recent progress in the study of interactions indicates that the most frequently used statistical models of interaction are not suitable for identifying biological synergism. For example, the commonly used statistical models in which genes and environment multiply each other’s effects (multiplicative models) assume that individuals who are exposed to both the genetic and the environmental factors cannot have contracted the illness because of the effect of genes alone or of the environment alone
(12). It has been shown that the true degree to which two causes coparticipate in producing an outcome can be estimated from (but is not the same as) the additive statistical interaction (see reference
12). This method was recently applied to risk for schizophrenia to show synergy between traumatic head injury and familial liability
(13). In the current study, we wished to investigate to what degree urbanicity and familial liability for psychosis coparticipate in producing psychosis outcomes, using recently specified models to examine biological synergism between two causes.
Method
Subjects
The Netherlands Mental Health Survey and Incidence Study is a prospective study with three measurement points (time 1, time 2, and time 3) over a period of 3 years
(14,
15). The current report is based on the lifetime prevalence of psychosis assessed at time 1 (N=7,076 responders) and on first-degree family history data assessed at time 2 (N=5,618 responders). A multistage, stratified, random sampling procedure was used to identify a total of 7,076 individuals (response rate: 69.7%) who provided written informed consent in conformity with the local ethics committee guidelines. Nearly 44% of the nonresponders agreed to complete a postal questionnaire, including a General Health Questionnaire
(16), and were found to have the same mean General Health Questionnaire score as the responders (mean score=1.19 for the responders and 1.16 for the nonresponders). Nonresponse was not associated with the level of urbanicity
(14,
15).
Instruments
Subjects were interviewed at home. The Composite International Diagnostic Interview (CIDI) version 1.1
(17) was used, yielding DSM-III-R diagnoses. The CIDI was designed for use by trained interviewers who are not clinicians and has been found to have high interrater reliability
(18) and high test-retest reliability
(19). Ninety interviewers experienced in systematic data collection collected the data, after having received a 3-day training course in recruiting and interviewing, followed by a 4-day course at the World Health Organization CIDI training center in Amsterdam. Extensive monitoring and quality checks took place throughout the data collection period
(15).
Psychosis Ratings
Lifetime ratings from the 17 CIDI core psychosis sections on delusions (13 items) and hallucinations (four items) were used (items G1–G13, G15, G16, G20, G21). These items concern classic psychotic symptoms involving, for example, persecution, thought interference, auditory hallucinations, and passivity phenomena. These items can be rated in six ways: 1=no symptom, 2=symptom is present but not clinically relevant (the person is not bothered by it and not seeking help for it), 3=symptom is a result of ingestion of drugs, 4=symptom is a result of somatic disease, 5=true psychiatric symptom, 6=symptom may not really be a symptom because there appears to be some plausible explanation for it. Because psychotic symptoms are difficult to diagnose in a structured interview
(20), clinical reinterviews were conducted over the telephone by an experienced trainee psychiatrist for all individuals who had at least one rating of 5 or 6. Questions from the Structured Clinical Interview for DSM-III-R (SCID), an instrument with proven reliability and validity in the diagnosis of schizophrenia
(21), were used in the clinical reinterviews. CIDI ratings were corrected on the basis of these reinterviews.
In the baseline sample of 7,076 responders, the prevalences of the possible CIDI ratings for the 17 psychosis items were: N=915 (12.9%) for any rating of 2, N=39 (0.6%) for any rating of 3 or 4, N=295 (4.2%) for any rating of 5, and N=285 (4.0%) for any rating of 6. Validation of the contrasts implied by these ratings has been presented previously
(4,
22).
The Netherlands Mental Health Survey and Incidence Study lifetime DSM-III-R diagnoses of psychotic disorder are based on the data from the clinical reinterviews. Psychotic disorder outcome was defined as any DSM-III-R affective or nonaffective psychotic diagnosis.
Level of Urbanicity
Five levels of urbanicity were defined, following the standard classification of the Dutch Central Bureau of Statistics for the level of urbanization of places of residence. The classification is based on a measure of residential density consisting of the number of addresses per km2 within a circle with a radius of 1 km from a given place of residence as the center of the circle. The mean residential density of all the addresses within a geographical area constitutes the level of urbanicity of that area. Levels 1–5 in the classification designate <500, 500–999, 1000–1499, 1500–2499, and ≥2500 addresses per km2, respectively.
Risk Set
The risk set consisted of 5,550 individuals who 1) had valid CIDI psychosis ratings at baseline and 2) had valid family history data at time 2. The risk set included 2,571 men (46.3%). The mean age of the entire risk set was 41.0 years (SD=11.9). Of the 5,550 individuals, 78 (1.4%) had a DSM-III-R diagnosis of affective or nonaffective psychosis, 211 (3.8%) had at least one CIDI symptom rating of 5, and 694 (12.5%) had at least one CIDI symptom rating of 2.
Family History of Psychosis
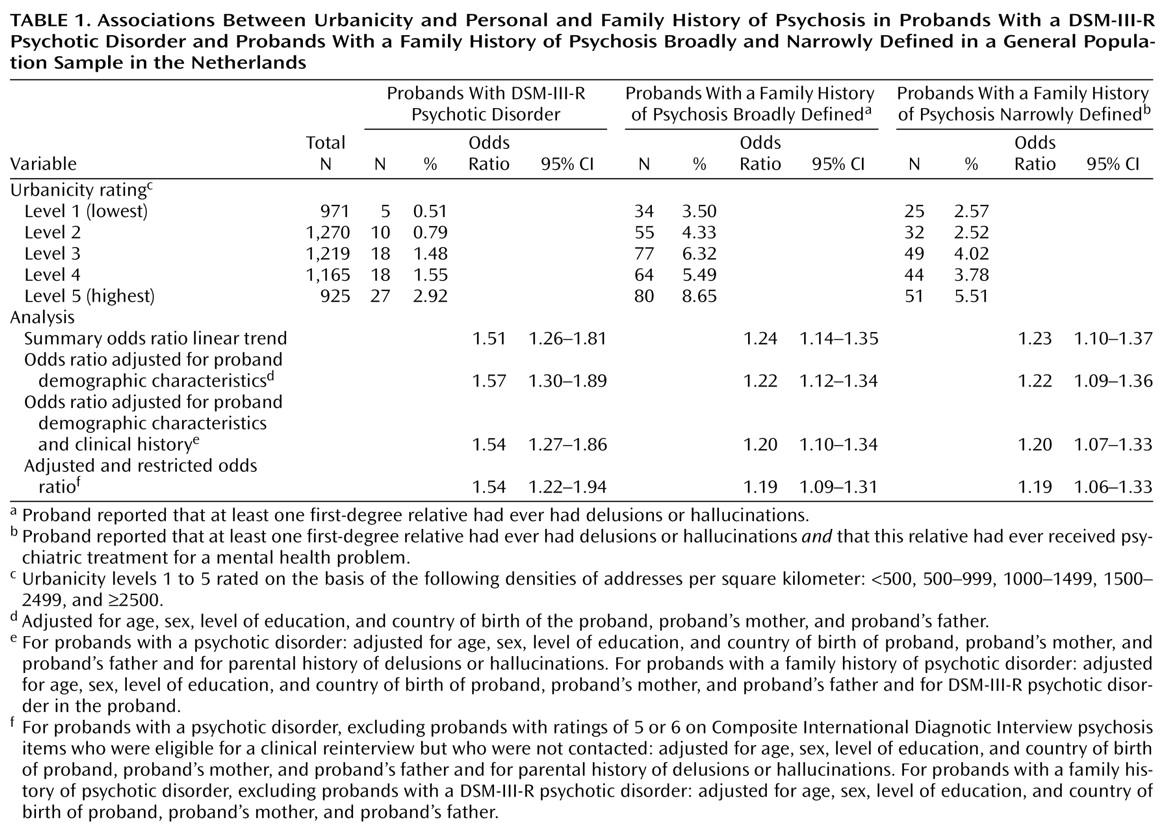
At the time 2 interview, subjects were asked whether each first-degree relative had ever had delusions or hallucinations. In addition, subjects were asked if any first-degree relative or half-sibling had ever received treatment from a psychiatrist or had ever been admitted to a psychiatric hospital for a mental health problem. The risk set included 310 probands (5.6%) who indicated that a first-degree relative had ever had delusions or hallucinations, 201 (3.6% of the risk set) of whom indicated that the relative with delusions or hallucinations had received psychiatric treatment. These two groups were designated, respectively, those with a family history of psychosis broadly defined and those with a history of psychosis narrowly defined. A total of 804 probands (14.5%) reported a family history of psychiatric treatment for conditions other than delusions or hallucinations.
The validity of these measures was examined by using logistic regression. A family history of psychosis broadly defined was strongly associated with a family history of treatment by a psychiatrist or admission to a psychiatric hospital (odds ratio=16.88, 95% CI=12.89–22.10) and family history of suicide (odds ratio=7.99, 95% CI=5.09–12.56). A family history of treatment for delusions or hallucinations (family history of psychosis narrowly defined) was strongly associated with any DSM-III-R psychotic disorder in the probands (odds ratio=5.08, 95% CI=2.70–9.56), and the association remained when adjusted for the effect of a family history of any psychiatric treatment (odds ratio=2.89, 95% CI=1.37–6.09). Family history of treatment for delusions or hallucinations (family history of psychosis narrowly defined) was weakly associated with any DSM-III-R disorder (psychotic or nonpsychotic) in the probands (odds ratio=1.70, 95% CI=1.28–2.25), and the association did not remain after adjustment for a family history of any psychiatric treatment (odds ratio=1.13, 95% CI=0.83–1.54).
Data Analyses
The lifetime prevalences of psychotic disorder in the probands, family history of psychosis broadly defined, and family history of psychosis narrowly defined were examined in relation to the level of urbanicity of the place of residence, with the result adjusted for the a priori selected possible confounding effects of age in years; sex; level of education (four levels); and country of birth of the proband, the proband’s mother, and the proband’s father (coded Dutch-born, foreign-born, or data missing). In addition, to assess whether any effect of urbanicity on psychotic disorder in the probands could be explained by urban drift of parents with vulnerability to psychosis, the analysis adjusted for a history of delusions or hallucinations in the mother or the father as reported by the proband. To assess whether any effect of urbanicity on psychosis in the relatives could be explained by a reporting bias in probands with psychotic disorder, analyses excluding data from probands with a DSM-III-R psychotic disorder were also conducted.
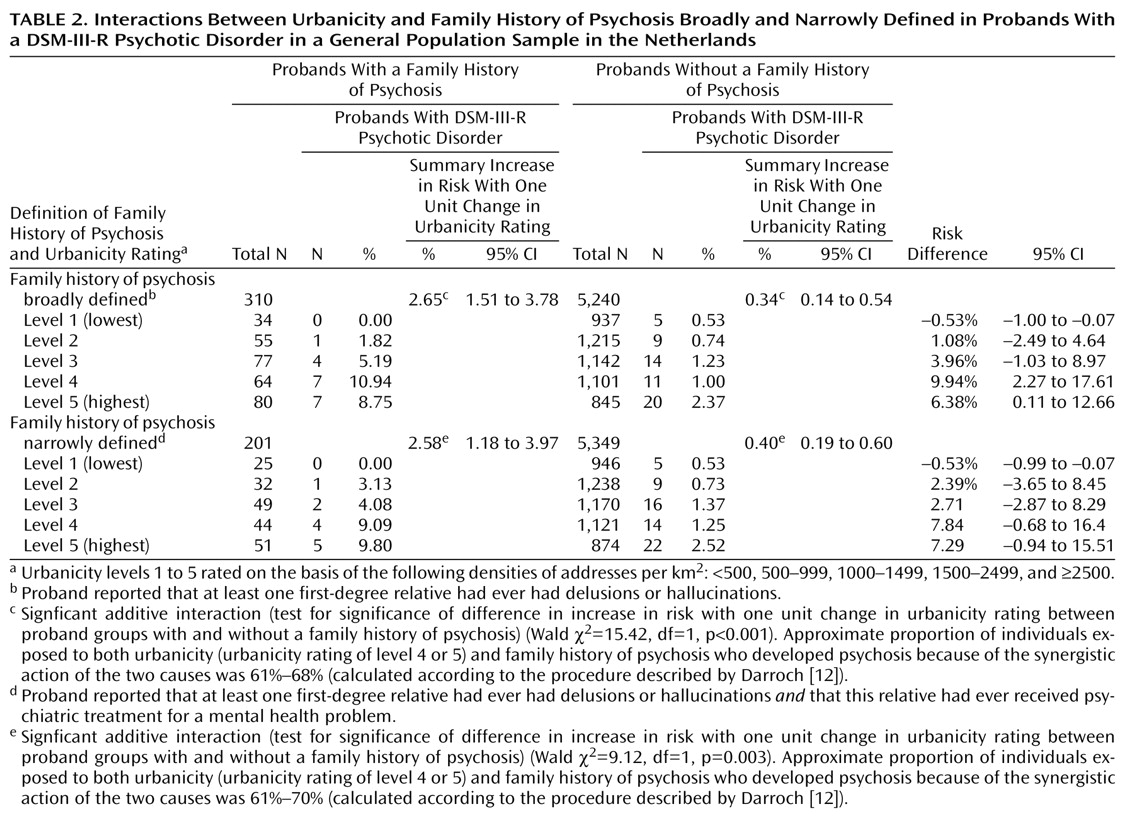
In line with recent advances in the conceptualization of interaction, we calculated the statistical additive interaction and used the result to estimate the amount of biological synergism between urbanicity and family history in the population. This was done by using the calculations developed by Darroch
(12). For these analyses, a dichotomized measure of urbanicity was used (levels 1, 2, and 3 were coded as 0, and levels 4 and 5 were coded as 1). To calculate the statistical interaction under an additive model, the BINREG procedure in STATA
(23), which fits generalized linear models for the binomial family estimating risk differences
(24,
25), was used to model interactions between urbanicity and family history in the risk set. The statistical significance of the interactions was assessed by using the Wald test
(26). To examine the specificity of any interaction between family history of psychosis and urbanicity, we also examined the interaction between urbanicity and family history of a nonpsychotic condition.
Sensitivity Analysis
Of the total of 479 individuals who were eligible for a clinical reinterview over the telephone at baseline, 226 (47.2%) were actually interviewed. To examine whether the results were affected by the incomplete clinical reinterview rate, we conducted a sensitivity analysis excluding the individuals who were eligible for clinical reinterview but who were not contacted, thus leaving only those who had been rated by clinicians.


