
Abstract

Objective: An initial pharmacogenetic study of the Sequenced Treatment Alternatives to Relieve Depression (STAR*D) clinical trial reported an association between genetic variation in the HTR2A gene and outcome of citalopram treatment. By design, the study analyzed only those markers that showed reproducible association in the first wave of genotypes (comprising 1,297 patients) in the complete cohort of patients. The purpose of the present study was to utilize a second wave of genotype results, for a more powerful analysis, in the complete cohort of patients with available deoxyribonucleic acid (DNA) samples. Method: The authors tested the association between treatment response and 768 markers that were genotyped in the full set of 1,816 eligible patients from the STAR*D cohort. In order to control for multiple testing, the subjects were divided into two study groups: discovery and replication. Results: In addition to the previously identified marker in the HTR2A gene, a new marker (rs1954787) in the GRIK4 gene, which codes for the kainic acid-type glutamate receptor KA1, was observed. The effect size of the GRIK4 marker alone was modest, but homozygote carriers of the treatment-response-associated marker alleles of both the GRIK4 and HTR2A genes were 23% less likely to experience nonresponse to treatment relative to participants who did not carry any of these marker alleles. Conclusions: The findings demonstrate that genetic variation in a kainic acid-type glutamate receptor is reproducibly associated with response to the antidepressant citalopram. This finding suggests that the glutamate system plays an important role in modulating response to selective serotonin reuptake inhibitors (SSRIs).
The pharmacogenetic study of major depression aims to provide novel insights into the causes and treatment of this common mental illness. The Sequenced Treatment Alternatives to Relieve Depression (STAR*D) study (14) collected deoxyribonucleic acid (DNA) samples from a large study group of outpatient participants with nonpsychotic major depressive disorder who were systematically treated and longitudinally evaluated. The study offered an unprecedented opportunity to determine the genetic correlates of treatment outcome and adverse events. Response and remission rates up to the first 14 weeks of treatment with the selective serotonin reuptake inhibitor (SSRI) citalopram, referred to as Level 1, have been described elsewhere (2) .
Recently, an initial genetic screen of Level 1 outcomes in the STAR*D cohort was reported (4) . The study tested 768 markers in 68 candidate genes for reproducible association with treatment outcome in the first two-thirds of the cohort and followed up significant findings in the total cohort. Reproducible association was detected between treatment response and a marker in the HTR2A gene, which encodes a serotonin receptor previously implicated in antidepressant mechanisms. In the present study, results from the full set of 1,816 genotyped individuals screened with the same set of markers were examined. Additionally, 634 psychiatrically healthy comparison subjects were gentoyped. These data allow us to address the question of whether case groups defined by treatment outcome differ from each other genetically and from comparison subjects.

Method

Patients, Cohorts, and Phenotypes

Detailed descriptions of the study population (2), methods of DNA extraction, phenotypic definitions, clinical outcomes of Level 1, and our initial report from the first wave of genotyping 
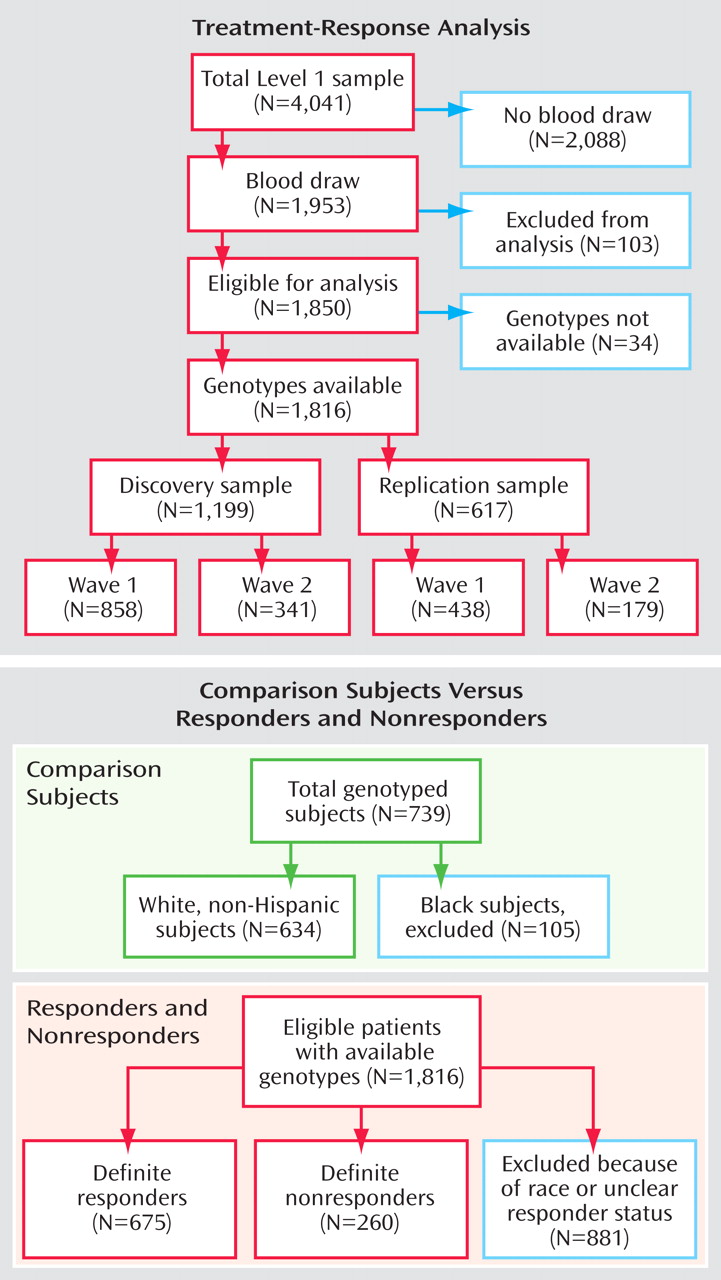
(4) are available elsewhere. In brief, DNA samples were available from 1,953 individuals affected by a major depressive episode and who sought outpatient treatment at one of 41 STAR*D clinical trial sites. A total of 103 DNA samples were excluded from analysis because of missing clinical data, noncompliance with the treatment protocol, or suspected sample mix-ups, leaving 1,850 samples for analysis. Of these, genotypes were available for 1,816 individuals, on which the results reported in the present study are based (a CONSORT diagram is shown in Figure 1 ). All subjects gave written informed consent to participate in the clinical study and a separate written informed consent for collection and analysis of their blood samples. The study was supervised by the institutional review boards at all participating institutions and the Data Safety and Monitoring Board at the National Institute of Mental Health (NIMH). All definitions of primary outcomes were agreed upon before commencing genotype analyses.
Figure 1. CONSORT Chart of the Study
Participants were enrolled without regard to race or ethnicity. Self-reported race and ethnicity data were available. For the purposes of this study, race was collapsed into “white,” “black,” or “other;” ethnicity was taken as reported (“Hispanic” or “Non-Hispanic”).
Severity of depression was assessed using the 16-item Quick Inventory of Depressive Symptomatology-Clinician Rated (5, 6) . Individuals with a baseline score of 10 or more were eligible for these analyses. All patients received citalopram. Anxiolytics, sedative hypnotics, and other medications for concomitant general medical conditions were the only additional medications allowed.
To allow for treatment drug intolerance, we grouped participants based on reported side effects. In general, if participants left the study or refused to continue the same medication in a later stage and indicated side effects as the reason, they were considered “intolerant.” If they were willing to continue the medication in follow-up or in a later study level, they were considered “tolerant.” If neither of these situations applied, a designation of “probably tolerant” or “probably intolerant” was assigned based on the degree of side effect burden reported or, in the few persons for whom the data was unavailable, the length of time they continued receiving the medication. Further details on tolerability can be found in the initial genotyping report (4) .
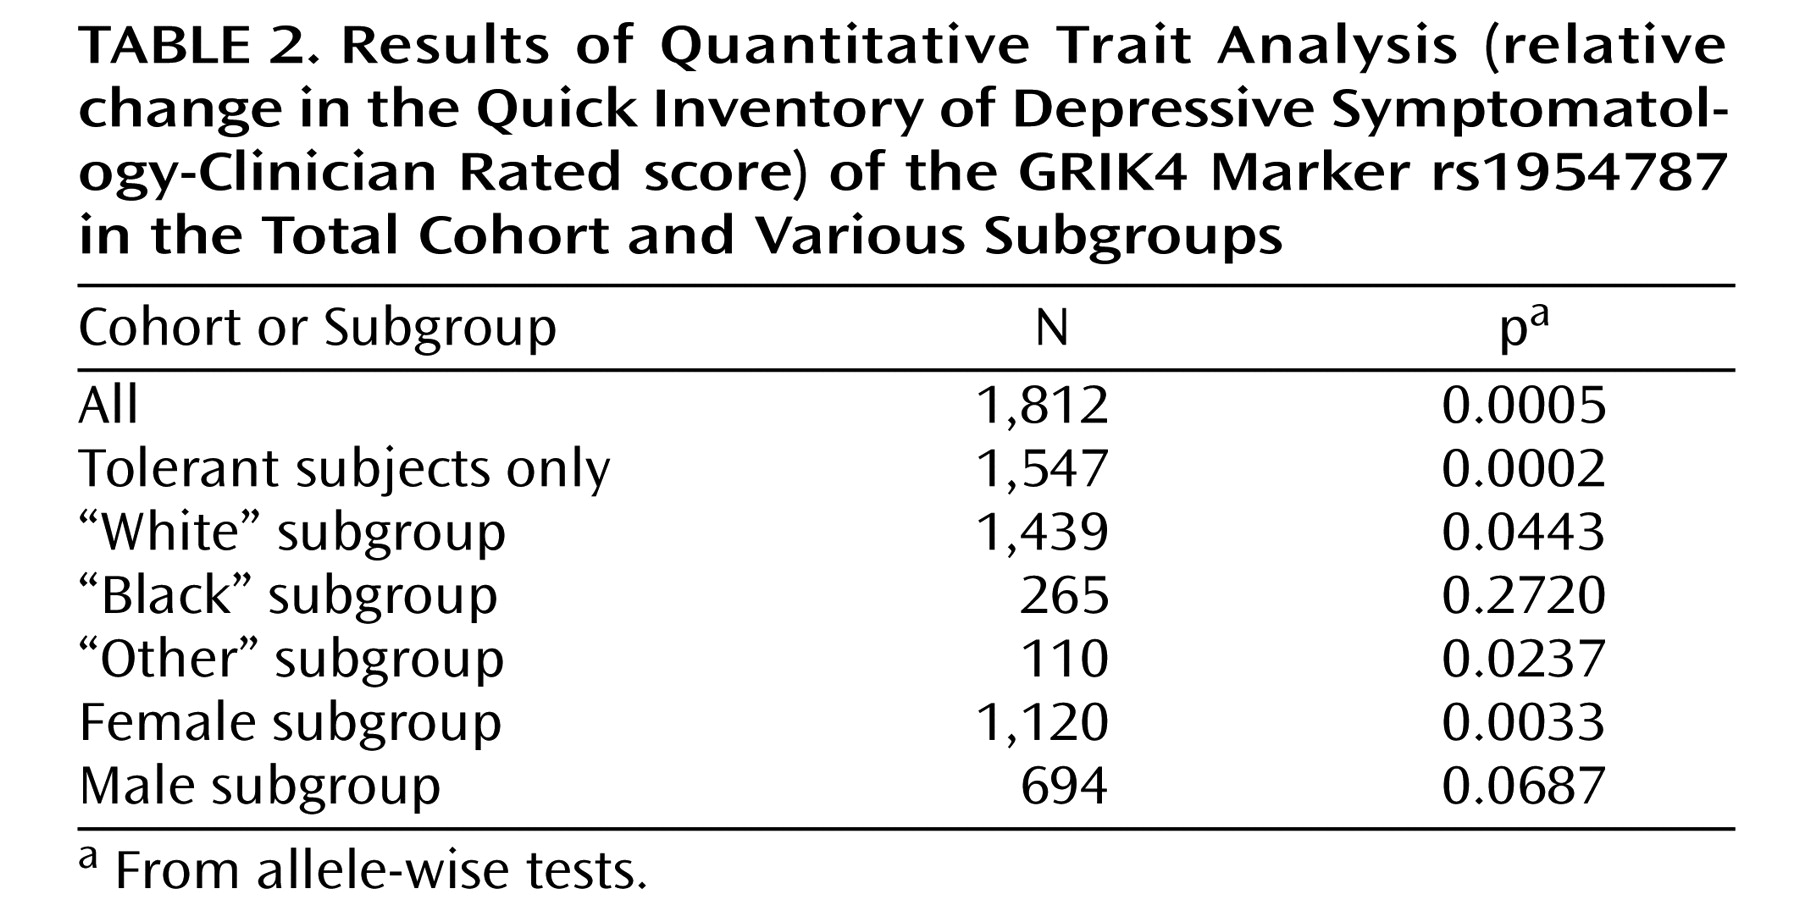
Primary outcomes of the treatment were “remission,” defined by an exit score of 5 or less, and “response,” defined by a reduction of at least 50% on the Quick Inventory of Depressive Symptomatology-Clinician Rated at the last visit receiving citalopram. To avoid misclassification, individuals with an exit score of 6 to 9 were excluded from both the “nonremitter” and “remitter” groups. Similarly, “nonresponders” were defined by a reduction of less than 40% from the baseline score. Individuals with at least a 40% but less than 50% reduction were excluded from all analyses presented in this study. Patients who completed less than 6 weeks of treatment were also excluded from analyses of these outcomes. Additionally, participants who did not respond to treatment but were classified as “intolerant” or “probably intolerant” were excluded. However, subjects who responded to treatment but who were intolerant (or probably intolerant) were included in the analyses. The rationale for this asymmetry was that intolerant patients may have dropped out of the study if they did not see any benefit of the treatment, while those with some improvement of depressive symptoms may have remained compliant despite any side effects. Relative reduction ([startscore-endscore]/startscore) of the Quick Inventory of Depressive Symptomatology-Clinician Rated score during the course of the trial was also analyzed as a quantitative trait.
Exploratory analyses were conducted on alternative cohort subsets. These included tests of association in tolerant (or probably tolerant) subjects only, tests in men and women separately, and tests in cohorts from white or black participants only.

Comparisons

Comparison DNA samples (N=739) were obtained from the Rutgers DNA repository. These comparisons were collected via population sampling after participants provided written informed consent, under the auspices of the NIMH Genetics Initiative for Schizophrenia, and completed a basic psychiatric screening. Individuals who met DSM-IV criteria for major depression or reported a history of bipolar disorder or psychosis were excluded.
Within the comparison cohort, 105 individuals were self-reported as “black.” These individuals were excluded from the analyses in this study. All remaining individuals in the comparison study group identified themselves as “white, non-Hispanic.” Thus, all comparisons between comparison subjects and the STAR*D patients are confined to patients who self-reported as “white, non-Hispanic” ( Figure 1 ).

Candidate Genes and Marker Selection

Altogether, 768 markers covering 68 candidate genes were studied. The complete list of genes and the criteria for marker selection have been published previously (4) . Genes were chosen based on their role in major neurotransmitter systems or other pathways thought to be involved in antidepressant outcome or mood disorders and were prioritized if functional variants were known. The gene list was completed by adding known members of targeted gene families (e.g., additional isoforms of serotonin or glutamate receptor subunits). Each gene was covered with all available markers from the HapMap Phase I (7), with a minor allele frequency of 7.5% or greater. To avoid redundancy, markers with a pairwise r 2 correlation of ≥0.8 with any other selected marker (8) were not genotyped. Six nonsynonymous single nucleotide polymorphisms and four single nucleotide polymorphisms previously implicated in response to antidepressant treatment were added (9, 10), resulting in 768 markers.

Genotyping and Quality Control

All 1,953 patient DNA samples and 739 comparison DNA samples were shipped to Illumina Inc. (La Jolla, Calif.) and genotyped on the highly accurate Bead-Array platform (11) . The genotyping success rate was 99.90%, and 99.73% of samples were successfully genotyped. Overall, 35,052 duplicates were analyzed by Illumina, and 878 samples were typed for four markers, both at Illumina and in the NIMH laboratory. No discrepancies were detected.

Statistical Analysis

We followed the analysis plan previously described (4), but included the full set of 1,816 eligible individuals who were genotyped by Illumina. In the present study, identification of the previously identified HTR2A gene association was not considered to constitute a replication or confirmation of the earlier finding, since the same analysis plan was followed with the same markers and DNA samples. Instead, the present results are an extension of the previous study, completed with a maximum available power in the total cohort of 1,816 individuals. The primary outcomes were response and remission, as previously defined in this article. As in the previous study 
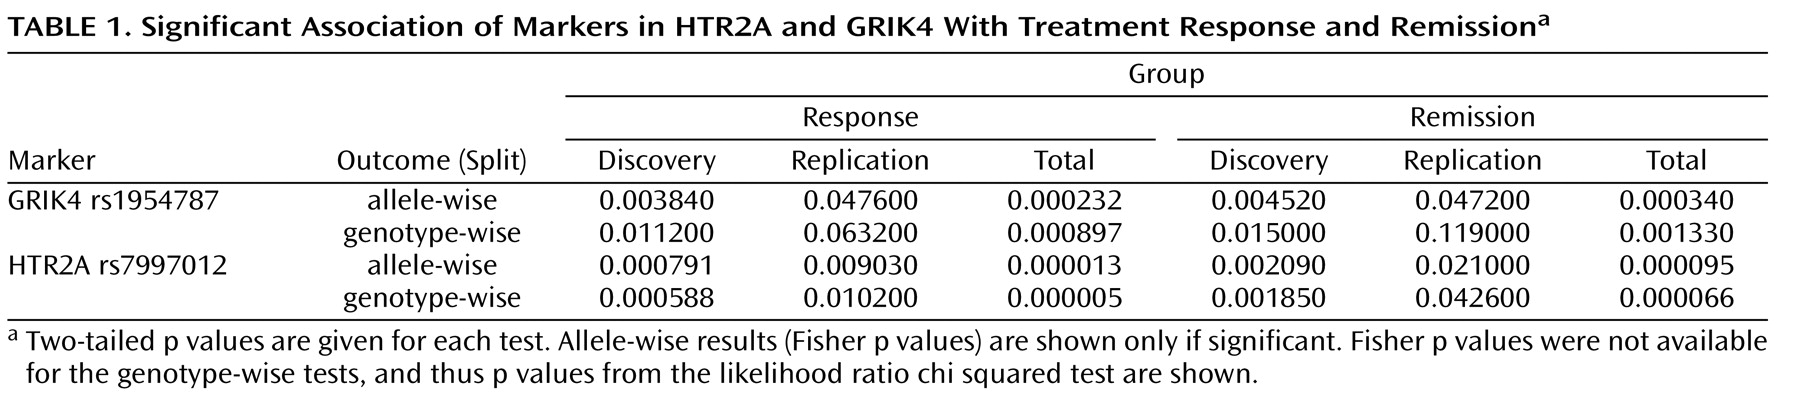
(4), the cohort was divided into a “discovery” group, comprising two-thirds of the cohort, and a “replication” group, comprising the remaining one-third. The two study groups were matched for sex and ethnicity (“white,” “black,” or “other”). Each categorical outcome was tabulated against each marker and was coded in the following three ways: 1) presence versus absence of allele 1, 2) presence versus absence of allele 2, and 3) the three-valued genotype. For each analysis, Fisher’s two-sided exact (for allele-wise tests only), Pearson’s chi-square, and the likelihood ratio chi-square tests were considered. These analyses were implemented in the SAS FREQ Procedure (SAS Institute Inc., Cary, N.C.). Fisher’s exact test provided the most conservative results. Therefore, the results of the treatment-response association reported in the present study are based only on the Fisher’s exact test. Based on power analyses (4), we considered a p≤0.01 in the discovery study group and a p≤0.05 in the replication study group to be a significant association, provided that the direction of the association was consistent between the two groups. For the quantitative trait, relative reduction in Quick Inventory of Depressive Symptomatology-Clinician Rated, analyses of variance (ANOVAs) were performed as implemented in the SAS ANOVA procedure (SAS Institute Inc., Cary, N.C.).
For exploratory analyses (in subgroups based on tolerability, sex, or race), findings in the present study cleared the predefined levels of significance in at least one of the three tests (Fisher’s two-sided exact [for allele-wise tests only], Pearson’s chi-square, and the likelihood ratio chi-square tests). Case-control association tests between responders and comparison subjects and between nonresponders and comparisons subjects were conducted using the COCAPHASE program from the UNPHASED suite of software, which generates p values based on a likelihood-ratio test (12) .
Receiver operating characteristic analyses were carried out using logistic regression implemented in SAS (SAS Institute Inc., Cary, N.C.) to examine the effects of markers on the treatment-response phenotype. All p values reported in the present study are two-tailed. Pairwise linkage disequilibrium (expressed as r 2 =value) was calculated using HAPLOVIEW (version 3.2) (13) .

Population Structure

STRUCTURE (14) was used to test for the presence of cryptic population structure within the “white” subset. The program was run for 20,000 burn-in steps and 20,000 replications. Compared with our earlier study, the number of markers was increased to 301 single nucleotide polymorphisms, with an r 2 ≤0.3 between the markers. To account for any structure, we used the posterior probabilities of membership in each putative cluster as covariates in the association analysis (15), which was performed with UNPHASED 3.06 (http://www.mrc-bsu.cam.ac.uk/personal/frank/software/unphased/).

Results

Comparisons Between Responders and Nonresponders

Table 1 shows the results for the two markers that passed the significance thresholds in both the discovery and replication groups. In addition to the previously identified marker, rs7997012 (in HTR2A), reproducible association was detected between rs1954787 and both treatment response and remission. This marker is located in the first intron of the GRIK4 gene (16) on chromosome 11. Several markers in both HTR2A and GRIK4 met or exceeded nominal significance for association with treatment response or remission in at least one of the split DNA samples (allele-wise, genotype-wise), but only one marker in each gene fulfilled the a priori criteria for significance in both split samples ( Figure 2 ).
Figure 2. Results of Markers in HTR2A and GRIK4 for the Traits “Treatment Response” and “Remission,” Respectively a
a Negative log 10 values of the respective p values are plotted on the y axis. Horizontal lines indicate the p=0.01 threshold applied to the discovery group (y=2) and the p=0.05 threshold for the replication group (y=1.3), respectively. Physical positions and gene structures are indicated on the x axis. Only one marker in each gene passes the prior p value thresholds for both the discovery and the replication groups, but several other markers in each gene show some evidence for association.
Assignment of patients into dichotomous “responder” and “nonresponder” groups may generate association results that are dependent on inclusion or exclusion of several individuals in a particular category. To confirm that the GRIK4 association finding was robust to categorical outcome definitions, we conducted a quantitative trait analysis, as performed previously (4) . The same rs1954787 allele was also significantly associated with relative change in Quick Inventory of Depressive Symptomatology-Clinician Rating score ( Table 2 ).

Strength of Association

The C-allele of rs1954787 was more frequent in those subjects who responded to treatment than in those subjects who did not respond to treatment. In the complete cohort, homozygous carriers of the C-allele had an 11% reduction in risk of nonresponse relative to TT homozygote carriers; in the “white” subgroup, homozygote carriers had a 10% reduction in risk. These values are somewhat lower than those observed previously for rs7997012 in HTR2A (18% and 16%, respectively) (4) . Homozygote carriers of the treatment-response-associated marker alleles of both GRIK4 and HTR2A were 23% less likely to experience nonresponse to treatment than participants carrying none of these marker alleles. Receiver operator characteristic analysis using both rs1954787and rs7997012 returned a c-statistic of 0.58 under an additive model, which expresses the probability of correctly identifying a responder from a random pair of participants.

Comparisons With Healthy Comparison Subjects

Association of a genetic marker with treatment response could reflect an allele that is enriched in frequency in treatment responders, reduced in frequency in nonresponders, or both. Thus, we compared the allele frequencies of HTR2A and GRIK4 markers in healthy comparison subjects with allele frequencies in 1) treatment responders and 2) nonresponders ( Figure 3 ). Since all included comparison subjects were self-described as “white, non-Hispanic,” only STAR*D participants self-described as “white, non-Hispanic” were included in this part of the study. A total of 675 definite responders and 260 definite nonresponders were identified, along with 634 healthy comparison subjects.
Figure 3. Results of Association Analysis in Responders Versus Comparison Subjects and Nonresponders Versus Comparison Subjects a
a Negative log 10 values of the respective p values are plotted on the y axis. Horizontal lines indicate the p≤0.05 and the p≤0.01 significance thresholds. Physical positions and gene structures are indicated on the x axis. Left: In HTR2A, three markers show significant association: rs7997012 shows strongest association of all markers in the analysis of responders relative to comparison subjects. Right: In the GRIK4 genomic interval covered in this study, 12 markers in the distal half of the gene show significant allele frequency differences between comparison subjects and nonresponders. The marker initially associated with treatment response in the two-split design, rs1954887, shows the strongest association. Note that none of the tested GRIK4 markers show significant association in the comparison between responders and comparison subjects.
Allele frequency comparisons of 16 markers in HTR2A revealed significant differences between responders and comparison subjects at two markers, the previously reported rs7997012 and rs594242 ( Figure 3 ). Another marker, rs6314, differed significantly in frequency between comparison subjects and nonresponders.
The same analysis applied to 53 markers in GRIK4 revealed 12 markers with significant differences. All were detected in the comparison of nonresponders with comparison subjects; no significant differences were detected between the comparison and responder groups ( Figure 3 ). The most significant difference between nonresponders and comparison subjects was detected at rs1954787, which was also identified in the comparison of responders and nonresponders described previously in this article. The T-allele of this single nucleotide polymorphism had a frequency of 43.1% in comparison subjects, 44.1% in responders, and 52.5% in nonresponders (p=0.00028). The 12 associated markers span an interval of ∼190 kb in the distal portion of the gene and are not in strong linkage disequilibrium with each other (see the figure in the data supplement, which accompanies the online version of this article).

Population Stratification

STRUCTURE was unable to rule out three putative clusters within the “white” subset of cases (likelihood-ratio statistic=35.0 for k=1 versus k=3, p<0.0001). However, the posterior probabilities were all close to 33% (range=32.1%–34.5%), suggesting that no true structure was present. To confirm this finding, we reanalyzed the data using the posterior probabilities as covariates. The results were essentially unchanged.

Subgroup Analyses in Drug-Tolerant and Female Subsets

We conducted exploratory analyses to investigate whether additional markers were associated with treatment response or remission in subsets of the total cohort based on tolerability (tolerant or probably tolerant individuals only), sex (male and female separately), and race (“whites,” “blacks,” and “others” separately).
Three new markers were identified that were significant by at least one test in both the discovery and replication groups ( Table 3 ). One marker, rs6416623, showed significant association with treatment response in the medication-tolerant and the female subsets. This marker resides in the gene GRIN2A, which encodes an N -methyl- d -aspartic-acid-type glutamate receptor subunit. Another marker, rs2178865, showed significant association with treatment response in female patients. This marker lies in the gene GRIK1, which encodes a kainic acid-type glutamate receptor. The same marker showed a tendency toward association with treatment response in the first wave of genotypes and ranked highly in both the discovery and replication groups (4) .

Discussion

The present study is an extension of our previous genetic analyses of the STAR*D cohort (4) . With the full set of genotypes now available from all 1,816 eligible individuals, we could conduct a more powerful analysis. Compared with the earlier study, the discovery group was increased by 341 subjects, and the replication group was increased by 179 subjects ( 
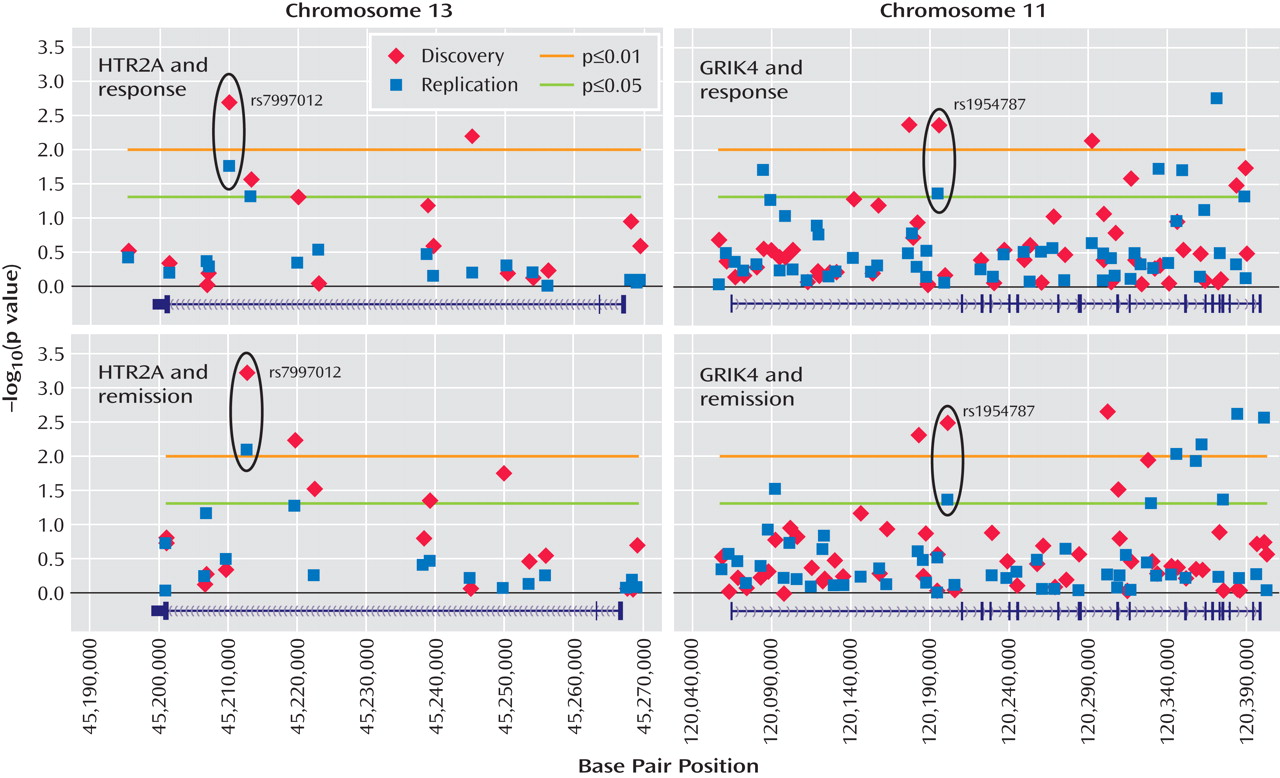
Figure 1 ). The present analyses identified an additional marker (rs1954787) associated with treatment response and remission. This marker is located in the 3′ end of the first intron of the GRIK4 gene. The marker does not alter the protein sequence but may have functional relevance in the regulation of gene expression. A search of the TRANSFAC database of transcription factor binding sites (http://www.gene-regulation.com/pub/databases.html#transfac) revealed a putative CCAAT enhancer element at the site of the polymorphism that is disrupted in the minor allele. Additionally, the marker rs1954787 maps to a bacterial artificial chromosome clone to which a chromosomal breakpoint has been mapped in a patient with schizophrenia (17) . This suggests that the single nucleotide polymorphisms may be in linkage disequilibrium with a consensus breakpoint sequence. The marker may be in linkage disequilibrium with a functional variant that remains to be identified.
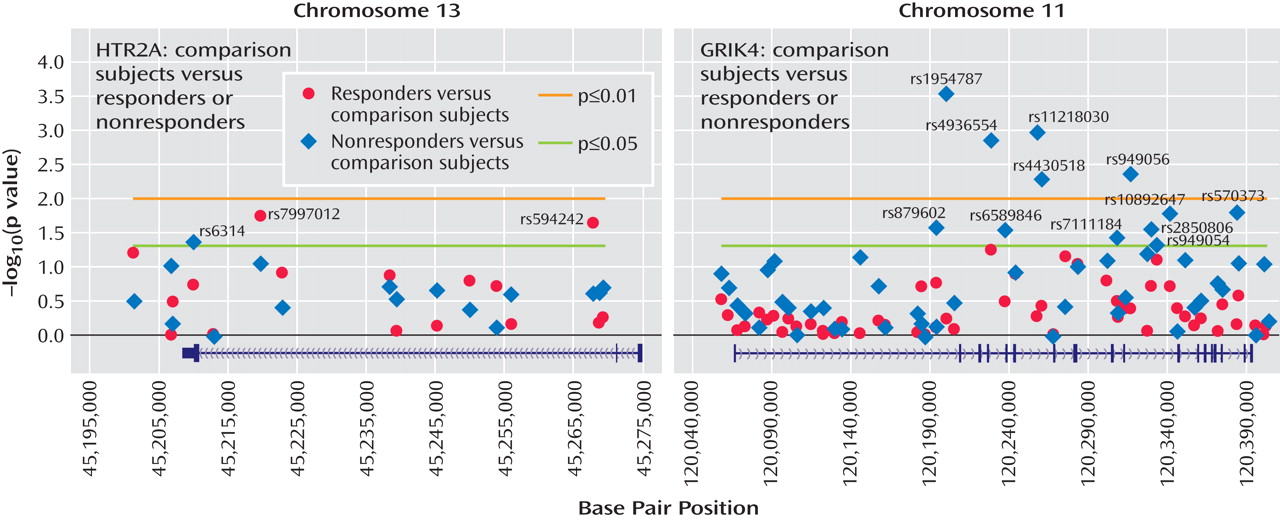
The healthy comparison group (N=634) allowed us to address, for the first time, questions concerning the nature of the observed associations with treatment response. For the HTR2A gene, the previously reported marker, rs7997012, primarily distinguished treatment responders from comparison subjects ( Figure 3 ). Two other significant associations were found in this gene: one marker differed from comparison subjects in the responders only, and one marker differed from comparison subjects in the nonresponders only ( Figure 3 ).
In the GRIK4 gene, we found that only nonresponders differed significantly from healthy comparison subjects in allele frequencies ( Figure 3 ). Significant differences were detected at 12 markers that were not strongly associated with each other. This suggests that several independent associations were detected and that common variation in the GRIK4 gene is associated with treatment-resistant depression. It is possible that comorbid conditions may contribute to this association. An initial search has identified anxious depression as one comorbid condition that is also associated with the GRIK4 gene (unpublished data by Laje et al. available from the authors). On the basis of a multiple regression analysis, however, it appears that both anxiety and treatment response showed significant independent associations with the GRIK4 genotype.
In the initial analysis of the STAR*D genetic cohort, intolerant and probably intolerant patients were excluded from the nonresponder group but not from the responder group 
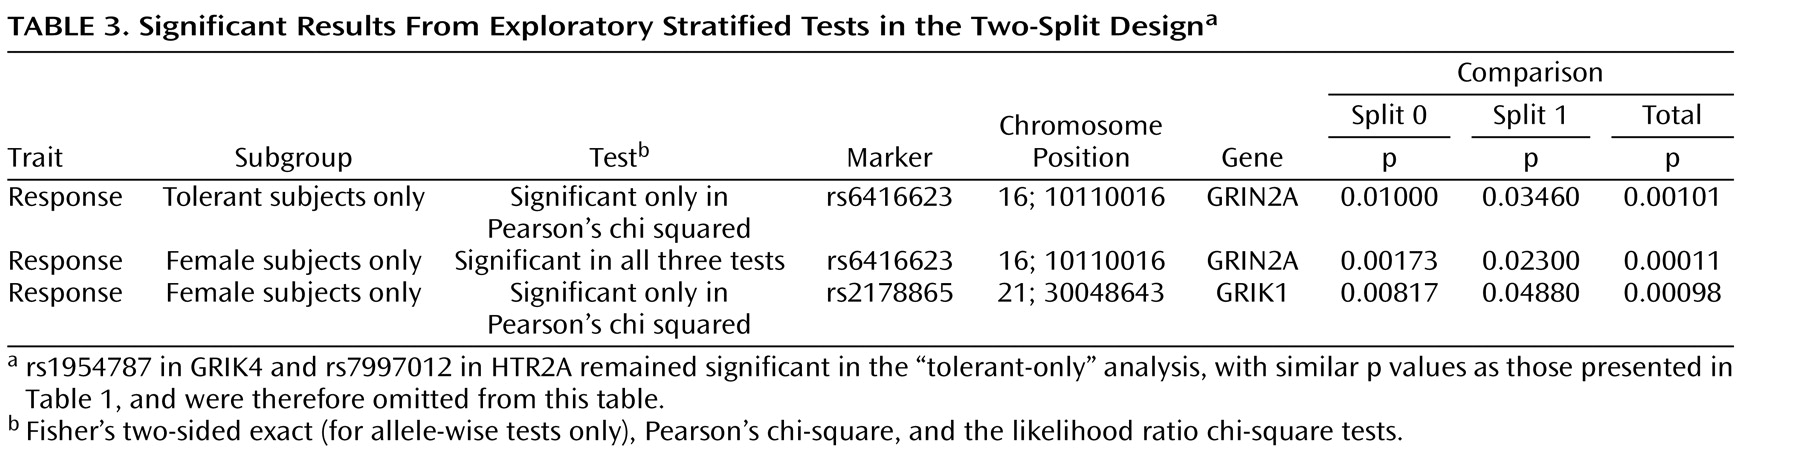
(4) . This may have introduced an asymmetry that could increase association findings driven by association with tolerance rather than treatment response. We therefore conducted a secondary analysis in which only tolerant and probably tolerant patients were included. Association of the rs7997012 marker remained significant, as previously reported. Association of the newly identified GRIK4 marker rs1954787 also remained significant. Thus, we conclude that these markers are related to treatment response rather than to intolerance.
In the present study, we also report exploratory analyses that suggest other genes that may be involved in treatment outcome, but these findings do not hold up to stringent correction for multiple testing, and thus should be considered preliminary. Association was observed with the rs6416623 marker in GRIN2A, a gene coding for an N -methyl- d -aspartate-type glutamate receptor. Association was also detected between treatment response and markers in GRIN2A and GRIK1, but only in female patients. These findings are consistent with the hypothesis that major depression may be related to some distinct genes in male versus female patients (18) . Treatment response may follow a similar division between sexes.
The most common hypothesis for major depressive disorder is still the biogenic amine hypothesis, which proposes that decreased synaptic availability of monoamine transmitters results in a condition that is reversed with antidepressant treatment. Excitatory amino acid neurotransmission, of which glutamate is the major example, may also play a role in major depressive disorder. Glutamate levels are increased in patients with major depressive disorder by proton magnetic resonance spectroscopy (19), suggesting enhanced glutamatergic transmission. Ionotropic glutamate receptors, such as the GRIK4-encoded kainic acid-type subunit, are responsible for fast-acting neurotransmission. Ionotropic glutamate receptors are present presynaptically and postsynaptically, where they modulate neurotransmitter release or excitatory neurotransmission. A role for ionotropic glutamate receptors in antidepressant action has been supported by studies in rodents in which chronic treatment with antidepressants, including citalopram, resulted in a region-specific reduction in binding activity of N -methyl- d -aspartate receptors (20, 21) and N -methyl- d -aspartate receptor subunits (22) . Chronic treatment of rats with SSRIs under a regimen similar to that used in humans has been reported to attenuate glutamatergic transmission in the cerebral cortex (23) . Finally, in a recent randomized placebo-controlled study, intravenous injection of ketamine, an N -methyl- d -aspartate receptor antagonist, led to rapid improvement of depressive symptoms in subjects with major depression (24) . In the hippocampus, another brain region thought to be affected in patients with major depressive disorder, presynaptic KA receptor subunits (GluR5-7, KA1, and KA2 [also referred to as GRIK1-5]) regulate glutamate release. Activation of presynaptic KA receptors results in long-lasting inhibition of neurotransmitter release (25) . This response may offset enhanced glutamatergic neurotransmission, constituting a feedback mechanism. Our finding that variation at a marker in the GRIK4 gene is associated with nonresponse to citalopram treatment suggests a role for KA receptor-dependent negative modulation.
To our knowledge, this is the first report of association between the GRIK4 gene and outcome of antidepressant treatment. A recent report indicated a possible association of GRIK4 haplotypes with schizophrenia and bipolar affective disorder (17), spanning the same genomic region as the 12 markers in the present study. This suggests functional variation in this part of the GRIK4 gene, which may be of relevance beyond treatment response in major depression. Interestingly, decreased expression of the highly related GRIK1 and/or GRIK5 genes has been observed in postmortem brains of patients with major depression (26) and bipolar disorder (26, 27) .
In the present study, the relatively modest effect size of the GRIK4 association probably precludes any immediate clinical relevance. The associated “C-allele” reduces the absolute risk of nonresponse by 11% in homozygote carriers, but the c-statistic of 0.58 observed in combination with the previously reported response-associated HTR2A marker is modest. In the present study, only the two markers that met replication criteria were included in the interaction analysis. It is likely that many more markers will have to be included before more meaningful clinical findings emerge.
The demonstration that a glutamate-receptor encoding gene mediates antidepressant treatment response may provide novel clues to the mechanism of action of SSRIs and insight into critical downstream signaling cascades.

Footnotes

Presented at the XIV World Congress for Psychiatric Genetics, Oct. 28 to Nov. 1, 2006, Cagliari, Italy. Received Nov. 4, 2006; revision received March 31, 2007; accepted April 9, 2007 (doi: 10.1176/appi.ajp.2007.06111790). From the Genetic Basis of Mood and Anxiety Disorders, Mood and Anxiety Program, NIMH, NIH, Department of Health and Human Services, Bethesda, Md.; Departments of Psychiatry, Neuroscience, and Pharmacology and Biological Chemistry, Mount Sinai School of Medicine, New York; Departments of Clinical Sciences and Psychiatry, University of Texas Southwestern Medical Center, Dallas; Genometrics Section, Inherited Disease Research Branch, National Human Genome Research Institute, NIH, Department of Health and Human Services, Baltimore; Section of Molecular Genetics, Laboratory of Neurogenetics, National Institute on Alcohol Abuse and Alcoholism, NIH, Department of Health and Human Services, Rockville, Md.; Department of Epidemiology, University of Pittsburgh, Pittsburgh; and the Laboratory of Molecular Pathophysiology, Mood and Anxiety Program, NIMH, NIH, Department of Health and Human Services, Bethesda, Md. Address correspondence and reprint requests to Dr. Paddock, Department of Neuroscience, Karolinska Institutet, Retzius Väg 8, B2-plan 4, 17177 Stockholm; [email protected] (e-mail).
Dr. Rush has served as an advisor, consultant, or speaker for or received research support from Advanced Neuromodulation Systems, Best Practice Project Management, Bristol-Myers Squibb, Cyberonics, Eli Lilly, Forest Pharmaceuticals, Gerson Lehman Group, GlaxoSmithKline, Healthcare Technology Systems, Jazz Pharmaceuticals, Merck, NIMH, Neuronetics, Ono Pharmaceutical, Organon USA, Personality Disorder Research Corp., Pfizer, the Robert Wood Johnson Foundation, the Stanley Medical Research Institute, the Urban Institute, and Wyeth-Ayerst; he also has equity holdings in Pfizer and receives royalty/patent income from Guilford Publications and Healthcare Technology Systems. Dr. Wisniewski has served as an advisor/consultant for Cyberonics, ImaRx Therapeutics, and Bristol-Myers Squibb. Drs. Paddock, Laje, Wilson, Lipsky, Charney, Manji, and McMahon and Ms. Sorant report no competing interests.
Funded by the Intramural Research Programs of NIMH, the National Institute on Alcohol Abuse and Alcoholism, the National Human Genome Research Institute, NIH, and the Swedish Research Council. Data and sample collection were funded with federal funds from NIMH, NIH, under contract N01MH90003 to the University of Texas Southwestern Medical Center at Dallas (Principal Investigator, A. John Rush).
The content of this article does not necessarily reflect the views or policies of the Department of Health and Human Services, nor does mention of trade names, commercial products, or organizations imply endorsement by the U.S. Government.
The authors thank the STAR*D research team for acquisition of clinical data and DNA samples and Forest Laboratories for providing citalopram at no cost for the STAR*D study. The authors also thank Nirmala Akula and Jo Steele for technical assistance, the Rutgers University Cell and DNA Repository for extracting DNA and providing samples to our laboratories, and Luana Galver at Illumina, Inc. for supervising the genotyping. The authors express special thanks to the participants of the STAR*D trial.
Comparison subjects from the NIMH Schizophrenia Genetics Initiative (NIMH-GI), data, and biomaterials were collected by the “Molecular Genetics of Schizophrenia II” (MGS-2) collaboration. The investigators and co-investigators are: Pablo V. Gejman, M.D. (Collaboration Coordinator; PI), Alan R. Sanders, M.D. (ENH/Northwestern University, Evanston, Ill., MH059571); Farooq Amin, M.D. (PI) (Emory University School of Medicine, Atlanta, MH59587); Nancy Buccola, A.P.R.N., B.C., M.S.N. (PI) (Louisiana State University Health Sciences Center; New Orleans, MH067257); William Byerley, M.D. (PI) (University of California-Irvine, Irvine, Calif., MH60870); C. Robert Cloninger, M.D. (PI) (Washington University, St. Louis, U01, MH060879); Raymond Crowe, M.D. (PI), Donald Black, M.D. (University of Iowa, Iowa City, Iowa, MH59566); Robert Freedman, M.D. (PI) (University of Colorado, Denver, MH059565); Douglas Levinson, M.D. (PI) (University of Pennsylvania, Philadelphia, MH061675); Bryan Mowry, M.D. (PI) (University of Queensland, Queensland, Australia, MH059588); Jeremy Silverman, Ph.D. (PI) (Mt. Sinai School of Medicine, New York, MH59586).

References

1.
Rush AJ, Fava M, Wisniewski SR, Lavori PW, Trivedi MH, Sackeim HA, Thase ME, Nierenberg AA, Quitkin FM, Kashner TM, Kupfer DJ, Rosenbaum JF, Alpert J, Stewart JW, McGrath PJ, Biggs MM, Shores-Wilson K, Lebowitz BD, Ritz L, Niederehe G: Sequenced Treatment Alternatives to Relieve Depression (STAR*D): rationale and design. Control Clin Trials 2004; 25:119–142
2.
Trivedi MH, Rush AJ, Wisniewski SR, Nierenberg AA, Warden D, Ritz L, Norquist G, Howland RH, Lebowitz B, McGrath PJ, Shores-Wilson K, Biggs MM, Balasubramani GK, Fava M: Evaluation of outcomes with citalopram for depression using measurement-based care in STAR*D: implications for clinical practice. Am J Psychiatry 2006; 163:28–40
3.
Trivedi MH, Fava M, Wisniewski SR, Thase ME, Quitkin F, Warden D, Ritz L, Nierenberg AA, Lebowitz BD, Biggs MM, Luther JF, Shores-Wilson K, Rush AJ: Medication augmentation after the failure of SSRIs for depression. N Engl J Med 2006; 354:1243–1252
4.
McMahon FJ, Buervenich S, Charney D, Lipsky R, Rush AJ, Wilson AF, Sorant AJ, Papanicolaou GJ, Laje G, Fava M, Trivedi MH, Wisniewski SR, Manji H: Variation in the gene encoding the serotonin 2A receptor is associated with outcome of antidepressant treatment. Am J Hum Genet 2006; 78:804–814
5.
Rush AJ, Trivedi MH, Ibrahim HM, Carmody TJ, Arnow B, Klein DN, Markowitz JC, Ninan PT, Kornstein S, Manber R, Thase ME, Kocsis JH, Keller MB: The 16-item Quick Inventory of Depressive Symptomatology (QIDS), Clinician Rating (QIDS-C), and Self-Report (QIDS-SR): a psychometric evaluation in patients with chronic major depression. Biol Psychiatry 2003; 54:573–583
6.
Trivedi MH, Rush AJ, Ibrahim HM, Carmody TJ, Biggs MM, Suppes T, Crismon ML, Shores-Wilson K, Toprac MG, Dennehy EB, Witte B, Kashner TM: The Inventory of Depressive Symptomatology, Clinician Rating (IDS-C) and Self-Report (IDS-SR), and the Quick Inventory of Depressive Symptomatology, Clinician Rating (QIDS-C) and Self-Report (QIDS-SR) in public sector patients with mood disorders: a psychometric evaluation. Psychol Med 2004; 34:73–82
7.
The International HapMap Project. Nature 2003; 426:789–796
8.
Carlson CS, Eberle MA, Rieder MJ, Yi Q, Kruglyak L, Nickerson DA: Selecting a maximally informative set of single-nucleotide polymorphisms for association analyses using linkage disequilibrium. Am J Hum Genet 2004; 74:106–120
9.
Binder EB, Salyakina D, Lichtner P, Wochnik GM, Ising M, Putz B, Papiol S, Seaman S, Lucae S, Kohli MA, Nickel T, Kunzel HE, Fuchs B, Majer M, Pfennig A, Kern N, Brunner J, Modell S, Baghai T, Deiml T, Zill P, Bondy B, Rupprecht R, Messer T, Kohnlein O, Dabitz H, Bruckl T, Muller N, Pfister H, Lieb R, Mueller JC, Lohmussaar E, Strom TM, Bettecken T, Meitinger T, Uhr M, Rein T, Holsboer F, Muller-Myhsok B: Polymorphisms in FKBP5 are associated with increased recurrence of depressive episodes and rapid response to antidepressant treatment. Nat Genet 2004; 36:1319–1325
10.
Hahn MK, Mazei-Robison MS, Blakely RD: Single nucleotide polymorphisms in the human norepinephrine transporter gene affect expression, trafficking, antidepressant interaction, and protein kinase C regulation. Mol Pharmacol 2005; 68:457–466
11.
Oliphant A, Barker DL, Stuelpnagel JR, Chee MS: BeadArray technology: enabling an accurate, cost-effective approach to high-throughput genotyping. Biotechniques 2002; June suppl: 56–58, 60–61
12.
Dudbridge F: Pedigree disequilibrium tests for multilocus haplotypes. Genet Epidemiol 2003; 25:115–121
13.
Barrett JC, Fry B, Maller J, Daly MJ: Haploview: analysis and visualization of LD and haplotype maps. Bioinformatics 2005; 21:263–265
14.
Pritchard JK, Stephens M, Rosenberg NA, Donnelly P: Association mapping in structured populations. Am J Hum Genet 2000; 67:170–181
15.
Pritchard JK, Stephens M, Donnelly P: Inference of population structure using multilocus genotype data. Genetics 2000; 155:945–959
16.
Szpirer C, Molne M, Antonacci R, Jenkins NA, Finelli P, Szpirer J, Riviere M, Rocchi M, Gilbert DJ, Copeland NG: The genes encoding the glutamate receptor subunits KA1 and KA2 (GRIK4 and GRIK5) are located on separate chromosomes in human, mouse, and rat. Proc Natl Acad Sci USA 1994; 91:11849–11853
17.
Pickard BS, Malloy MP, Christoforou A, Thomson PA, Evans KL, Morris SW, Hampson M, Porteous DJ, Blackwood DH, Muir WJ: Cytogenetic and genetic evidence supports a role for the kainate-type glutamate receptor gene, GRIK4, in schizophrenia and bipolar disorder. Mol Psychiatry 2006; 11:847–857
18.
Kendler KS, Gatz M, Gardner CO, Pedersen NL: A Swedish National Twin Study of lifetime major depression. Am J Psychiatry 2006; 163:109–114
19.
Sanacora G, Mason GF, Rothman DL, Behar KL, Hyder F, Petroff OA, Berman RM, Charney DS, Krystal JH: Reduced cortical gamma-aminobutyric acid levels in depressed patients determined by proton magnetic resonance spectroscopy. Arch Gen Psychiatry 1999; 56:1043–1047
20.
Nowak G, Li Y, Paul IA: Adaptation of cortical but not hippocampal NMDA receptors after chronic citalopram treatment. Eur J Pharmacol 1996; 295:75–85
21.
Skolnick P, Layer RT, Popik P, Nowak G, Paul IA, Trullas R: Adaptation of N-methyl-D-aspartate (NMDA) receptors following antidepressant treatment: implications for the pharmacotherapy of depression. Pharmacopsychiatry 1996; 29:23–26
22.
Boyer PA, Skolnick P, Fossom LH: Chronic administration of imipramine and citalopram alters the expression of NMDA receptor subunit mRNAS in mouse brain. A quantitative in situ hybridization study. J Mol Neurosci 1998; 10:219–233
23.
Bobula B, Tokarski K, Hess G: Repeated administration of antidepressants decreases field potentials in rat frontal cortex. Neuroscience 2003; 120:765–769
24.
Zarate CA, Jr, Singh JB, Carlson PJ, Brutsche NE, Ameli R, Luckenbaugh DA, Charney DS, Manji HK: A randomized trial of an N-methyl-D-aspartate antagonist in treatment-resistant major depression. Arch Gen Psychiatry 2006; 63:856–864
25.
Negrete-Diaz JV, Sihra TS, Delgado-Garcia JM, Rodriguez-Moreno A: Kainate receptor-mediated inhibition of glutamate release involves protein kinase A in the mouse hippocampus. J Neurophysiol 2006; 96:1829–1837
26.
Choudary PV, Molnar M, Evans SJ, Tomita H, Li JZ, Vawter MP, Myers RM, Bunney WE Jr, Akil H, Watson SJ, Jones EG: Altered cortical glutamatergic and GABAergic signal transmission with glial involvement in depression. Proc Natl Acad Sci USA 2005; 102:15653–15658
27.
Iwamoto K, Kakiuchi C, Bundo M, Ikeda K, Kato T: Molecular characterization of bipolar disorder by comparing gene expression profiles of postmortem brains of major mental disorders. Mol Psychiatry 2004; 9:406–416

Information & Authors

Information

Published In

Go to American Journal of Psychiatry
American Journal of Psychiatry
Pages: 1181 - 1188
PubMed: 17671280

History

Published online: 1 August 2007
Published in print: August, 2007

Authors

Affiliations

Alexander F. Wilson, Ph.D.
Alexa J.M. Sorant, M.A.
Stephen R. Wisniewski, Ph.D.
Francis J. McMahon, M.D.

Metrics & Citations

Metrics

Citations

Export Citations

If you have the appropriate software installed, you can download article citation data to the citation manager of your choice. Simply select your manager software from the list below and click Download.

For more information or tips please see 'Downloading to a citation manager' in the Help menu.

Format
Citation style
Style
Copy to clipboard

There are no citations for this item

View Options

View options

PDF/ePub

View PDF/ePub

Get Access

Login options

Already a subscriber? Access your subscription through your login credentials or your institution for full access to this article.

Personal login Institutional Login Open Athens login
Purchase Options

Purchase this article to access the full text.

PPV Articles - American Journal of Psychiatry

PPV Articles - American Journal of Psychiatry

Not a subscriber?

Subscribe Now / Learn More

PsychiatryOnline subscription options offer access to the DSM-5-TR® library, books, journals, CME, and patient resources. This all-in-one virtual library provides psychiatrists and mental health professionals with key resources for diagnosis, treatment, research, and professional development.

Need more help? PsychiatryOnline Customer Service may be reached by emailing [email protected] or by calling 800-368-5777 (in the U.S.) or 703-907-7322 (outside the U.S.).

Media

Figures

Other

Tables

Share

Share

Share article link

Share