Abstract

Objective:

Delirium is a common and potentially life-threatening clinical syndrome. The authors investigated resting-state functional connectivity in patients with delirium to elucidate possible neural mechanisms underlying this disorder.

Method:

Twenty-two patients underwent initial functional MRI at rest during an episode of delirium. Of these patients, 14 completed follow-up scans after the episode resolved. Twenty-two comparison subjects without delirium also underwent scanning. The authors assessed cortical functional connectivity using the seed region of the posterior cingulate cortex and functional connectivity strengths between a priori subcortical regions related to acetylcholine and dopamine on data from 20 initial and 13 follow-up scans.

Results:

Dorsolateral prefrontal cortex activity and posterior cingulate cortex activity were inversely correlated in comparison subjects but strongly correlated in patients during an episode of delirium as indicated by increased functional connectivity between the two regions. Although precuneus activity was positively correlated with posterior cingulate cortex activity in comparison subjects, the correlation was further increased in patients during an episode of delirium, and the increment was associated with less severity and shorter duration of delirium. Functional connectivity strengths of the intralaminar thalamic and caudate nuclei with other subcortical regions were reduced during an episode of delirium but recovered after resolution of the episode.

Conclusions:

These findings suggest that the disruption in reciprocity of the dorsolateral prefrontal cortex with the posterior cingulate cortex and reversible reduction of functional connectivity of subcortical regions may underlie the pathophysiology of delirium. In addition, enhanced integration in the posteromedial cortices may account for facilitating the rapid improvement of delirium.
Delirium is described as an acute decline in consciousness and cognition associated with impaired attention. Although delirium is a common and potentially life-threatening clinical syndrome (1), little is known about the specific mechanisms underlying the disorder. Previous neuroimaging studies have suggested that general brain abnormalities, such as cortical atrophy, ventricular enlargement, and increased white matter lesions, may predispose individuals to developing delirium (2). Resting-state functional MRI (fMRI) is a promising technique for reflecting spontaneous neuronal activity and connectivity (3). This approach has received more attention among researchers examining cognitively compromised patients (4) and disorders of consciousness (5), as it requires no stimulus-response sequence and is highly replicable (6). Thus, resting-state fMRI may be useful in investigating neural networks in delirium.
When applying this method in studying delirium, two specific neural systems should be taken into account. The first is the default-mode network, which is a group of brain regions showing greater levels of activity at rest than during attention-based tasks. These regions include the posteromedial/anteromedial cortices and temporoparietal junctions (3, 7). Among patients in vegetative or comatose states, connectivity of the default-mode network has been shown to be decreased in proportion to the degree of consciousness impairment (5). Abnormal default-mode network activity has been also observed in patients with Alzheimer's disease (8). In particular, decreased posteromedial default-mode network activity has been associated with cognitive impairment (9). The posteromedial cortex, including the posterior cingulate cortex, is a central node of the default-mode network (1012), and it is a frequent focus of examination in studies of cognition, attention, and consciousness (13). Given that impaired consciousness and cognition are the primary symptoms of delirium, the posterior cingulate cortex and default-mode network are likely sources of core dysfunctional activity in patients with delirium.
The second system that should be taken into account includes the subcortical regional connections, which are associated with acetylcholine and dopamine. One leading hypothesis regarding the pathogenesis of delirium points to neurochemical abnormalities (14). The role of cholinergic deficiencies has received the greatest amount of attention, as this neurotransmitter system is involved in sleep, attention, arousal, and memory (15, 16). Dopamine excess may also be involved, as it has a regulatory influence over the release of acetylcholine (16, 17). Accordingly, the strength of resting-state functional connectivity between regions producing or utilizing acetylcholine and dopamine may be an appropriate target for elucidation of the pathophysiology of delirium. Based on the hypothesis proposed by Gaudreau and Gagnon (17), which emphasized the role of the thalamus as well as interactions between neurons related to acetylcholine and dopamine in delirium, multiple subcortical regions (including the intralaminar thalamic nuclei, the mesencephalic tegmentum, the nucleus basalis of Meynert, the ventral tegmental area, the caudate, and the putamen) are appropriate regions of interest to target.
This study was designed to serially investigate resting-state brain networks during and after an episode of delirium using fMRI. We hypothesized that cortical default-mode network connectivity and subcortical neurotransmitter-related functional connections would be disrupted during an episode of delirium and normalized after the resolution. In order to verify these hypotheses, we examined default-mode network connectivity using the posterior cingulate cortex as a seed region, and we measured functional connectivity strengths among subcortical regions associated with the acetylcholine and dopamine pathways.

Method

Participants

Twenty-two patients with delirium who were able to cooperate with MRI scanning procedures were recruited through the inpatient unit of Gangnam Severance Hospital at Yonsei University in Seoul, Korea. Patients were referred to the psychiatric consultation-liaison section and had comorbid diagnoses of various medical diseases (see Table S1 in the data supplement that accompanies the online edition of this article). Based on clinical interviews with trained psychiatrists, a diagnosis of delirium was made according to DSM-IV criteria. Twenty-two age- and sex-matched comparison subjects, who had various medical diseases without delirium, were recruited from the Databank for Brain Imaging in the Department of Radiology at Gangnam Severance Hospital. The data bank included functional and structural brain MR images of inpatients or outpatients who had various medical or neurological conditions, who consented to provide the data, and who were scanned with the same MR sequences as the patients with delirium. Exclusion criteria for patients and comparison subjects included a history of cognitive decline such as dementia, a history of seizure or traumatic head injury, and previously identified focal lesions greater than 3 cm if imaging was available. If brain lesions greater than 3 cm or focal lesions surrounding the a priori regions developed during the study, the data were excluded from the subsequent analysis. The existence of leukoaraiosis was not part of the exclusion criteria, but its extent was evaluated by Scheltens method (18) for the group comparison. We obtained written informed consent from the participants or their surrogates after giving them a complete description of the study. This study was approved by the institutional review board at Gangnam Severance Hospital.

Assessments of the Severity of Delirium and MRI Scanning

The presence and severity of delirium were assessed using the Memorial Delirium Assessment Scale (19), which includes 10 items for assessment of disturbances in consciousness and cognitive functioning (scores range from 0 to 30), and the Delirium Rating Scale–Revised-98 (20), which includes three diagnostic items and 13 severity items (scores range from 0 to 46). The motor subtypes, such as hyperactive, hypoactive, and mixed, were classified based on the ninth item on the Memorial Delirium Assessment Scale (“decreased or increased psychomotor activity”). Patients' clinical status was assessed every other day. An initial MRI scan was obtained from patients during an episode of delirium, and a follow-up scan was obtained after resolution, which was defined as a score <10 on the Memorial Delirium Assessment Scale or a score <15 on the Delirium Rating Scale–Revised-98.

Image Acquisition and Preprocessing

Functional images were obtained over 5 minutes using gradient-echo echo-planar imaging sequences in a Signa EXCITE 3-T MR system (GE, Milwaukee) (matrix=64×64, TE=17.6 msec, TR=2,500 msec, field of view=240 mm, slice thickness=3 mm, flip angle=90°, number of slices=50). All participants were instructed to rest with their eyes closed during the scan. High-resolution anatomical images were obtained using a spoiled gradient-echo sequence (matrix=512×512, TE=1.7 msec, TR=7.0 msec, field of view=210 mm, slice thickness=1.2 mm, flip angle=20°, number of slices=240) to serve as an anatomical underlay.
Image processing was performed using the Analysis of Functional NeuroImages (AFNI) software package (21). The first 15 time points in each series were discarded in order to eliminate signal decay. Slice timing and motion corrections were performed for all slices within a volume. The fMRI data were normalized through bilinear interpolation at a 2×2×2 mm3 resolution using the parameters from spatial normalization of the T1-weighted images. Spatial smoothing was performed using a Gaussian filter with a 6-mm full-width at half-maximum. The data were temporally band-pass filtered (0.01–0.08 Hz) to reduce low frequency fluctuations in the blood-oxygen-level-dependent signal. The nonspecific effects by a combination of physiological processes were regressed out using nuisance variables such as the global signal, ventricles, and white matter. The motion component, consisting of six time series representing head motion, was also regressed out.

Definition of the a Priori Regions

Regions of interest were identified on the MRI template provided by AFNI. Instead of delineating the boundaries of the whole structure, the posterior cingulate cortex was defined as a 6-mm radius sphere (centered at x, y, z coordinates ±5, –53, 23), and the caudate (centered at coordinates ±15, 13, 7) and putamen (centered at coordinates ±23, 6, 1) were defined as a 3-mm radius sphere. The intralaminar thalamic nuclei (centered at coordinates ±13, –20, 10), mesencephalic tegmentum (centered at coordinates ±5, –26, –8), nucleus basalis (centered at coordinates ±12, –2, –6), and ventral tegmental area (centered at coordinates 0, –19, –8) were defined as 2-mm radius spheres according to the parameters described in previous functional studies (2224). The locations of the spheres for each subject were manually modified to be placed in the boundary of the predefined regions (25). For accurate localization, the normalized structural images of comparison subjects were used as a reference to manually outline these areas.

Functional Connectivity and Data Analysis

The cortical networks were assessed using a seed-based correlation approach. The seed reference was the average of the time-series data over the spheres in the left and right posterior cingulate cortex, and voxel-wise correlations were counted between the time series for the posterior cingulate cortex and the whole brain. Functional connectivity strengths were generated by converting the correlation coefficients to z values with Fisher's r-to-z transformation. Group-level significance for the coefficients in each group was determined using one-sample t tests with family-wise error correction across the whole brain and small volumes (26). Then independent-sample t tests for between-group differences were performed with a significance threshold of p<0.05 after family-wise error correction across the entire brain, and a paired-sample t test for within-group change was conducted with a significance threshold of p<0.05 after family-wise error correction using a small volume. The small volumes in the one-sample and paired-sample t tests were defined in the comparison between the during-episode patients and the comparison group. The correlation analysis was conducted to examine the associations between functional connectivity strengths in the clusters from the between- and within-group differences and clinical variables such as the severity and duration of delirium. Additionally, given that previous studies found associations between delirium and white matter abnormalities (2, 27), we examined the relationship between the extent of leukoaraiosis and functional connectivity strengths in the clusters from the between-group differences.
For subcortical functional connectivity strengths, a regional mean time series was estimated over all voxels in the left and right sides of each region. Pearson's correlation coefficients were calculated for each pair of the subcortical regions as described in previous studies (6, 12, 28). After determining group-level significance using one-sample t tests on the z-transformed coefficients in each group, independent-sample and paired-sample t tests with a significance threshold of p<0.05 were conducted for each pair of the subcortical regions. In addition, to explore the link in the corticostriatal circuit, correlation analyses were conducted between functional connectivity of the posterior cingulate cortex with the brain regions exhibiting group differences and abnormal subcortical connectivity strengths with the caudate at p<0.05 in each group.

Results

Sample Characteristics

Twenty-two patients with delirium underwent an initial scan, but data from two patients were excluded, one because of severe movement artifacts and the other because of multiple embolic infarctions in the a priori regions. As shown in Table 1, there were no statistical differences in age, sex, the number of patients with brain focal lesions, or the extent of leukoaraiosis between the initial 20 patients and the comparison subjects. The patient group included all motor subtypes, and the causes of delirium were assumed to be a variety of medical factors.
TABLE 1. Demographic and Clinical Characteristics of Participants in a Study of Neural Network Functional Connectivity in Delirium
 Delirium Patients
CharacteristicDuring Episode (N=20)After Resolution (N=13)Comparison Subjects (N=22)
 MeanSDMeanSDMeanSD
Age (years)73.69.475.57.472.26.8
Extent of leukoaraiosis 
  Periventricular hyperintensity (range=0–6)1.61.31.71.31.81.2
  Deep white matter hyperintensity (range=0–24)6.65.76.26.66.75.1
Memorial Delirium Assessment Scale scorea12.84.05.02.6  
Delirium Rating Scale–Revised-98 scorea18.05.19.23.1  
Duration of delirium8.64.1    
 N%N%N%
Male gender1260.01076.91359.1
Patients with brain focal lesions945.0538.5836.4
Motor subtypeb 
  Mixed630    
  Hypoactive840    
  Hyperactive525    
  None15    
a
Significant difference between groups, p<0.05.
b
Motor subtypes of delirium were made based on item 9 of the Memorial Delirium Assessment Scale (“decreased or increased psychomotor activity”).
Six of the 20 patients could not undergo a follow-up scan because of death (N=2), early discharge (N=2), persistent delirium (N=1), or uncooperativeness during scanning (N=1). Data from one patient were excluded from the follow-up analysis after the development of a new ischemic lesion. As summarized in Table 1, the 13 remaining follow-up patients had significantly improved scores on the Memorial Delirium Assessment Scale and the Delirium Rating Scale–Revised-98. The mean interval between the initial and follow-up scans was 5.8 days (SD=2.4). On the initial scanning day, patients with delirium either were free of antipsychotics (N=6) or had been treated with a single dose of an antipsychotic (N=7) the night before for managing behavioral problems. During the interval, they were treated with a mean daily dose of 472.9 mg (SD=382.0) of chlorpromazine equivalents of risperidone (N=4), quetiapine (N=3), olanzapine (N=2), haloperidol (N=2), or quetiapine and haloperidol (N=2). On the follow-up scanning day, four patients were free of antipsychotics, and the remaining patients continued to be treated with a daily mean dose of 89.7 mg (SD=66.5) of chlorpromazine equivalents. There were no statistical differences in age, sex, the number of patients with brain focal lesions, or the extent of leukoaraiosis between the 13 follow-up delirium patients and the comparison subjects.

Functional Connectivity Associated With the Posterior Cingulate Cortex

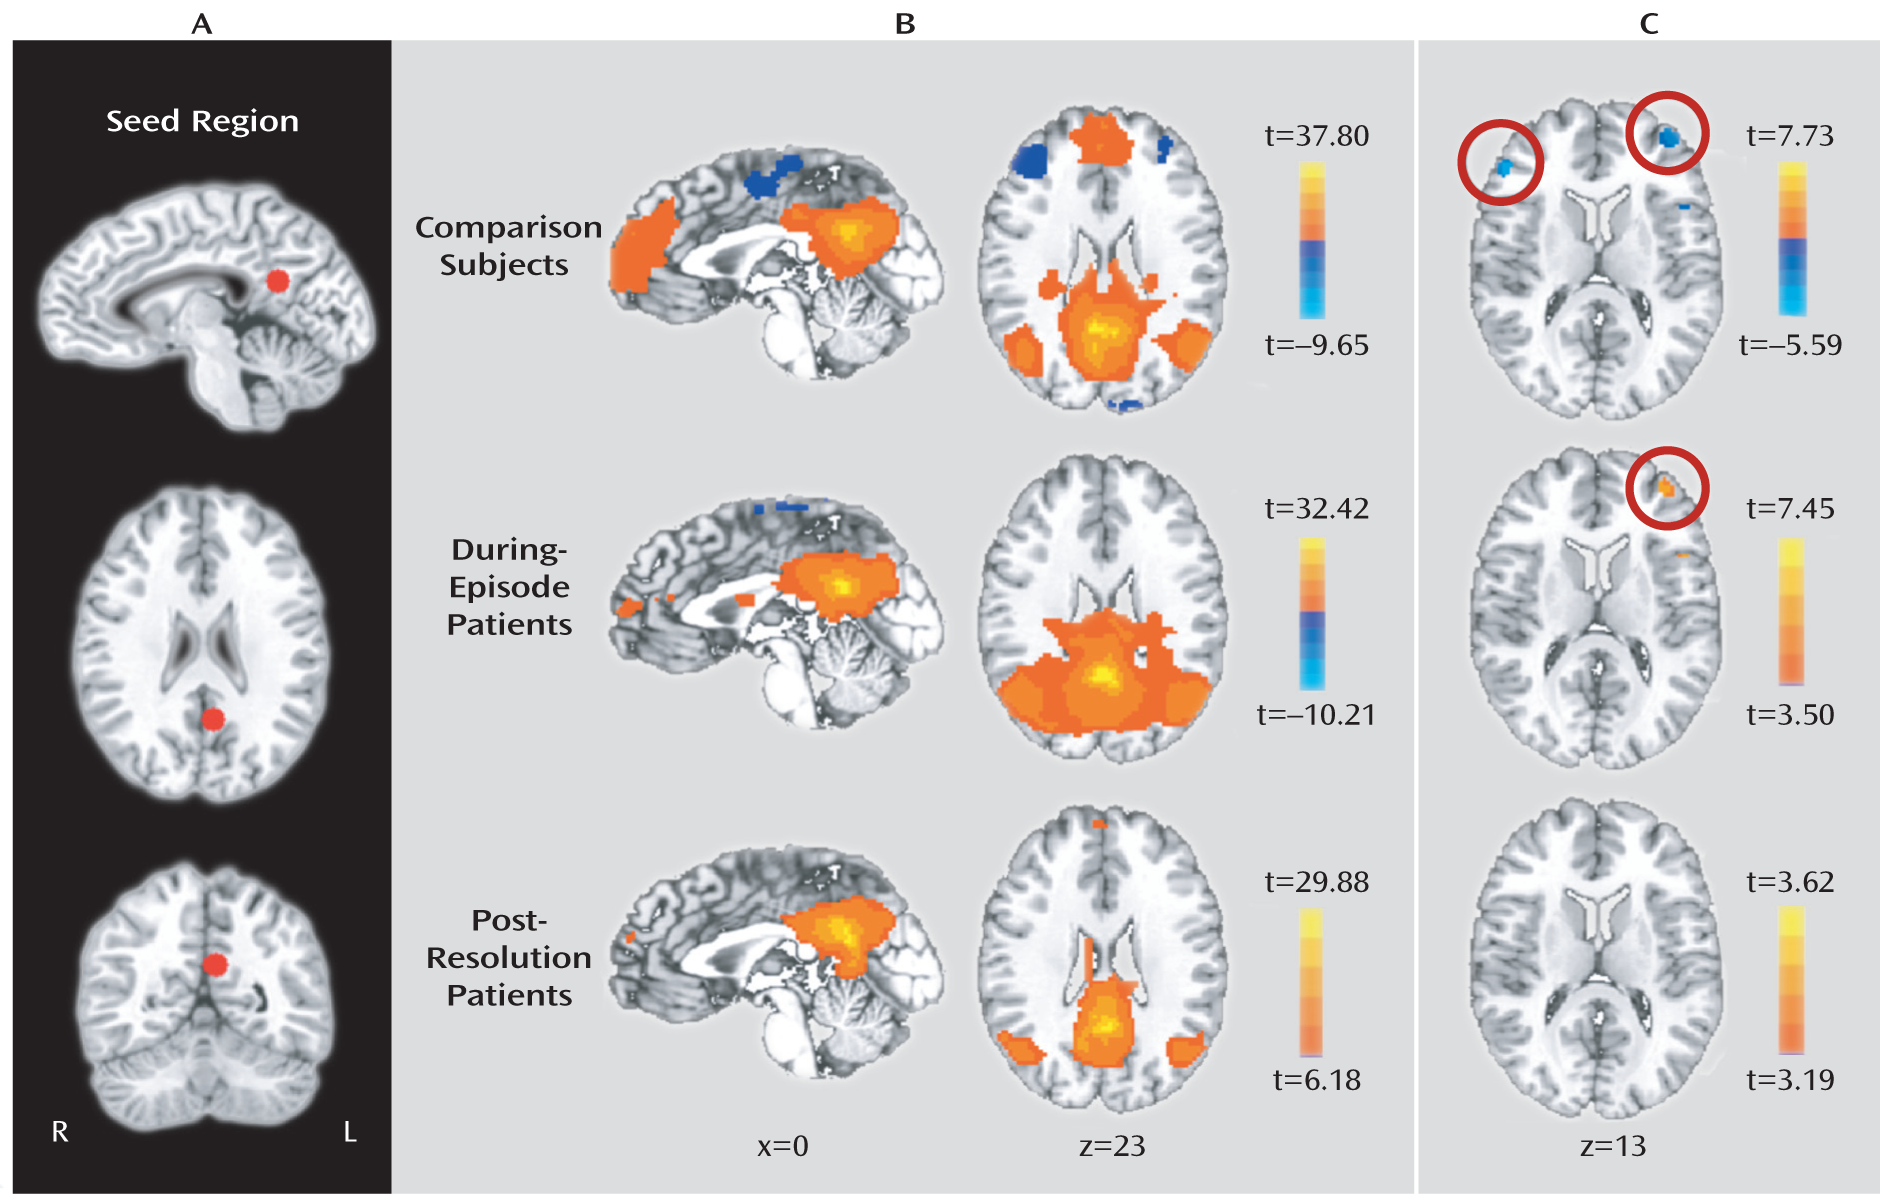
Functional connectivity with the posterior cingulate cortex in each group is shown in Figure 1B, which shows dynamic changes of the default-mode network nodes through the course of delirium (see Table S2 in the online data supplement for complete fMRI results). As shown in Figure 1C (and Table S3 in the online data supplement), comparison subjects showed a negative correlation with the dorsolateral prefrontal cortex bilaterally, whereas during-episode patients showed a positive correlation with the left dorsolateral prefrontal cortex. However, postresolution patients showed no correlation with any dorsolateral prefrontal cortex region.
FIGURE 1. Correlation Maps for Brain Regions Showing Voxel-Wise Significance of Correlations With the Posterior Cingulate Cortex in Each Groupa
a In panel A, a left seed region in the posterior cingulate cortex is displayed as an example. Panel B shows results from one-sample t tests, which were conducted with the threshold of significance at p<0.05 after whole-brain cluster-level correction. Activity of the seed region in comparison subjects showed positive correlations (red) with the posteromedial/anteromedial cortices and the temporoparietal junctions and a negative correlation (blue) with the frontolateral cortices. These correlations disappeared in the anteromedial and frontolateral cortices and were enhanced in the posteromedial cortices during an episode of delirium. In panel C, the significant voxels resulted from one-sample t tests with the significance threshold of p<0.05 after small volume-level correction in each group. Comparison subjects showed a negative correlation (blue) between the left and right dorsolateral prefrontal cortices and seed regions, whereas during-episode patients showed a positive correlation (red) between the left dorsolateral prefrontal cortex and seed region.
Table 2 presents the group comparison of functional connectivity with the posterior cingulate cortex. Relative to comparison subjects, during-episode patients showed significantly greater correlations in the left and right dorsolateral prefrontal cortex, the left inferior frontal gyrus, and the left and right precuneus, but a significantly lower correlation in the cerebellum. During-episode patients also showed greater correlations in the right dorsolateral prefrontal cortex relative to those of postresolution patients. Correlation analyses between the extent of leukoaraiosis and functional connectivity strengths with the posterior cingulate cortex in these regions revealed no significant results in all groups. Meanwhile, postresolution patients had no significantly different correlations with the posterior cingulate cortex relative to those of comparison subjects.
TABLE 2. Brain Regions Exhibiting Significantly Different Correlations With the Posterior Cingulate Cortex in Between-Group and Pairwise Analyses
Talairach Coordinates
Brain RegionBrodmann's AreaxyzVolume (mm3)Tmax
During-episode group > comparison groupa 
  Left dorsolateral prefrontal cortex10/46–3749145925.035
  Right dorsolateral prefrontal cortex464933104725.045
  Left inferior frontal gyrus9–433208484.969
  Left precuneus7/31–23–69289044.554
  Right precuneus7/3125–73246804.447
Comparison group > during-episode groupa 
  Left cerebellum, crus II in lobule VIIa –43–67–40536–5.333
Postresolution group > comparison groupa 
  No voxels survive threshold 
Comparison group > postresolution groupa 
  No voxels survive threshold 
During-episode group > postresolution groupb 
  Right dorsolateral prefrontal cortex45/46513183364.031
Postresolution group > during-episode groupb 
  No voxels survive threshold 
a
p<0.05 after family-wise error correction for whole-brain volume.
b
p<0.05 after family-wise error correction for small volume.

Correlations Between Functional Connectivity Strengths With the Posterior Cingulate Cortex and Clinical Variables

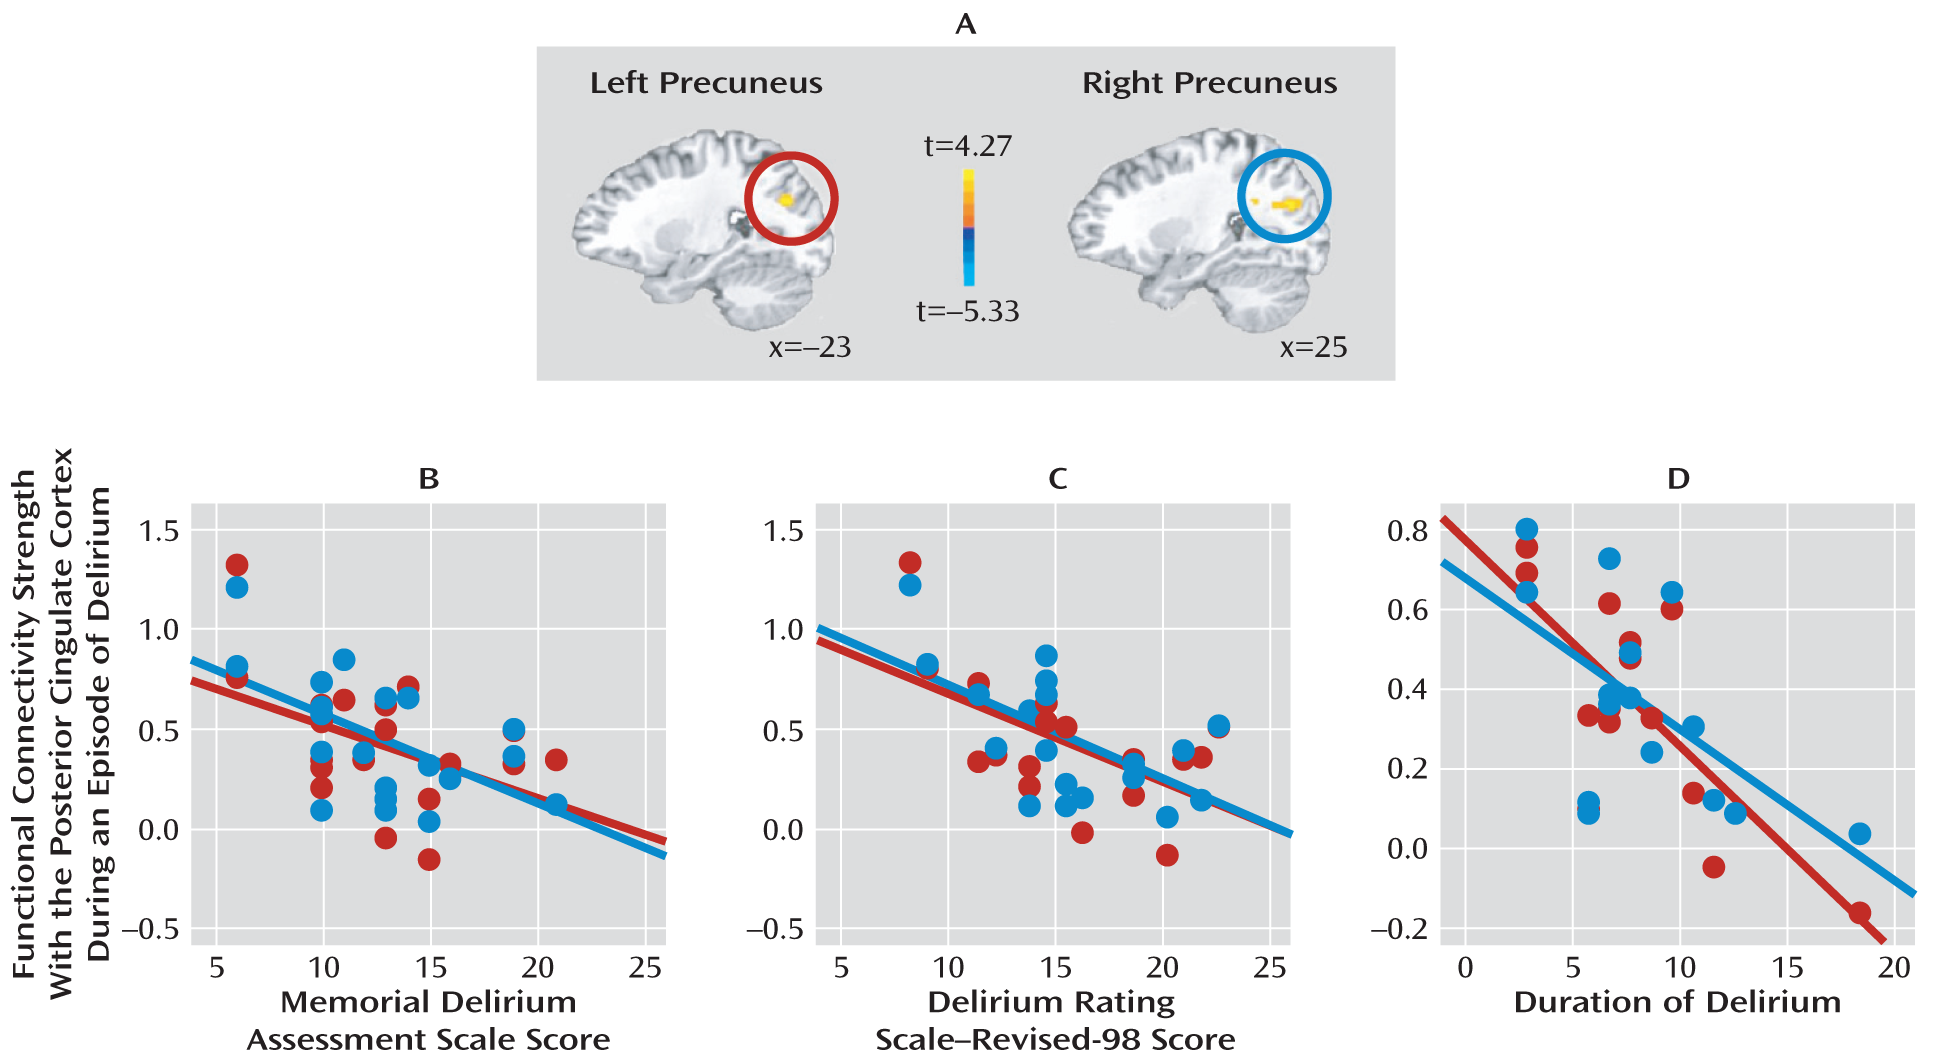
The correlations between the severity or duration of delirium and functional connectivity strengths with the posterior cingulate cortex in all regions that were obtained in the between-group or the paired comparisons were counted using the total extent of leukoaraiosis as a control variable. This was because the extent of leukoaraiosis was correlated with delirium severity as measured by the Memorial Delirium Assessment Scale (r=0.57, N=20, p=0.008) and the Delirium Rating Scale–Revised-98 (r=0.49, N=20, p=0.027). In these partial correlation analyses, significant results were observed only in the precuneus bilaterally during a delirium episode, but not after the resolution. As shown in Figure 2, they were inversely correlated with the total duration of delirium (left: r=–0.80, df=12, p=0.001; right: r=–0.66, df=12, p=0.011) and with severity as measured by the Memorial Delirium Assessment Scale (left: r=–0.47, df=17, p=0.042; right: r=–0.58, df=17, p=0.009) and the Delirium Rating Scale–Revised-98 (left: r=–0.58, df=17, p=0.009; right: r=–0.62, df=17, p=0.004). In addition, the degrees of changes in functional connectivity strengths and the delirium measures were not significantly correlated in any regions.
FIGURE 2. Associations of Delirium Severity or Duration With Functional Connectivity Strengths of the Bilateral Precuneus With the Posterior Cingulate Cortex in During-Episode Patientsa
a Panel A shows statistical maps indicating voxels that showed greater precuneus connectivity with the posterior cingulate cortex during an episode of delirium relative to that of comparison subjects. In panels B through D, greater functional connectivity strength between the left and right precuneus and posterior cingulate cortex showed reverse correlations with the severity of delirium, as measured by the Memorial Delirium Assessment Scale (panel B, left: r=–0.47, p<0.05; right: r=–0.58, p<0.01) and the Delirium Rating Scale–Revised-98 (panel C, left: r=–0.58, p<0.01; right: r=–0.62, p<0.01), and with the duration of delirium (panel D, left: r=–0.80, p<0.01; right: r=–0.66, p<0.05). Results for the left precuneus are indicated in red, and those for the right precuneus, in blue. r=partial correlation coefficient after adjusting for the total extent of leukoaraiosis.

Functional Connectivity Strengths Between the Subcortical Regions

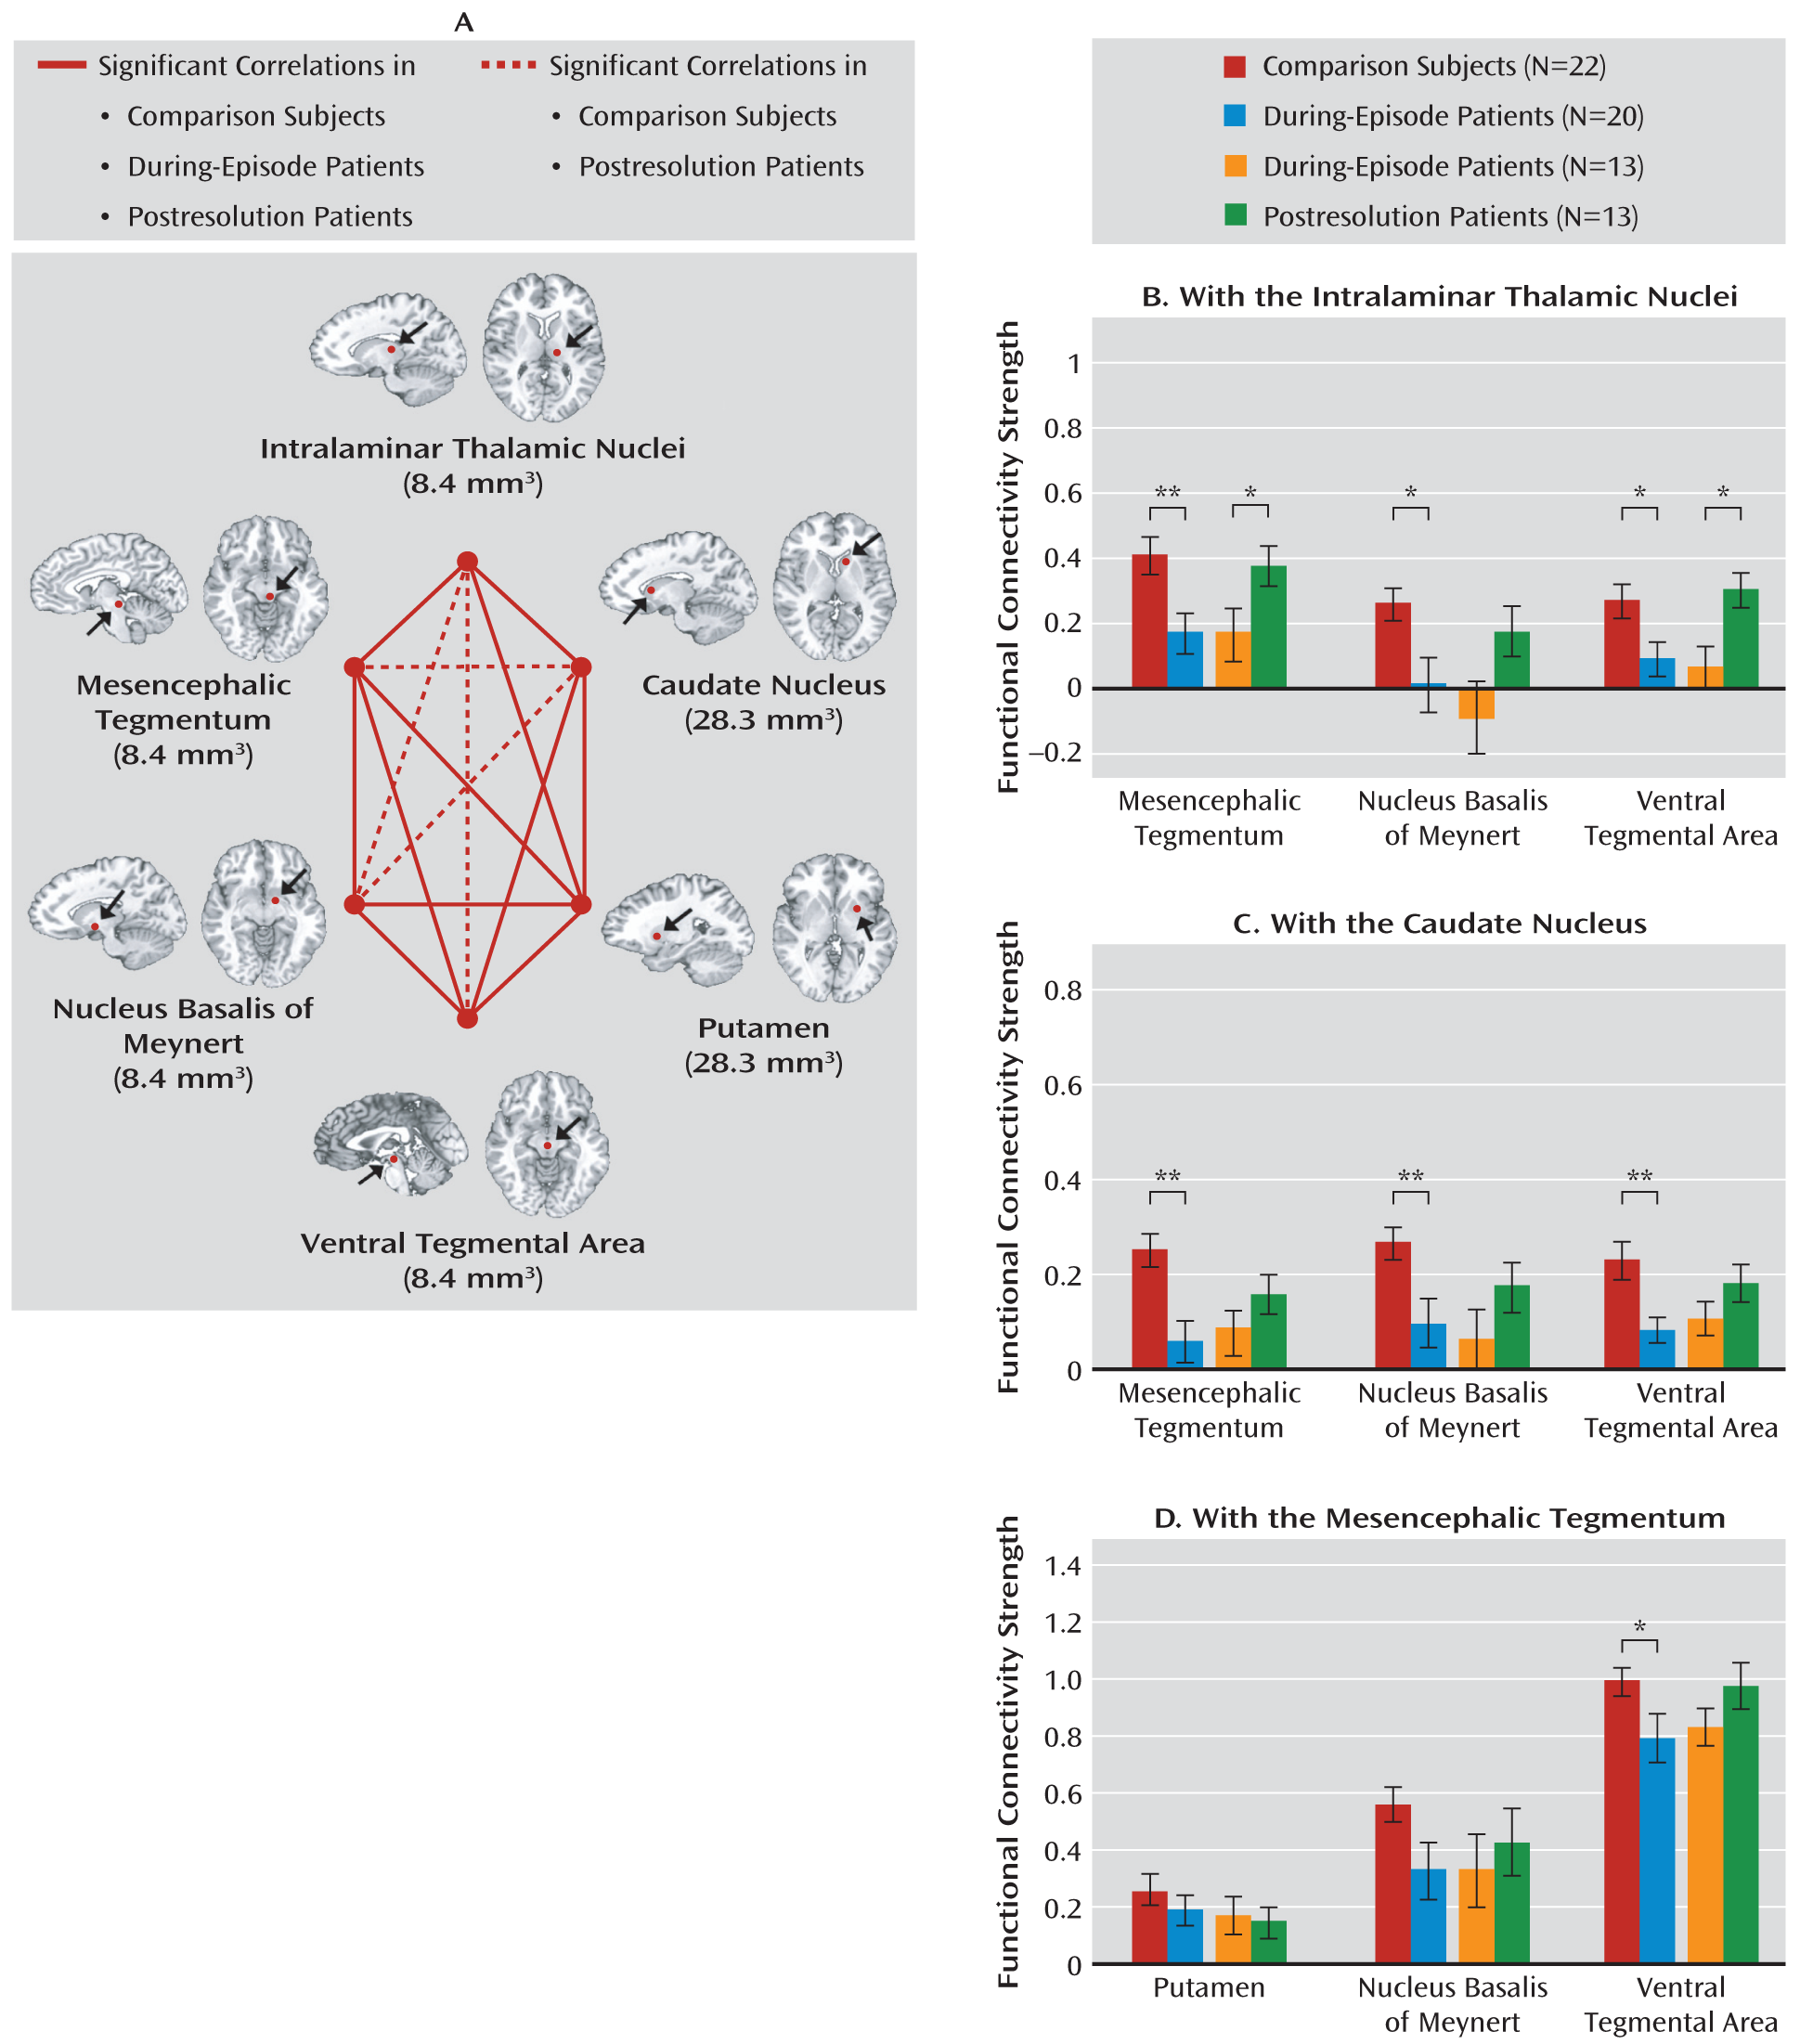
Comparison subjects and postresolution delirium patients displayed a similar pattern of functional connectivity strengths from each pair of six subcortical regions; each pair was significantly correlated with the others. In contrast, during-episode delirium patients revealed a lack of significant functional connections across several pairs (Figure 3A), including between the intralaminar thalamic nuclei and the nucleus basalis (t=0.14, df=19, p=0.888), between the intralaminar thalamic nuclei and the ventral tegmental area (t=1.71, df=19, p=0.103), between the caudate and the mesencephalic tegmentum (t=1.26, df=19, p=0.225), and between the caudate and the nucleus basalis (t=1.96, df=19, p=0.065).
FIGURE 3. Functional Connectivities Among the Subcortical Regionsa
a In panel A, every region of interest was functionally connected with other regions in comparison subjects and postresolution patients. However, during-episode patients lacked some of these connections. Although both left and right regions of interest were used in the analysis, only left ones are displayed, with volumes, for clarity in indicating their positions. Panels B through D show group differences in functional connectivity strengths of the intralaminar thalamic nuclei (B), caudate nucleus (C), and mesencephalic tegmentum (D) with other subcortical regions. Error bars represent the standard deviations.
*p<0.05. **p<0.01.
As shown in Figure 3, panels B–D, relative to comparison subjects, during-episode patients had reduced correlation coefficients for connections of the intralaminar thalamic nuclei with the mesencephalic tegmentum (t=2.81, df=40, p=0.008), the nucleus basalis (t=2.51, df=31, p=0.018), and the ventral tegmental area (t=2.39, df=40, p=0.022); of the caudate with the mesencephalic tegmentum (t=3.49, df=40, p=0.001), the nucleus basalis (t=2.90, df=40, p=0.006), and the ventral tegmental area (t=3.06, df=37, p=0.004); and of the mesencephalic tegmentum with the ventral tegmental area (t=2.03, df=40, p=0.049). The within-group differences between during-episode and postresolution functional connectivity strengths of the intralaminar thalamic nuclei were significant for paired scans between each of the mesencephalic tegmentum (t=2.77, df=12, p=0.017) and the ventral tegmental area (t=2.51, df=12, p=0.027; Figure 3B). Other than those pairs listed above, no additional between-group or paired-group differences were found. In addition, significant results were not observed in the correlations between connectivity strengths with the posterior cingulate cortex in the brain regions exhibiting group differences and subcortical connectivity strengths with the caudate in all groups.

Discussion

To explore delirium-specific neural dysfunctions, we serially scanned patients during and after an episode of delirium using resting-state fMRI and analyzed functional connectivity among the brain regions. The between-group comparison revealed that posterior cingulate cortex activity was more strongly associated with dorsolateral prefrontal cortex activity in during-episode patients relative to those of postresolution patients and comparison subjects. These findings are in line with the results between the posterior cingulate cortex and the dorsolateral prefrontal cortex from the one-sample group analysis, which showed a negative correlation in comparison subjects and a positive correlation in during-episode patients. Our finding of the inverse correlations between the two regions in comparison subjects has been also demonstrated in previous studies for healthy subjects (7, 10, 11), suggesting their reciprocal relationship during a resting state.
Functional connectivity studies have revealed some resting-state networks, including the default-mode network and executive network (29). Here, the posterior cingulate cortex is a hub node of the default-mode network, whereas the dorsolateral prefrontal cortex is a part of the executive network or task-positive component (10, 30). The reciprocal relationship of the two regions may contribute to individuals' preparation for or adaptation to unexpected or novel environmental events (10, 11). Therefore, reduced anticorrelation or positive correlation between them in during-episode patients may suggest a reversal of the relationship between the two reciprocal networks during an episode of delirium, and this abnormal interaction may contribute to some clinical features, such as reduced clarity of awareness of the environment. Anticorrelation is an inverse correlation between intrinsic fluctuations in neuronal activity of the seed region and those of the target region in brain functional networks. In addition, the anticorrelation strength between these two neural systems has been associated with behavioral consistency in performing cognitive tasks (31), which is a useful index for an efficient regulation of attention (32). Reduced anticorrelation between the two regions was revealed in patients with attention deficit hyperactivity disorder, and this reduction was associated with attentional lapses (33). A resting-state anticorrelation between default-mode network and frontolateral cortex activities was presented during wakefulness but was decreased in proportion to propofol-induced loss of consciousness (34) and was reduced in the vegetative state (35). Taken together, a disruptive alteration in the reciprocity between the posterior cingulate cortex and the dorsolateral prefrontal cortex may explain impaired attention or consciousness, which is considered a cardinal symptom of delirium (36).
It deserves mention that this anticorrelation was not revived after the recovery of delirium, as shown in Figure 1. This means that delirium-related default-mode network changes can be maintained for a certain period even after clinical improvement. The interval of 5.8 days between the scans in this study was longer than a reported average duration of 3.4 days of delirium in an intensive care unit (37), suggesting that the time gap was enough to achieve an improvement. In addition, scores on the Memorial Delirium Assessment Scale and the Delirium Rating Scale–Revised-98 were sufficiently low in postresolution patients. However, given that some symptoms, including inattention, may persist long after the resolution of delirium and result in cognitive impairment (38), our postresolution patients could also have subclinical residual symptoms. Therefore, the persistence of reduced anticorrelation between the posterior cingulate cortex and the dorsolateral prefrontal cortex may underlie some residual delirium symptoms such as mild inattention. Alternatively, considering that there were no significant correlations between the degrees of regional changes in functional connectivity strengths and changes in the delirium severity measures, this remaining effect may reflect only a delayed recovery of the disruptive connectivity.
This study also revealed a strong correlation between precuneus and posterior cingulate cortex activities during an episode of delirium, suggesting enhanced integration of the posteromedial default-mode network. This was in contrast to decreased functional connectivity between these two regions in dementia patients (8, 12), suggesting different roles of the posteromedial default-mode network between delirium and dementia. As shown in the results, more increased functional connectivity between these two regions was associated with lower scores on the Memorial Delirium Assessment Scale and the Delirium Rating Scale–Revised-98, suggesting that enhanced integration in the posteromedial default-mode network during an episode of delirium may help to prevent exacerbation of delirious symptoms. In addition, posteromedial default-mode network connectivity was inversely correlated with duration of delirium, suggesting that the enhancement may help to facilitate the resolution. Fluctuating course, including repeated periods of temporary clear consciousness, is one of the diagnostic features of delirium (39), and this might be attributed to an action of certain protective factors that help patients restore normality. Therefore, enhanced integration in the posteromedial default-mode network may account for the fluctuating course of delirium.
As Laureys mentioned (40), awareness may not be exclusively related to the frontoparietal network, and the relationship between the global levels of brain functioning and states of awareness may not be absolute. As suggested by Gaudreau and Gagnon (17), critical substrates of delirium may be located in the striatum, the ventral tegmental area, or the thalamus. Our subcortical analysis showed that the intralaminar thalamic nuclei and caudate appeared to have a notable influence on functional disconnections during an episode of delirium. When examining connectivity with the intralaminar thalamic nuclei, mesencephalic tegmentum, nucleus basalis, and ventral tegmental area, each showed diminished connectivity in during-episode patients relative to those of postresolution patients and comparison subjects. The intralaminar thalamic nuclei and mesencephalic tegmentum have been shown to be functionally interconnected and to form part of the ascending reticular activating system, which is known to be involved in the regulation of consciousness and arousal (14, 22). Considering that a disturbance of consciousness is an essential prerequisite for diagnosing delirium, reduced association between these two subcortical regions during an episode of delirium and its recovery after the resolution may explain some of the pathophysiology of delirium.
The striatum has been presumed to play an important role in delirium as it is one of the richest regions innervated by the acetylcholine and dopamine neurons. Antidepressant-induced (41) or ECT-induced (42, 43) delirium has been associated with striatal lesions. Our findings also support a pathophysiological role of the caudate in delirium in that its connectivity strengths with other subcortical regions were weakened during the episode of delirium and normalized after the resolution of delirium. The substantial and reversible aberration of functional connections among the subcortical regions supports the use or development of cholinergic/dopaminergic drugs in both the prevention and the treatment of delirium.
There are some limitations in this study. Because only patients who could cooperate with MRI scanning were recruited, selection bias should be taken into account when generalizing the findings to the patients with more severe symptoms who could not complete the scanning. Although our sample patients included all motor subtypes, connectional differences between the subtypes could not be analyzed because of the limited sample size. As logistical difficulties, including early discharge and the persistence of delirium, made it possible to obtain paired scans in only 13 patients, this reduced sample size may result in limited conclusions. In addition, the effects of antipsychotic medication could be a confounding factor, but it may be only one of diverse confounding factors of various general medical conditions in patients with delirium. A recent review reported that there was no general effect of antipsychotics on the fMRI signal, although the extent of blockade of the dopamine receptor influenced the fMRI signal (44). It should be noted here that the number of patients treated with antipsychotics was similar between the initial and follow-up scans and that only low-dose antipsychotics were administered in both scan conditions. Finally, imaging subcortical connectivity was potentially problematic, because some regions are smaller than the spatial resolution of the fMRI. This is inevitable when studying a small structure because all fMRI analyses include a smoothing procedure, and interpreting the results from subcortical connectivity needs to be made with caution.
Conclusions

We examined the reversible disturbance of functional connectivity in hypothesized brain regions in patients with delirium by analyzing paired data of resting-state fMRI, and we provided evidence for a neural basis of a syndromal array of delirium. In particular, disruptions in reciprocity between the posterior cingulate cortex and the dorsolateral prefrontal cortex and disruptions in interregional connectivity among the acetylcholine/dopamine-related subcortical regions appear to play a pathological role in a disturbance of consciousness in delirium, whereas enhanced connectivity in the posteromedial default-mode network may serve as protection related to rapid improvement. This study is the first to demonstrate that abnormal resting-state functional networks may underlie the pathophysiology of delirium. A more integrative study needs to be performed to explore the relationship between these cortical and subcortical circuits in delirium, and further research will help to elucidate whether the connectional problems during delirium differ according to the cause of delirium or phenomenological profiles such as motor subtypes.

Footnote

Received June 28, 2011; revisions received Oct. 10 and Dec. 3, 2011; accepted Dec. 19, 2011.

References

1.
Francis J, Martin D, Kapoor WN: A prospective study of delirium in hospitalized elderly. JAMA 1990; 263:1097–1101
2.
Soiza RL, Sharma V, Ferguson K, Shenkin SD, Seymour DG, Maclullich AM: Neuroimaging studies of delirium: a systematic review. J Psychosom Res 2008; 65:239–248
3.
Fox MD, Raichle ME: Spontaneous fluctuations in brain activity observed with functional magnetic resonance imaging. Nat Rev Neurosci 2007; 8:700–711
4.
Allen G, Barnard H, McColl R, Hester AL, Fields JA, Weiner MF, Ringe WK, Lipton AM, Brooker M, McDonald E, Rubin CD, Cullum CM: Reduced hippocampal functional connectivity in Alzheimer's disease. Arch Neurol 2007; 64:1482–1487
5.
Vanhaudenhuyse A, Noirhomme Q, Tshibanda LJ, Bruno M, Boveroux P, Schnakers C, Soddu A, Perlbarg V, Ledoux D, Brichant J, Moonen G, Maquet P, Greicius MD, Laureys S, Boly M: Default network connectivity reflects the level of consciousness in non-communicative brain-damaged patients. Brain 2010; 133:161–171
6.
Shehzad Z, Kelly AM, Reiss PT, Gee DG, Gotimer K, Uddin LQ, Lee SH, Margulies DS, Roy AK, Biswal B, Petkova E, Castellanos FX, Milham MP: The resting brain: unconstrained yet reliable. Cereb Cortex 2009; 19:2209–2229
7.
Greicius MD, Krasnow B, Reiss AL, Menon V: Functional connectivity in the resting brain: a network analysis of the default mode hypothesis. Proc Natl Acad Sci USA 2003; 100:253–258
8.
Liu Y, Wang K, Yu C, He Y, Zhou Y, Liang M, Wang L, Jiang T: Regional homogeneity, functional connectivity and imaging markers of Alzheimer's disease: a review of resting-state fMRI studies. Neuropsychologia 2008; 46:1648–1656
9.
He Y, Wang L, Zang Y, Tian L, Zhang X, Li K, Jiang T: Regional coherence changes in the early stages of Alzheimer's disease: a combined structural and resting-state functional MRI study. Neuroimage 2007; 35:488–500
10.
Fox MD, Snyder AZ, Vincent JL, Corbetta M, Van Essen DC, Raichle ME: The human brain is intrinsically organized into dynamic, anticorrelated functional networks. Proc Natl Acad Sci USA 2005; 102:9673–9678
11.
Fransson P: Spontaneous low-frequency bold signal fluctuations: an fMRI investigation of the resting-state default mode of brain function hypothesis. Hum Brain Mapp 2005; 26:15–29
12.
Wang K, Liang M, Wang L, Tian L, Zhang X, Li K, Jiang T: Altered functional connectivity in early Alzheimer's disease: a resting-state fMRI study. Hum Brain Mapp 2007; 28:967–978
13.
Cavanna AE, Trimble MR: The precuneus: a review of its functional anatomy and behavioral correlates. Brain 2006; 129:564–583
14.
Solai LKK: Kaplan & Sadock's Comprehensive Textbook of Psychiatry, 9th ed, vol 1. Philadelphia, Williams & Wilkins, 2009
15.
Flacker JM, Cummings V, Mach JR, Bettin K, Kiely DK, Wei J: The association of serum anticholinergic activity with delirium in elderly medical patients. Am J Geriatr Psychiatry 1998; 6:31–41
16.
Trzepacz PT: Update on the neuropathogenesis of delirium. Dement Geriatr Cogn Disord 1999; 10:330–334
17.
Gaudreau J, Gagnon P: Psychotogenic drugs and delirium pathogenesis: the central role of the thalamus. Med Hypotheses 2005; 64:471–475
18.
Scheltens P, Barkhof F, Leys D, Pruvo JP, Nauta JJ, Vermersch P, Steinling M, Valk J: A semiquantative rating scale for the assessment of signal hyperintensities on magnetic resonance imaging. J Neurol Sci 1993; 114:7–12
19.
Breitbart W, Rosenfeld B, Roth A, Smith MJ, Cohen K, Passik S: The Memorial Delirium Assessment Scale. J Pain Symptom Manage 1997; 13:128–137
20.
Trzepacz PT, Mittal D, Torres R, Kanary K, Norton J, Jimerson N: Validation of the Delirium Rating Scale–Revised-98: comparison with the Delirium Rating Scale and the Cognitive Test for Delirium. J Neuropsychiatry Clin Neurosci 2001; 13:229–242
21.
Cox RW: AFNI: software for analysis and visualization of functional magnetic resonance neuroimages. Comput Biomed Res 1996; 29:162–173
22.
Kinomura S, Larsson J, Gulyas B, Roland PE: Activation by attention of the human reticular formation and thalamic intralaminar nuclei. Science 1996; 271:512–515
23.
Herholz K, Weisenbach S, Zundorf G, Lenz O, Schröder H, Bauer B, Kalbe E, Heiss WD: In vivo study of acetylcholine esterase in basal forebrain, amygdala, and cortex in mild to moderate Alzheimer's disease. Neuroimage 2004; 21:136–143
24.
D'Ardenne K, McClure SM, Nystrom LE, Cohen JD: Bold responses reflecting dopaminergic signals in the human ventral tegmental area. Science 2008; 319:1264–1267
25.
Kim E, Ku J, Namkoong K, Lee W, Lee KS, Park J, Lee SY, Kim J, Kim SI, Jung Y: Mammillothalamic functional connectivity and memory function in Wernicke's encephalopathy. Brain 2009; 132:369–376
26.
Worsley KJ, Marrett S, Neelin P, Vandal AC, Friston KJ, Evans AC: A unified statistical approach for determining significant signals in images of cerebral activation. Hum Brain Mapp 1996; 4:58–73
27.
Shioiri A, Kurumaji A, Takeuchi T, Matsuda H, Arai H, Nishikawa T: White matter abnormalities as a risk factor for postoperative delirium revealed by diffusion tensor imaging. Am J Geriatr Psychiatry 2010; 18:743–753
28.
Andrews Hanna JR, Snyder AZ, Vincent JL, Lustig C, Head D, Raichle ME, Buckner RL: Disruption of large-scale brain systems in advanced aging. Neuron 2007; 56:924–935
29.
Damoiseaux JS, Rombouts SA, Barkhof F, Scheltens P, Stam CJ, Smith SM, Beckmann CF: Consistent resting-state networks across healthy subjects. Proc Natl Acad Sci USA 2006; 103:13848–13853
30.
Seeley W, Menon V, Schatzberg AF, Keller J, Glover GH, Kenna H, Reiss AL, Greicius MD: Dissociable intrinsic connectivity networks for salience processing and executive control. J Neurosci 2007; 27:2349–2356
31.
Kelly AM, Uddin LQ, Biswal B, Castellanos FX, Milham MP: Competition between functional brain networks mediates behavioral variability. Neuroimage 2008; 39:527–537
32.
Stuss DT, Murphy KJ, Binns MA, Alexander MP: Staying on the job: the frontal lobes control individual performance variability. Brain 2003; 126:2363–2380
33.
Castellanos FX, Margulies DS, Kelly C, Uddin LQ, Ghaffari M, Kirsch A, Shaw D, Shehzad Z, Di Martino A, Biswal B, Sonuga-Barke EJ, Rotrosen J, Adler LA, Milham MP: Cingulate-precuneus interactions: a new locus of dysfunction in adult attention-deficit/hyperactivity disorder. Biol Psychiatry 2008; 63:332–337
34.
Boveroux P, Vanhaudenhuyse A, Bruno M, Noirhomme Q, Lauwick S, Luxen A, Degueldre C, Plenevaux A, Schnakers C, Phillips C, Brichant J, Bonhomme V, Maquet P, Greicius MD, Laureys S, Boly M: Breakdown of within- and between-network resting state functional magnetic resonance imaging connectivity during propofol-induced loss of consciousness. Anesthesiology 2010; 113:1038–1053
35.
Boly M, Tshibanda L, Vanhaudenhuyse A, Noirhomme Q, Schnakers C, Ledoux D, Boveroux P, Garweg C, Lambermont B, Phillips C, Luxen A, Moonen G, Bassetti C, Maquet P, Laureys S: Functional connectivity in the default network during resting state is preserved in a vegetative but not in a brain dead patient. Hum Brain Mapp 2009; 30:2393–2400
36.
Meagher DJ, Trzepacz PT: Delirium phenomenology illuminates pathophysiology, management, and course. J Geriatr Psychiatry Neurol 1998; 11:150–156
37.
Ely EW, Gautam S, Margolin R, Francis J, May L, Speroff T, Truman B, Dittus R, Bernard R, Inouye SK: The impact of delirium in the intensive care unit on hospital length of stay. Intensive Care Med 2001; 27:1892–1900
38.
McCusker J, Cole M, Dendukuri N, Belzile E, Primeau F: Delirium in older medical inpatients and subsequent cognitive and functional status: a prospective study. CMAJ 2001; 165:575–583
39.
Inouye SK: Delirium in older persons. N Engl J Med 2006; 354:1157–1165
40.
Laureys S: The neural correlate of (un)awareness: lessons from the vegetative state. Trends Cogn Sci 2005; 9:556–559
41.
Figiel GS, Krishnan KR, Breitner JC, Nemeroff CB: Radiologic correlates of antidepressant-induced delirium: the possible significance of basal-ganglia lesions. J Neuropsychiatry Clin Neurosci 1989; 1:188–190
42.
Figiel GS, Coffey CE, Djang WT, Hoffman G, Doraiswamy PM: Brain magnetic resonance imaging findings in ECT-induced delirium. J Neuropsychiatry Clin Neurosci 1990; 2:53–58
43.
Martin M, Figiel G, Mattingly G, Zorumski CF, Jarvis MR: ECT-induced interictal delirium in patients with a history of a CVA. J Geriatr Psychiatry Neurol 1992; 5:149–155
44.
Röder CH, Hoogendam JM, van der Veen FM: fMRI, antipsychotics and schizophrenia: influence of different antipsychotics on BOLD-signal. Curr Pharm Des 2010; 16:2012–2025

Information & Authors

Information

Published In

Go to American Journal of Psychiatry
American Journal of Psychiatry
Pages: 498 - 507
PubMed: 22549209

History

Received: 28 June 2011
Revision received: 10 October 2011
Revision received: 3 December 2011
Accepted: 19 December 2011
Published online: 1 May 2012
Published in print: May 2012

Authors

Details

Soo-Hee Choi, M.D.
From the Department of Psychiatry, the Department of Diagnostic Radiology, and the Institute of Behavioral Science in Medicine at Yonsei University College of Medicine, Seoul, Korea; the Department of Biomedical Engineering, Hanyang University, Seoul.
Hyeongrae Lee, M.S.
From the Department of Psychiatry, the Department of Diagnostic Radiology, and the Institute of Behavioral Science in Medicine at Yonsei University College of Medicine, Seoul, Korea; the Department of Biomedical Engineering, Hanyang University, Seoul.
Tae-Sub Chung, M.D., Ph.D.
From the Department of Psychiatry, the Department of Diagnostic Radiology, and the Institute of Behavioral Science in Medicine at Yonsei University College of Medicine, Seoul, Korea; the Department of Biomedical Engineering, Hanyang University, Seoul.
Kyung-Min Park, M.D.
From the Department of Psychiatry, the Department of Diagnostic Radiology, and the Institute of Behavioral Science in Medicine at Yonsei University College of Medicine, Seoul, Korea; the Department of Biomedical Engineering, Hanyang University, Seoul.
Young-Chul Jung, M.D., Ph.D.
From the Department of Psychiatry, the Department of Diagnostic Radiology, and the Institute of Behavioral Science in Medicine at Yonsei University College of Medicine, Seoul, Korea; the Department of Biomedical Engineering, Hanyang University, Seoul.
Sun I. Kim, Ph.D.
From the Department of Psychiatry, the Department of Diagnostic Radiology, and the Institute of Behavioral Science in Medicine at Yonsei University College of Medicine, Seoul, Korea; the Department of Biomedical Engineering, Hanyang University, Seoul.
Jae-Jin Kim, M.D., Ph.D.
From the Department of Psychiatry, the Department of Diagnostic Radiology, and the Institute of Behavioral Science in Medicine at Yonsei University College of Medicine, Seoul, Korea; the Department of Biomedical Engineering, Hanyang University, Seoul.

Notes

Address correspondence to Dr. Kim ([email protected]).

Funding Information

The authors report no financial relationships with commercial interests.Supported by a 2008 faculty research grant from Yonsei University College of Medicine (6-2008-0238).

Metrics & Citations

Metrics

Citations

Export Citations

If you have the appropriate software installed, you can download article citation data to the citation manager of your choice. Simply select your manager software from the list below and click Download.

For more information or tips please see 'Downloading to a citation manager' in the Help menu.

Format
Citation style
Style
Copy to clipboard

View Options

View options

PDF/EPUB

View PDF/EPUB

Get Access

Login options

Already a subscriber? Access your subscription through your login credentials or your institution for full access to this article.

Personal login Institutional Login Open Athens login
Purchase Options

Purchase this article to access the full text.

PPV Articles - American Journal of Psychiatry

PPV Articles - American Journal of Psychiatry

Not a subscriber?

Subscribe Now / Learn More

PsychiatryOnline subscription options offer access to the DSM-5-TR® library, books, journals, CME, and patient resources. This all-in-one virtual library provides psychiatrists and mental health professionals with key resources for diagnosis, treatment, research, and professional development.

Need more help? PsychiatryOnline Customer Service may be reached by emailing [email protected] or by calling 800-368-5777 (in the U.S.) or 703-907-7322 (outside the U.S.).

Media

Figures

Other

Tables

Share

Share

Share article link

Share