We describe a computerized adaptive test based on multidimensional item response theory for anxiety, using a recently described methodology for depression (
1). The basic idea of computerized adaptive testing is that after administering an item, we compute a provisional estimate of a person’s standing on the underlying construct (e.g., anxiety) and an uncertainty estimate (standard error). We select the next most informative item from a large bank of items, typically containing several hundred candidate items that have been simultaneously calibrated using a multidimensional item response theory model. Based on the response to the next item, the severity estimate and uncertainty are recomputed and the process is continued until a predefined uncertainty threshold has been met. The net result is that we are able to extract the information from a large item bank (e.g., 400 items) using a small number of items for any given individual (e.g., 12 items). In fact, this is exactly the case for our depression instrument, the Computerized Adaptive Testing–Depression Inventory (CAT-DI) (
1), for which adaptive administration of an average of 12 items maintained a correlation of 0.95 with the entire 389-item bank score. The resulting scores are highly informative regarding the underlying trait of interest and require minimal patient burden and no clinician burden. Depending on the application, different termination criteria can be used. The lower the uncertainty, the greater the number of items needed to meet the threshold. As an example, in our work with depression (
1), an average of 12 items was required for a standard error of 0.3, but an average of only six items was required for a standard error of 0.4. Nevertheless, with 12 items (SE=0.3), the correlation with the total item bank was 0.95, whereas with six items (SE=0.4), the correlation with the total item bank was still 0.92. The paradigm shift is that rather than administering a fixed number of items that provide limited information for any given individual, the test presents a varying number of items that target the individual’s specific level of impairment. Computerized adaptive testing allows the test algorithm to select a small set of items for each patient from a large bank of test items, targeting precision by selecting items based on prior item responses. The adaptive algorithm thus mimics an expert clinician, who may be able to quickly clarify the diagnosis with the patient’s confirmatory answers to a few questions or who may decide to follow up with more questions to clarify the issue when the patient’s answers to the initial questions do not consistently point to the same diagnosis.
As noted previously (
1), computerized adaptive testing and item response theory have been widely used in educational measurement but have rarely been used in mental health measurement (
2,
3). There are several reasons for this. First, large item banks are generally unavailable for mental health constructs. Second, mental health constructs (e.g., anxiety and depression) are inherently multidimensional, and computerized adaptive testing has primarily been based on unidimensional item response theory models. Applying unidimensional models to multidimensional data can result in biased trait estimates with corresponding underestimates of uncertainty and dramatic reductions in the size of the item bank (
4). Prior to the development of the CAT-DI, we studied application of item response theory-based computerized adaptive testing in analysis of the 626-item Mood and Anxiety Spectrum Scales (
5). This was the first study of mental health computerized adaptive testing using a large item bank and multidimensional item response theory in general and the bifactor model in particular (
5,
6). Computerized adaptive testing required an average of 24 items per subject yet maintained a correlation of 0.93 with the full 626-item score. In this study, we applied multidimensional computerized adaptive testing to the measurement of anxiety with the Computerized Adaptive Testing–Anxiety Inventory (CAT-ANX).
Method
The Bifactor Model
Most applications of item response theory are based on unidimensional models that assume that all of the association between the items is explained by a single primary latent dimension or factor (e.g., mathematical ability). However, mental health constructs are inherently multidimensional; for example, anxiety items may be sampled from mood, cognition, behavior, and somatization subdomains, which produce residual associations between items within the subdomains that are not accounted for by the primary dimension. If we attempt to fit such data to a traditional unidimensional item response theory model, we will typically have to discard the majority of candidate items to achieve a reasonable fit of the model to the data. By contrast, the bifactor item response theory model (
5–
7) permits each item to tap the primary dimension of interest (e.g., anxiety) and one of several subdomains (e.g., somatic complaints), thereby accommodating the residual dependence and retaining the majority of the items in the final model. The bifactor model of Gibbons and Hedeker (
6) was the first example of a confirmatory item factor analysis model, and the authors showed that it is computationally tractable regardless of the number of dimensions, in stark contrast to exploratory item factor-analytic models (
8). Furthermore, the estimated bifactor loadings are rotationally invariant, greatly simplifying the interpretability of the model estimates.
Computerized Adaptive Testing
Unlike a fixed-length test in which the items are fixed (in both content and number) and precision is allowed to vary, computerized adaptive testing fixes precision and allows the items to vary. Computerized adaptive testing requires computer administration and previous calibration with a suitable item response theory model. The steps of computerized adaptive testing are 1) administer an item; 2) compute a severity score and its uncertainty; 3) identify the next maximally informative item based on the current severity estimate and item response theory parameters; and 4) repeat steps 1–3 until the uncertainty drops below a prespecified threshold. Computerized adaptive testing has recently been adapted to work with the bifactor model (
1).
The Item Bank
The final item bank consists of 431 anxiety items (we began with 467 items, but excluded 36 items that had small loading [<0.3] on the primary dimension). We organized the items into subdomains of mood, cognition, behavior, and somatization using a hierarchical approach informed by previous empirical work (
9–
12). A qualitative review of the items was conducted by consensus among team members from the Western Psychiatric Institute and Clinic (
13), which eliminated redundant items, items that were confusing or vague, and items that were poorly written.
Example items from each domain and subdomain are presented in
Table 1. Most items were rated on a 5-point ordinal scale with categories ranging from “not at all” to “extremely,” from “no difficulty” to “extreme difficulty,” or from “never” to “always,” although for the purposes of illustration,
Table 1 includes two dichotomous items. The statistical model permits mixtures of items with different numbers of response categories. The items were selected based on a review of over 100 existing depression and anxiety rating scales (see the appendix in reference
1). Items were modified to refer to the previous 2-week period and to have similar response categories.
Sample
The sample was described in detail in our report on the CAT-DI study (
1). Briefly, participants were male and female treatment-seeking outpatients between 18 and 80 years of age and nonpsychiatric community comparison subjects. Comparison subjects were recruited through advertisements, and patients were recruited through advertisements, clinician referrals, and outpatient clinics at the Western Psychiatric Institute and Clinic. Patients were recruited from two facilities, the Bellefield Clinic at the University of Pittsburgh (Western Psychiatric Institute and Clinic) in Pittsburgh and a community clinic at the DuBois Regional Medical Center in DuBois, Penn. Participants who had been in psychiatric treatment within the past 2 years were considered psychiatric participants. Exclusion criteria are described in our previous study (
1). The key exclusions were a history of schizophrenia, schizoaffective disorder, or psychosis; organic neuropsychiatric syndromes (e.g., Alzheimer’s disease); recent drug or alcohol dependence; and inpatient status. Comparison subjects did not have any psychiatric diagnoses or treatment within the past 2 years or a history of schizophrenia, schizoaffective disorder, or psychosis. Nonpsychiatric comparison subjects were screened by a trained clinical interviewer to ensure that they had not been in treatment for the past 2 years, which was also corroborated by medical records. Literacy was an inclusion criterion. None of the participants refused to use the computer, as this was described as part of the study before enrollment. Any participant with computer or language issues was given assistance.
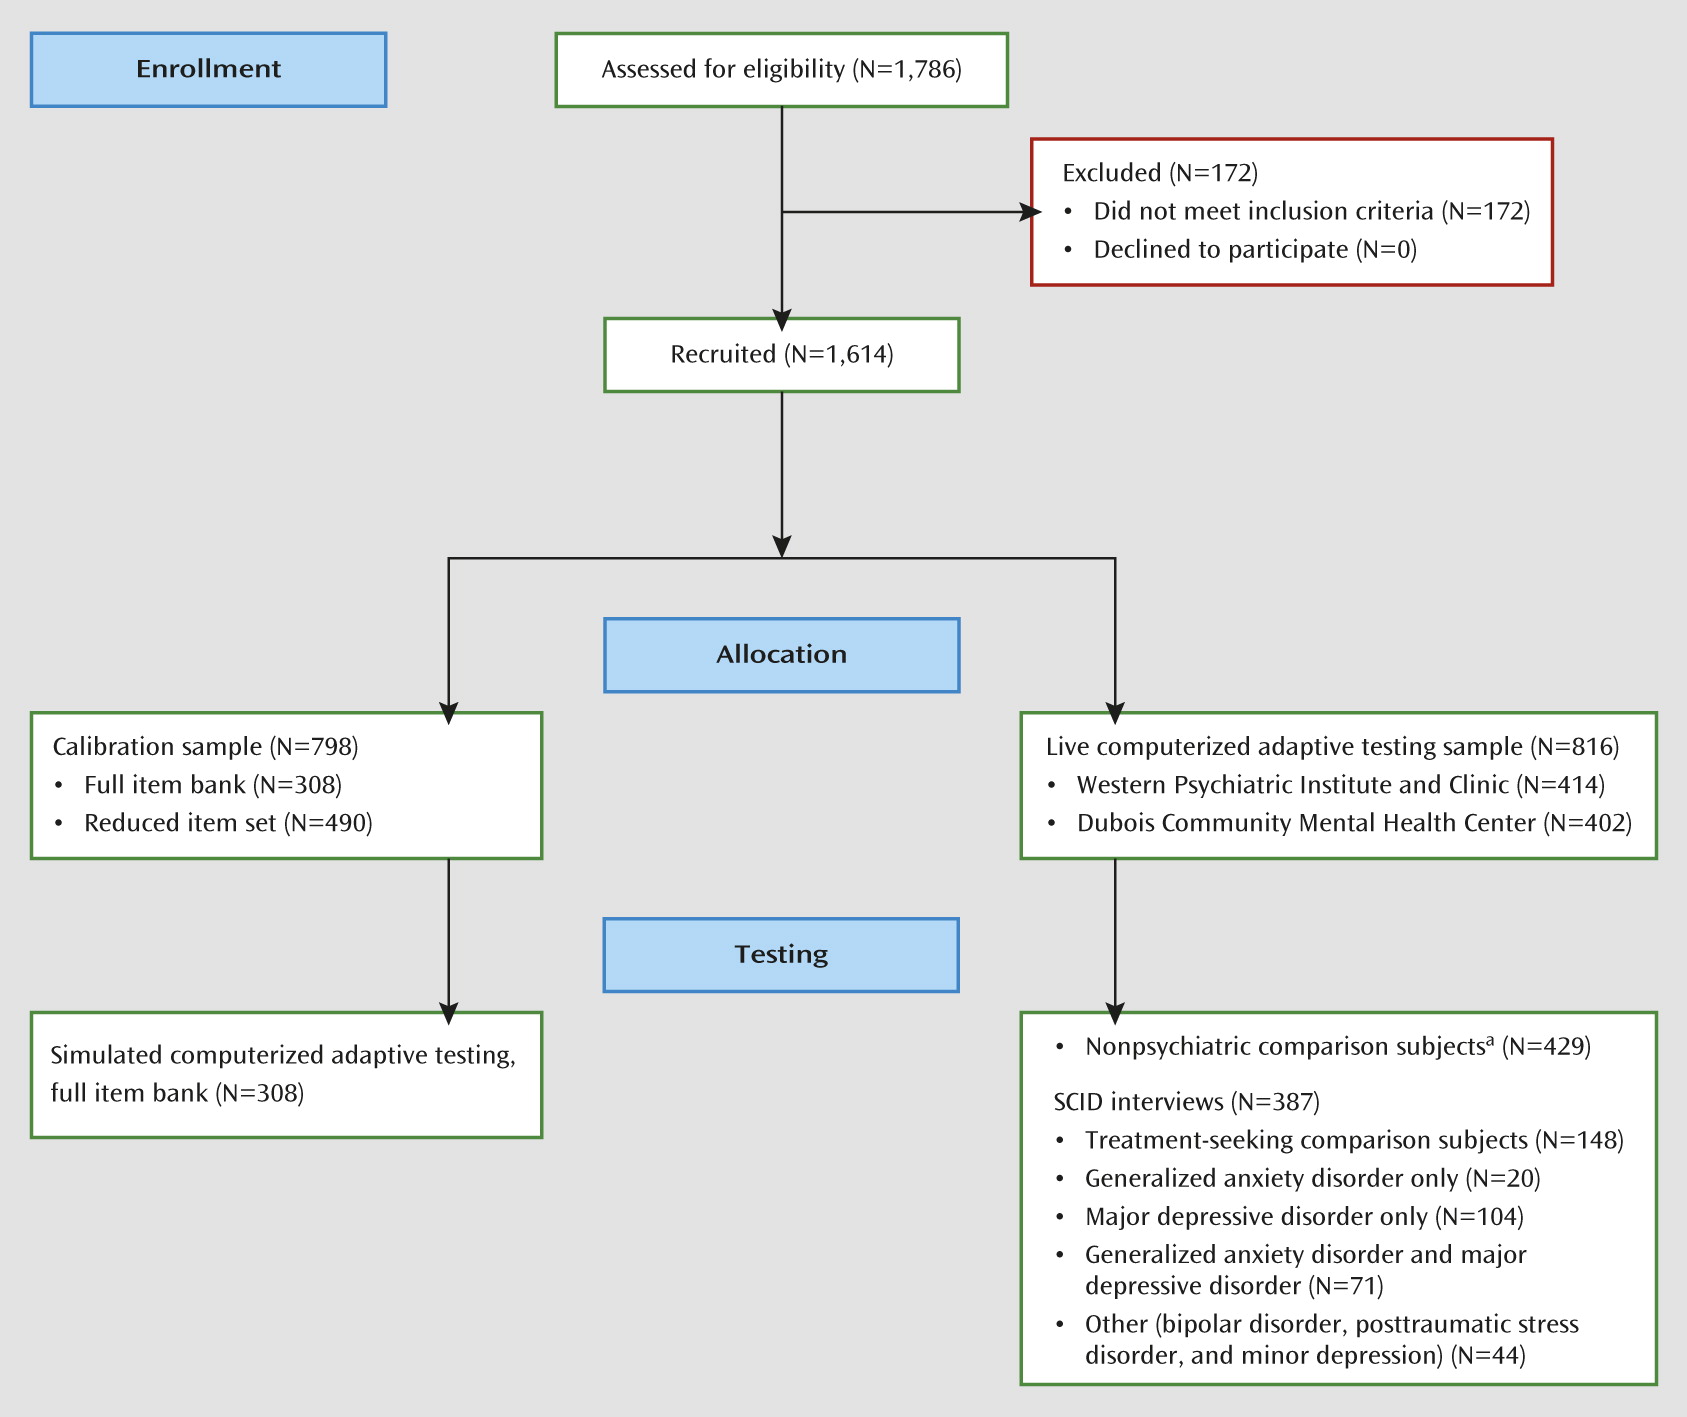
We report on the analysis of data from 1,614 participants: 798 who were used to calibrate the item response theory model (at Western Psychiatric Institute and Clinic) and 816 who received the live CAT-ANX (414 at Western Psychiatric Institute and Clinic and 402 at DuBois) (
Figure 1). For simulated adaptive testing, 308 participants (of the 798) completed all of the 431 items in the bank, permitting computation of the correlation between the results of computerized adaptive testing and total test score; these participants were also part of the calibration sample. The other 490 calibration participants completed a subsample of 252 items (of a larger set of 1,008 items covering depression, anxiety, and mania) based on a balanced incomplete block design that maximized the pairings of all items (
14).
A total of 387 consecutive participants received a full clinician-based diagnostic interview using the Structured Clinical Interview for DSM-IV (SCID) (
15) and the live CAT-ANX (i.e., the reduced set of an average of 12 items per subject). The diagnostic interview was conducted before administration of the CAT-ANX, and therefore both patient and clinician were blind to the testing results. Participants’ demographic characteristics and SCID-based diagnostic prevalence rates of major depressive disorder and generalized anxiety disorder are presented in
Table 2.
Statistical Methods
Calibration was performed using the bifactor model for graded response data (
7). CAT-ANX scores were based on expected a posteriori estimates (
16). The CAT-ANX scores were then used in a logistic regression to predict a clinician-based DSM diagnosis of generalized anxiety disorder, so that CAT-ANX scores can be related to the probability of meeting DSM criteria for generalized anxiety disorder. A multinomial logistic regression model was used to model the relationship between CAT-DI and CAT-ANX scores with SCID-based diagnoses of major depressive disorder, generalized anxiety disorder, and their comorbidity. It should be noted that the CAT-ANX refers to symptoms in the past 2 weeks, whereas the DSM criteria for generalized anxiety disorder refer to the past 6 months. This discrepancy places an upper bound on the possible agreement between these two classifiers and raises the question of whether the diagnosis of generalized anxiety disorder is an ideal standard for anxiety disorder by which to judge the sensitivity of more temporally proximal measures. To this end, it is important to consider other external validators of measurement tools based on computerized adaptive testing. For example, sensitivity to treatment-related changes in the severity of mental disorders such as anxiety would provide a useful alternative in the absence of an established gold standard. Similarly, providing greater differentiation between patients with different genetic variants or imaging-based brain activation patterns would also be good alternatives to the traditional approach of establishing sensitivity and specificity for clinician-based diagnoses of questionable validity or reliability.
Unlike traditional psychological test scores that are simple summations of the individual item scores, the item response theory approach not only provides a point estimate of the severity score, it also provides an estimate of uncertainty for the estimated score (i.e., a standard error or, in the case of the Bayes estimate used here, a posterior standard deviation of the estimated severity score). This is another important advantage of item response theory-based measurement.
Further details of the study’s statistical approach are provided in the
data supplement that accompanies the online edition of this article.
Results
Calibration
Results of the item calibration study revealed that the bifactor model with four subdomains (mood, cognition, behavior, somatization) dramatically improved fit over a unidimensional item response theory model (χ2=7,304, df=431, p<0.0001).
Simulated Computerized Adaptive Testing
Results of simulated computerized adaptive testing revealed that for a standard error of 0.3, an average of 12 items per subject (range, 6–24) were required. The correlation between the 12-item average computerized adaptive testing severity score and the total 431-item score was 0.94. In the live computerized adaptive testing sample, the median length of time required to complete the 12-item (average) computerized adaptive testing was 2.48 minutes (SD=1.56). Shorter times should be achievable using the final platform (a touchscreen device) instead of the mouse-based interface used to collect these data. Increasing the termination criterion to a standard error of 0.4 (i.e., less precise) decreased the average required number of items to eight, yet maintained a correlation of 0.92 with the 431-item bank score.
Using a standard error of 0.3, average precision was 0.35, and computerized adaptive testing terminated for insufficient item information in 30% of the cases. In all but one of those cases, the estimated CAT-ANX score (mean=0.0, SD=1.0) was less than −1.4 (with the majority less than −2.0), indicating no evidence of anxiety. In the case that was an exception, the score was +2.8, indicating extreme severity (symptoms too severe to measure precisely).
Relationship to Diagnosis: Generalized Anxiety Disorder
CAT-ANX scores were strongly related to generalized anxiety disorder diagnosis (odds ratio=11.97, 95% CI=7.54–19.01, p<0.0001). The odds ratio indicates that a unit increase in CAT-ANX score (on the original underlying unit normal scale of −2.5 to 2.5) has an associated 12-fold increase in the probability of meeting criteria for generalized anxiety disorder.
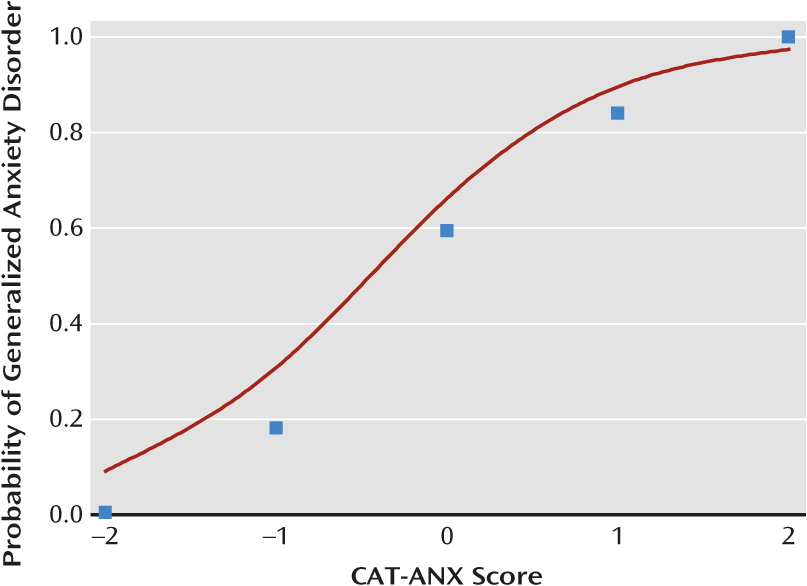
Figure 2 presents the observed and predicted proportion of generalized anxiety disorder diagnoses as a function of CAT-ANX scores. The logistic regression model provides an excellent fit to the observed generalized anxiety disorder proportions and illustrates the strong relationship between the CAT-ANX score and the likelihood of a generalized anxiety disorder diagnosis.
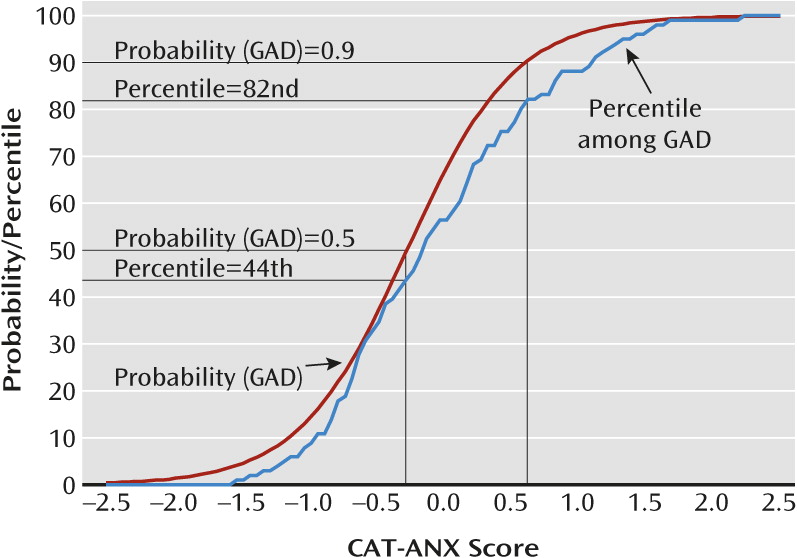
Figure 3 presents both the predicted probability of a generalized anxiety disorder diagnosis as a function of the CAT-ANX score and the percentile ranking for patients with a DSM diagnosis of generalized anxiety disorder for the range of CAT-ANX scores.
Figure 3 allows the clinician to evaluate the probability that a patient has generalized anxiety disorder as a function of CAT-ANX score and the percentile rank of an individual with a particular CAT-ANX score out of all patients with diagnostically confirmed generalized anxiety disorder.
For example, a patient with a CAT-ANX score of −0.27 has a 0.5 probability of meeting criteria for generalized anxiety disorder and would be at the 44th percentile of the distribution of CAT-ANX scores among patients meeting criteria for generalized anxiety disorder. By contrast, a patient with a CAT-ANX score of 0.63 would have a 0.90 probability of meeting criteria for generalized anxiety disorder and would be at the 82nd percentile of patients meeting criteria for generalized anxiety disorder.
Diagnostic Screening
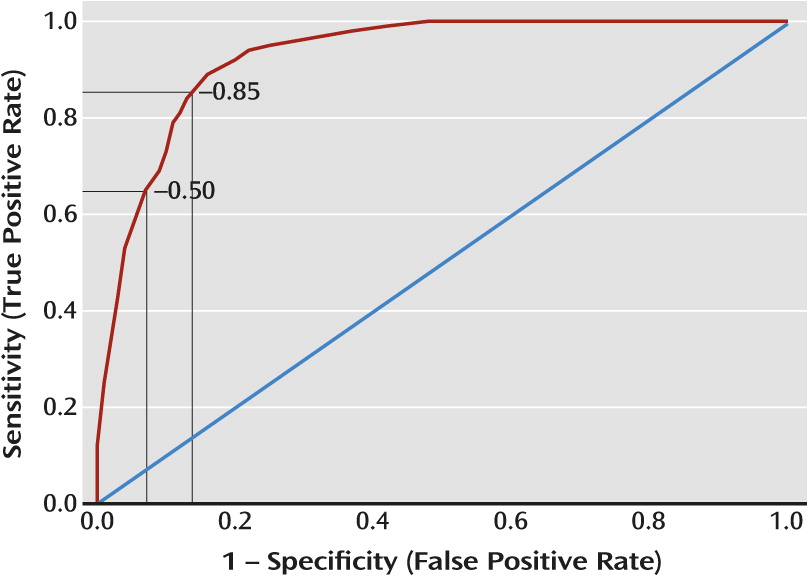
Using the nonpsychiatric comparison subjects as a comparator, the sensitivity and specificity for predicting generalized anxiety disorder are presented in the receiver operating characteristic curve in
Figure 4. Using a threshold of −0.50, the sensitivity is 0.65 and the specificity is 0.93. The test is highly specific but detects only 65% of patients with generalized anxiety disorder. Lowering the threshold to −0.85 produces a test with both a sensitivity and a specificity of 0.86 for a generalized anxiety disorder diagnosis (
Figure 4). Expanding the sample to all patients (i.e., including patients with major depressive disorder only and treatment-seeking patients who did not meet criteria for generalized anxiety disorder) provided very little change in sensitivity and specificity estimates (at a threshold of −0.5, sensitivity=0.67, specificity=0.87; at a threshold of −0.85, sensitivity=0.89, specificity=0.77). Using our adaptive test scores for both depression (CAT-DI) and anxiety (CAT-ANX) to predict major depressive disorder and/or generalized anxiety disorder in a multinomial regression model revealed an overall classification accuracy of 84.3% for the presence or absence of any diagnosis and 80.6% for the specific pattern of major depressive disorder and generalized anxiety disorder (i.e., neither disorder, generalized anxiety disorder only, major depressive disorder only, or both disorders).
Alternative Scoring Metric
The bifactor model provides scores on an underlying normal distribution that typically ranges from −2.5 to 2.5. To make the scores more intuitive, we transformed them to a 0–100 scale and empirically derived cut-points for none, mild, moderate, and severe anxiety. The thresholds were defined as the upper 90th percentile of the comparison subject distribution (transformed CAT-ANX score of 35), the 50th percentile of the distribution of patients with generalized anxiety disorder (transformed CAT-ANX score of 50), and the 75th percentile of the patients with generalized anxiety disorder (transformed CAT-ANX score of 65). As such, “no anxiety” is defined as transformed CAT-ANX scores <35, mild anxiety as scores from 35 to 50, moderate anxiety as scores >50 to 65, and severe anxiety as scores >65.
Examples of Computerized Adaptive Testing Administrations
Table 3 presents item-by-item results for two computerized adaptive testing administrations—a patient with mild anxiety and another with severe anxiety. Items are presented sequentially, where subsequent items are selected based on the answers to the previous items and the decrease in measurement uncertainty (standard error) with the addition of each item. The patient with mild anxiety required nine items to achieve a standard error <0.3 (in the original metric) and the patient with severe anxiety required 12 items. The reported scores and precision estimates are in the revised metric (the 0–100 scale). The first patient had a score of 44.0, which corresponds to a probability of 0.458 of meeting criteria for generalized anxiety disorder and a percentile of 40.6% among patients with generalized anxiety disorder. The second patient had a score of 96.8, which corresponds to a probability of 0.997 of meeting criteria for generalized anxiety disorder and a percentile of 99.0% among patients with generalized anxiety disorder.
Discussion
Results of this study reveal that the computer algorithm can extract most of the information (r=0.94) from a bank of 431 anxiety items using an average of only 12 items, requiring only slightly more than 2 minutes per subject. With an average of only eight items (SE=0.4), the correlation is still quite high (r=0.92). The paradigm shift is that rather than using a fixed number of items and allowing measurement uncertainty to vary, we fix measurement uncertainty to an acceptable level for a given application and allow the specific items administered and the number of items to vary from individual to individual. The resulting increase in measurement efficiency permits anxiety screening of large populations for epidemiologic studies and determining phenotypes for large-scale molecular genetic studies. The scientific contribution of this study lies in our demonstration that the use of computerized adaptive testing based on multidimensional item response theory generalizes to the measurement of other psychopathologic conditions beyond depression (
1).
The ability to administer the CAT-ANX in a couple of minutes over the Internet, without clinician assistance, makes routine anxiety screening of patients in primary care possible; the results of the test could be instantly transmitted directly to the medical record and discussed at the time of the patient’s visit. Combining the CAT-ANX with our previously described CAT-DI (
1) allows for assessment of both anxiety and depression and prediction of their comorbidity. We note that patients with affective disorders are particularly difficult to assess with a long scale, and the benefits of computerized adaptive testing administration are therefore particularly important for such patients.
Using a threshold of −0.5 results in a useful decision rule for generalized anxiety disorder screening that has a sensitivity of 0.65 and a specificity of 0.93. The lower sensitivity is a function of the DSM criterion for generalized anxiety disorder specifying that the symptoms had to have been present for at least 6 months. Patients with high levels of anxiety that have not yet lasted for 6 months would therefore not receive a generalized anxiety disorder diagnosis, yet would score high on the CAT-ANX. Conversely, patients with persistent anxiety that was severe 6 months ago but is mild now would have a generalized anxiety disorder diagnosis but lower current CAT-ANX scores (which pertain to the past 2 weeks only). The high specificity indicates that these levels of anxiety are rarely seen in healthy individuals. Using a lower threshold increases both sensitivity and specificity to 0.86; however, the same caveat applies with respect to the 6-month criterion, which will always provide a lack of agreement between a point-in-time (past 2 weeks) assessment and the DSM criteria for generalized anxiety disorder. Sensitivity and specificity were similar even when patients with major depressive disorder only were included. Using both the CAT-DI and CAT-ANX scores, reasonably accurate identification of generalized anxiety disorder, major depressive disorder, and their comorbidity can be determined.
While the CAT-DI and CAT-ANX were highly correlated (r=0.82), correlations were much lower for the CAT-ANX with other psychopathology measures, such as the Hamilton Depression Rating Scale (HAM-D) (r=0.50), the Patient Health Questionnaire (r=0.44), and the Center for Epidemiologic Studies Depression Scale (CES-D) (r=0.66). Note that the CAT-DI is also highly correlated with the HAM-D (r=0.75), the Patient Health Questionnaire (r=0.81), and the CES-D (r=0.84), so it is the CAT-ANX that is detecting unique aspects of anxiety that are not detected using traditional depression measurement scales. Nevertheless, the strong correlation between the CAT-DI and CAT-ANX makes it clear that anxiety and depression have much in common.
Acknowledgments
The authors acknowledge the outstanding support of R. Darrell Bock, Ph.D., at the University of Chicago (technical comments on methodology), Scott Turkin, M.D., at DuBois Community Mental Health Center (data collection), Damara Walters, M.A., at the University of Pittsburgh (patient recruitment), Suzanne Lawrence, M.A., at the University of Pittsburgh (diagnostic assessments), and Victoria Grochocinski, Ph.D., at the University of Pittsburgh (database administration).
