The optimum approach to evaluate whether the neuroanatomy of ASD fits a continuum in the general population involves three steps. The first step is to show a relationship between autistic symptoms along a continuum and neuroanatomy in the population. The second step is to show that those with high levels of autistic traits or ASD exhibit the same neuroanatomical findings as those in the whole population. Finally, the third step is to assess whether the relationship between autistic symptoms and neuroanatomy remains after removing those with the highest level of autistic symptoms. While there have been a number of studies that have assessed one or two of the above steps, no study to our knowledge to date has combined all three components in the same study.
There have been no studies that have evaluated brain morphology of autistic traits in population-based samples. However, there are numerous studies evaluating the neuroanatomy of children with clinical ASD compared with comparison subjects (
2), although these studies have yielded mixed findings (e.g., both thicker and thinner cortex, as well as increased or decreased surface complexity). Despite this variability, replicated results include thicker cortex in younger children (between 1.5–8 years old), supporting the hypothesis of early brain overgrowth. In some studies, thicker cortex was found in the frontal (
3,
4) and temporal regions (
4,
5), although no differences were reported in other studies (
6). Studies in older children (≥12 years old) have found thinner temporal, parietal, and occipital cortices in individuals with ASD (
7–
9). More recently, studies of gyrification in children and adolescents with ASD have also yielded contradictory results, reporting higher gyrification in the bilateral posterior (
10), left inferior (
11), and right parietal cortices (
12) but also lower gyrification in the right frontal cortex (
13) or no difference in gyrification (
14).
Thus, the goal of the present study was to perform all three steps (listed above as the optimum approach) in the same study and to assess whether differences in cortical morphology are related to the variation in autistic symptoms observed in the general pediatric population. Based on previous literature, we have centered our analyses around two features of cortical morphology that have shown differences in clinical samples of children with ASD, namely gyrification and cortical thickness. In line with studies in school-aged children, we hypothesized that a higher load of autistic traits would reveal a thicker cortex, particularly in the frontal and temporal lobes, and less gyrification in the frontal regions. Furthermore, we hypothesized that these findings would be present 1) along a continuum in the entire cohort, 2) in children with the highest level of autistic symptoms, and 3) after excluding children with the highest level of autistic symptoms.
Results
Sample Characteristics
Child and maternal characteristics are presented in
Table 1. Boys had somewhat higher Social Responsiveness Scale scores (mean difference=0.06, t=2.96, df=715, p=0.003) and more attention problems (mean difference=0.70, t=4.63, df=702, p=0.000004). Characteristics of the excluded sample are presented in Table S1 in the online
data supplement. Children who were excluded from the final sample were more likely to be of non-Dutch origin (χ
2=44.88, df=2, p=1.79×10
–10); N=1,070) and had somewhat higher Child Behavior Checklist attention problems scores (mean difference=−0.50, t=–3.23, df=975, p=0.001), slightly lower nonverbal IQ (mean difference=−0.07, t=3.61, df=980, p=0.0003), and (if excluded for reasons other than missing information on autistic traits) somewhat higher Social Responsiveness Scale scores (mean difference=−0.07, t=–2.09, df=856, p=0.04). Mothers of excluded children were more likely to have less education (χ
2=14.32, df=2, p=0.001; N=971) and less income (χ
2=44.59, df=2, p=2.08×10
–10; N=937).
Gyrification
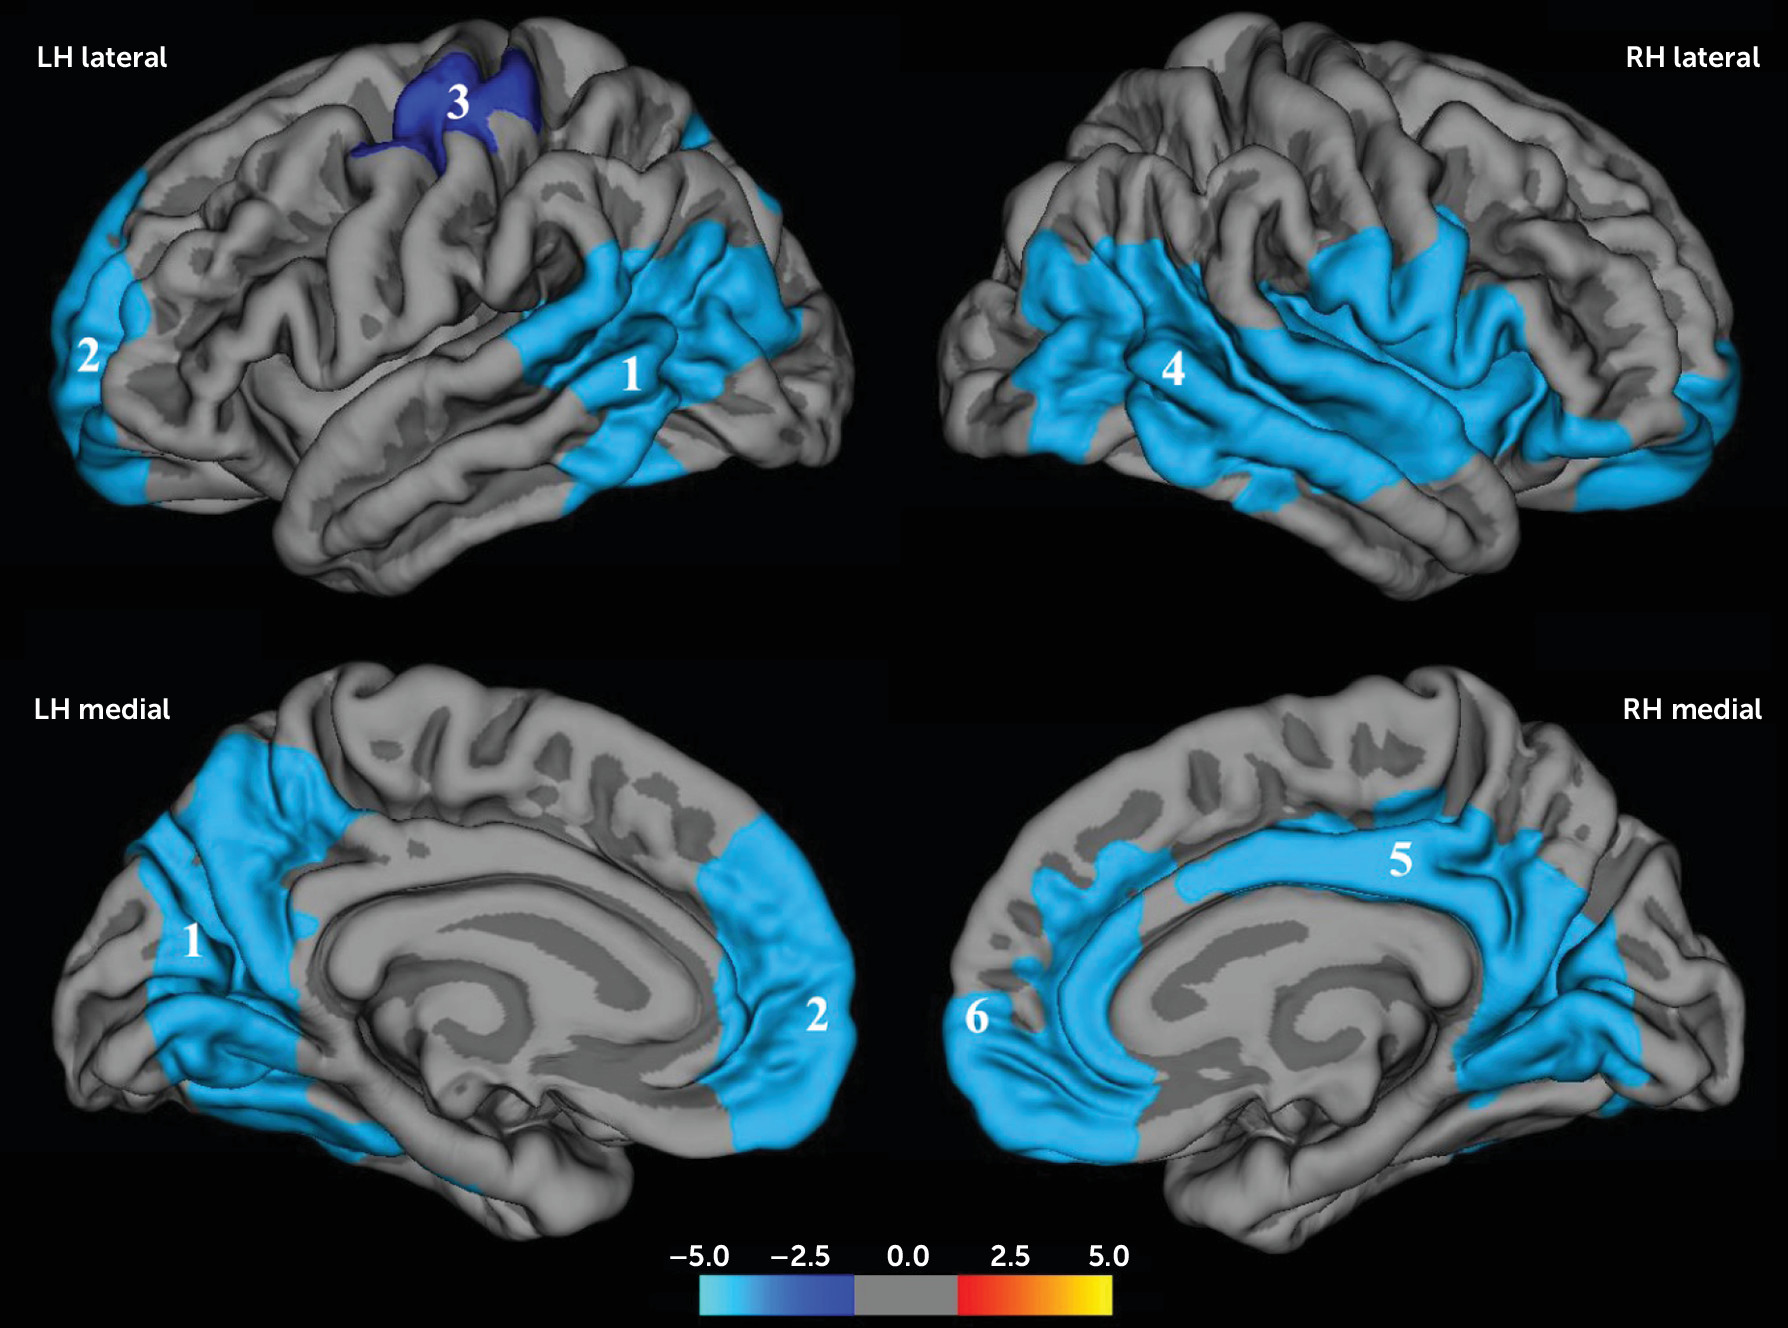
Six regions in the brain showed significant negative correlations between Social Responsiveness Scale scores and gyrification (
Table 2,
Figure 1), three in each hemisphere.
In the left hemisphere, the first cluster (LH1) included the posterior temporal cortex, covering portions of the superior, middle, and inferior temporal cortices, as well as the inferior parietal cortex and supramarginal gyrus. This cluster extended medially to include the precuneus, cuneus, pericalcarine, lingual cortex, and fusiform gyrus (p=0.0001).
The second cluster (LH2) included the rostral middle frontal cortex and extended into the superior frontal, medial orbitofrontal, and rostral anterior cingulate cortices (p=0.0001). The third cluster (LH3) covered part of the central sulcus and pre- and postcentral gyri (p=0.03).
In the right hemisphere, cluster RH4 included a large part of the temporal lobe extending posteriorly into the inferior parietal cortex and supramarginal gyrus and anteriorly to the insula, supramarginal gyrus, and pre- and postcentral gyri (p=0.0001). Cluster RH5 included part of the posterior cingulate cortex and extended posteriorly to the precuneus and caudally to the lingual gyrus (p=0.0001). Cluster RH6 included the superior frontal cortex and the medial orbital frontal and anterior cingulate cortex.
The association remained in all but two clusters (LH3 and RH6), after adjusting for confounding factors (
Table 3). The significant findings remained after additionally correcting for total brain volume (see Table S2 in the online
data supplement). Plots of the age-residualized gyrification indices against quintiles of Social Responsiveness Scale scores are presented in Figure S2 in the
data supplement. Adding a quadratic term did not significantly improve the model in any of the gyrification clusters.
There was no gender-by-gyrification interaction, and gender-stratified analysis revealed similar patterns of decreased gyrification (see Figure S3 in the data supplement). In children with a delay of less than 1 year between administration of the Social Responsiveness Scale and the MRI scan (N=179), the direction of the effect was similar.
Case-Control Analyses
To assess differences in gyrification between children with a diagnosis of ASD and control subjects, we performed independent t tests for the six boys in our sample with a confirmed diagnosis (measured using Autism Diagnostic Interview–Revised/Autism Diagnostic Observation Schedule criteria) compared with a group of age- and gender-matched control subjects. In general, children with ASD had lower gyrification indices, although this difference did not reach statistical significance (see Table S3 in the data supplement).
Analyses Without Children With the Highest Levels of Autistic Traits and ASD
Next, we explored whether these associations also held excluding children with high levels of autistic traits. We excluded the six boys who met criteria for ASD as measured by either the Autism Diagnostic Interview–Revised or the Autism Diagnostic Observation Schedule. Furthermore, boys with weighted Social Responsiveness Scale scores >1.078 and girls with scores >1.000 were excluded, in line with cutoffs recommended for screening in population-based settings (
20). This resulted in a sample of 695 children. The results show effect sizes similar to those in the full sample (
Table 4). After correcting for covariates, the relation between less gyrification and more autistic traits remained significant in the left hemisphere temporal/precuneus cluster (LH1), and a nearly significant relation remained in the left hemisphere frontal cluster (LH2).
Specificity Analyses
To explore the specificity of our results, we repeated the analyses with two other subscales of the Child Behavior Checklist as predictors (aggression and anxiety/depression). This was in addition to attention problems and nonverbal IQ, which were included as covariates in the main analysis. This yielded very small effect sizes that became insignificant after correcting for confounders.
Cortical Thickness
For the total sample, including both genders (N=717), we found no areas where thickness correlated with autistic traits and no gender interaction.
In boys only (N=373), thicker cortex in the pericalcarine area was related to more autistic traits (p=0.01) (see Figure S4 in the data supplement). In girls (N=344), no areas correlated with autistic traits.
Additional Measures
No relation was found between autistic traits and the global hemispheric means of cortical thickness, surface area, and gyrification (
Table 5). In addition, there were no associations between autistic traits and volumes of subcortical nuclei. While cortical thickness and gyrification were the main outcomes of interest, several other measures were explored, including cortical volume, sulcal depth, and surface area. Larger volume in the bilateral pericalcarine region was related to more autistic traits (see Figure S5 in the
data supplement). Similarly, decreased sulcal depth in the posterior part of the right superior temporal sulcus was associated with more autistic traits (see Figure S6 in the
data supplement). For surface area, no differences were found.
Discussion
There is emerging evidence that autistic traits fall on a continuum within the general population (
1). If this is the case, then it is likely that the neuroanatomy of autistic traits also falls along a continuum within the general population. Thus, the primary goal of the present study was to evaluate the relationship between autistic traits and structural brain measures in a large population-based study of school-aged children. We studied whether neurobiological findings of autistic traits are present along a continuum in a population using a three-step approach, which involved 1) showing that a significant linear relationship exists between the autistic traits and the neurobiologic measurement and that a nonlinear relationship does not provide a significantly better fit, 2) performing a case-control evaluation of children with ASD to show that the findings are present in the case subjects with diagnosed ASD compared with control subjects, and 3) excluding individuals with ASD or the highest autistic symptoms to assess whether the linear relationship remains.
Evaluating brain morphology across a continuum of autistic traits, we found that school-aged children show a widespread decrease in cortical gyrification with increasing autistic traits. In some regions, this relationship appeared to be driven by those with more autistic symptoms, suggesting that for these regions a cutoff effect may be applicable. However, there was a strong linear relationship in regions involving the left hemisphere temporal/precuneus area that remained after excluding children with the highest levels of autistic traits and confirmed ASD. Finally, we found less gyrification with more autistic traits and a comparable, although nonsignificant, effect when comparing a small sample of confirmed ASD cases with age- and gender-matched control subjects. Taken together, these findings provide supportive evidence for the existence of a continuum, at least for some regions, in the neurobiology of autistic traits in children.
While other studies of gyrification in ASD have not had the goal of evaluating whether traits are continuous in the population, they have evaluated gyrification abnormalities in ASD. Studies have found both decreased (
13) and increased (
10,
12) gyrification in clinical cohorts with ASD. In a case-control study of ASD in 11 children aged 9–17 years (male subjects, N=8), compared with matched typically developing control subjects, Schaer et al. (
13) found decreased gyrification in frontal brain regions. However, using the same technique, Wallace et al. (
10) reported regions of increased gyrification in an all-male case-control study of ASD (ages 12–23 years old). The differences in the age and gender constellations of these studies could be responsible for the discrepancy in the findings. However, this is less intuitive because gyrification peaks early in childhood and, parallel with cortical pruning, decreases over time (
25,
26). Thus, factors such as heterogeneity in the features of ASD, small sample size, or sample selection differences could be responsible for these differences. Interestingly though, when Wallace et al. performed a subanalysis that included only the typically developing subjects, they found negative correlations between autistic traits and gyrification in a region showing marked overlap with our finding in the right superior temporal lobe.
Gyrification is a poorly understood phenomenon that is thought to accommodate efficient neural processing in the brain (
27). Decreased gyrification could point to disruptions in fetal development, since the majority of gyrification takes place in the third trimester, at a time when the brain undergoes prolific growth. However, the many primary sulci are formed before then, between 20 and 28 weeks of gestational age (
28). Following Van Essen’s model (
27), decreased gyrification could reflect decreased short-range connectivity of the neurons within specific regions. Indeed, Schaer et al. found decreased gyrification in ASD to be related to decreased connectivity in the same regions (
13).
In our study, decreased gyrification was not associated with decreased surface area. This decoupling of various aspects of the cortex is puzzling but consistent with at least one other study of ASD (
10) and could potentially be understood by the fact that both features derive from distinct stages in gestation and that different aspects of the cortex are regulated by different genetic mechanisms (
29). A disruption within a particular developmental window may interfere with the development of one feature, while leaving another preserved.
While we found widespread regions of decreased gyrification, specific brain regions were more affected. Interestingly, the regions we found are functionally associated with capacities that are impaired in ASD. The frontal and posterior cingulate cortices both form components of the default mode network, a resting state functional brain network thought to be involved in self-reflection (
30). Additionally, the anterior cingulate cortex, the temporal lobes, and the superior temporal sulcus have been related to “theory of mind” (
31). The superior temporal sulcus, in which we found less gyrification and decreased sulcal depth, is recognized as a structure crucial to perception and processing of language and auditory stimuli, specifically social stimuli (both visual and auditory) (
32). Previous research has shown decreased gray matter (
9,
33) and white matter (
34) volumes and abnormal activation of the superior temporal region in ASD (
32).
We found larger volume and thicker cortex in the pericalcarine region, a region that is among the first to reach peak cortical thickness (
35), around age 7 years, which falls within the age range in our study. Thicker occipital cortex has been found in school-aged children with ASD (
8) and is in line with the early brain overgrowth hypothesis. Furthermore, magnetic resonance spectroscopy has revealed diminished levels of creatine (
36). Thicker cortex in the pericalcarine area was exclusively found in boys, which potentially reflects gender specificity in brain development in children with autistic traits. Since female subjects are generally underrepresented in clinical ASD samples, because of the low prevalence in the female population, it is possible that some findings arising from previous studies of cortical thickness are in fact driven by the male subjects only. However, the regions where we found decreased gyrification were mostly overlapping across genders, in line with work that suggests similar brain differences in men and women with ASD (
37).
Our study has a number of strengths. First, we imaged children from a large population-based cohort with autistic traits across a broad spectrum. This provides the unique opportunity to test whether the underlying neurobiology of autistic traits extends into the general population. In addition, considerable information is available on potential confounding factors. Although autistic traits frequently co-occur with attention problems and lower IQ (
38), the brain correlates described here are specifically related to autistic traits independent of IQ and attention problems. Furthermore, our results were independent of symptoms of aggression, anxiety, and depression.
There are also several limitations to the study. First, the measurements of autistic traits and cortical morphology were not contemporaneous. However, autistic traits are relatively stable over time (
39), and a sensitivity analysis only including children with a short delay between the two measurements yielded similar results. Second, because the MRI data were assessed cross-sectionally, we cannot study longitudinal trajectories of brain development associated with autistic traits. Third, while we corrected for multiple testing within each surface-based analysis, we did not perform additional correction for the different surface-based analyses. Fourth, the Autism Diagnostic Observation Schedule/Autism Diagnostic Interview–Revised assessments were not available for all participants. In our sample, six boys met criteria for ASD based on these instruments, but it is possible that we would have identified more cases of ASD had we been able to perform in-depth assessments of all participants. Since this is a small group, a cautious interpretation of these findings is warranted. Fifth, there is a potential for selection effects, since children who were excluded differed from the sample on socioeconomic factors and problem scores. Thus, it is possible that our results are not representative of the general population, although we are likely missing the children with more severe autistic symptoms. Finally, in interpreting data from a data-driven analysis, there is a risk of reverse inference. However, the regions we found have been consistently and specifically associated with ASD in the literature.
In conclusion, we found differences in cortical morphology to be related to autistic traits in a large population-based sample of school-aged children. Our findings lend support to an extension of the neurobiology of autistic traits to the general population.


