Abstract

Objective:

Despite the multitude of longitudinal neuroimaging studies that have been published, a basic question on the progressive brain loss in schizophrenia remains unaddressed: Does it reflect accelerated aging of the brain, or is it caused by a fundamentally different process? The authors used support vector regression, a supervised machine learning technique, to address this question.

Method:

In a longitudinal sample of 341 schizophrenia patients and 386 healthy subjects with one or more structural MRI scans (1,197 in total), machine learning algorithms were used to build models to predict the age of the brain and the presence of schizophrenia (“schizophrenia score”), based on the gray matter density maps. Age at baseline ranged from 16 to 67 years, and follow-up scans were acquired between 1 and 13 years after the baseline scan. Differences between brain age and chronological age (“brain age gap”) and between schizophrenia score and healthy reference score (“schizophrenia gap”) were calculated. Accelerated brain aging was calculated from changes in brain age gap between two consecutive measurements. The age prediction model was validated in an independent sample.

Results:

In schizophrenia patients, brain age was significantly greater than chronological age at baseline (+3.36 years) and progressively increased during follow-up (+1.24 years in addition to the baseline gap). The acceleration of brain aging was not constant: it decreased from 2.5 years/year just after illness onset to about the normal rate (1 year/year) approximately 5 years after illness onset. The schizophrenia gap also increased during follow-up, but more pronounced variability in brain abnormalities at follow-up rendered this increase nonsignificant.

Conclusions:

The progressive brain loss in schizophrenia appears to reflect two different processes: one relatively homogeneous, reflecting accelerated aging of the brain and related to various measures of outcome, and a more variable one, possibly reflecting individual variation and medication use. Differentiating between these two processes may not only elucidate the various factors influencing brain loss in schizophrenia, but also assist in individualizing treatment.
Cross-sectional MRI studies have convincingly shown that brain volumes in schizophrenia patients are smaller than those in healthy subjects. Some of these abnormalities, such as changes in white matter volume and structure, are present before illness onset (1, 2) and are most likely of a developmental (3), possibly genetic (4), nature and appear to be stable over time (5). In contrast, other brain changes, such as reductions in gray matter volume, become more pronounced during the course of the illness (6). Although several studies suggest that gray matter volume reductions are related to outcome (7), psychosis (8), relapses (9), medication (10), cannabis use (11), and genetic liability (12), the cause and nature of the progressive loss of gray matter are still unclear.
Indeed, despite the multitude of longitudinal neuroimaging studies, a basic question on the progressive brain loss in schizophrenia remains unaddressed: Does it reflect accelerated aging of the brain, or is it caused by a fundamentally different process? Here, we address this question by using a relatively new technique, support vector regression (13), a supervised machine learning technique used to make predictions based on high-dimensional (image) data. A model can be trained to recognize patterns in brain tissue that are associated with aging. Using these patterns, the model then transforms, or aggregates, the high-dimensional image data of each individual into a predicted age, or brain age. Comparable techniques have successfully been applied to MRI scans leading to age predictions in adults (14) and across the lifespan (15), as well as development/maturation indices in children and young adults (1619). The advantage of such techniques over univariate analyses is that they detect and use the coherence between voxels involved in aging and are capable of dealing with the large variation in brain structures between subjects.
The aging of the brain in schizophrenia patients, as estimated from their brain images, was found to be increased compared with the chronological age of the brain (20). On average, this “brain age gap” estimate (14) was 5.5 years. The results of such cross-sectional studies support the use of machine learning to study brain development in schizophrenia across the lifespan. However, longitudinal studies are required to capture the dynamic aspects of aging, truly measuring (abnormal) accelerations or decelerations in the aging of the brain.
To investigate whether the brains of schizophrenia patients age in an accelerated fashion, we measured brain age in a large longitudinal sample of healthy subjects and schizophrenia patients. An age prediction model was trained on the healthy subjects’ baseline image data. It was subsequently applied to the follow-up scans of the healthy subjects and the baseline and follow-up scans of the patients. Brain age gaps and accelerations were calculated and, for patients, related to duration of illness. In addition, a model separating schizophrenia patients from healthy subjects was built. Using these models, we were able to separate the effects of normal aging on the brain and those specific to schizophrenia.

Method

Samples

The subjects in this study were obtained from three samples that have been described earlier. We included schizophrenia patients and healthy comparison subjects from two independent samples, both recruited to participate in a longitudinal MRI study (sample 1 [2123]; sample 2 [24, 25]). In addition, healthy comparison subjects from a study of bipolar disorder were included (sample 3 [26]). The baseline scans of samples 1 and 2 have been used for classification of schizophrenia (27). For details on inclusion criteria and imaging and study design, see Figure 1 and the supplemental Methods section in the online data supplement that accompanies the online edition of this article.
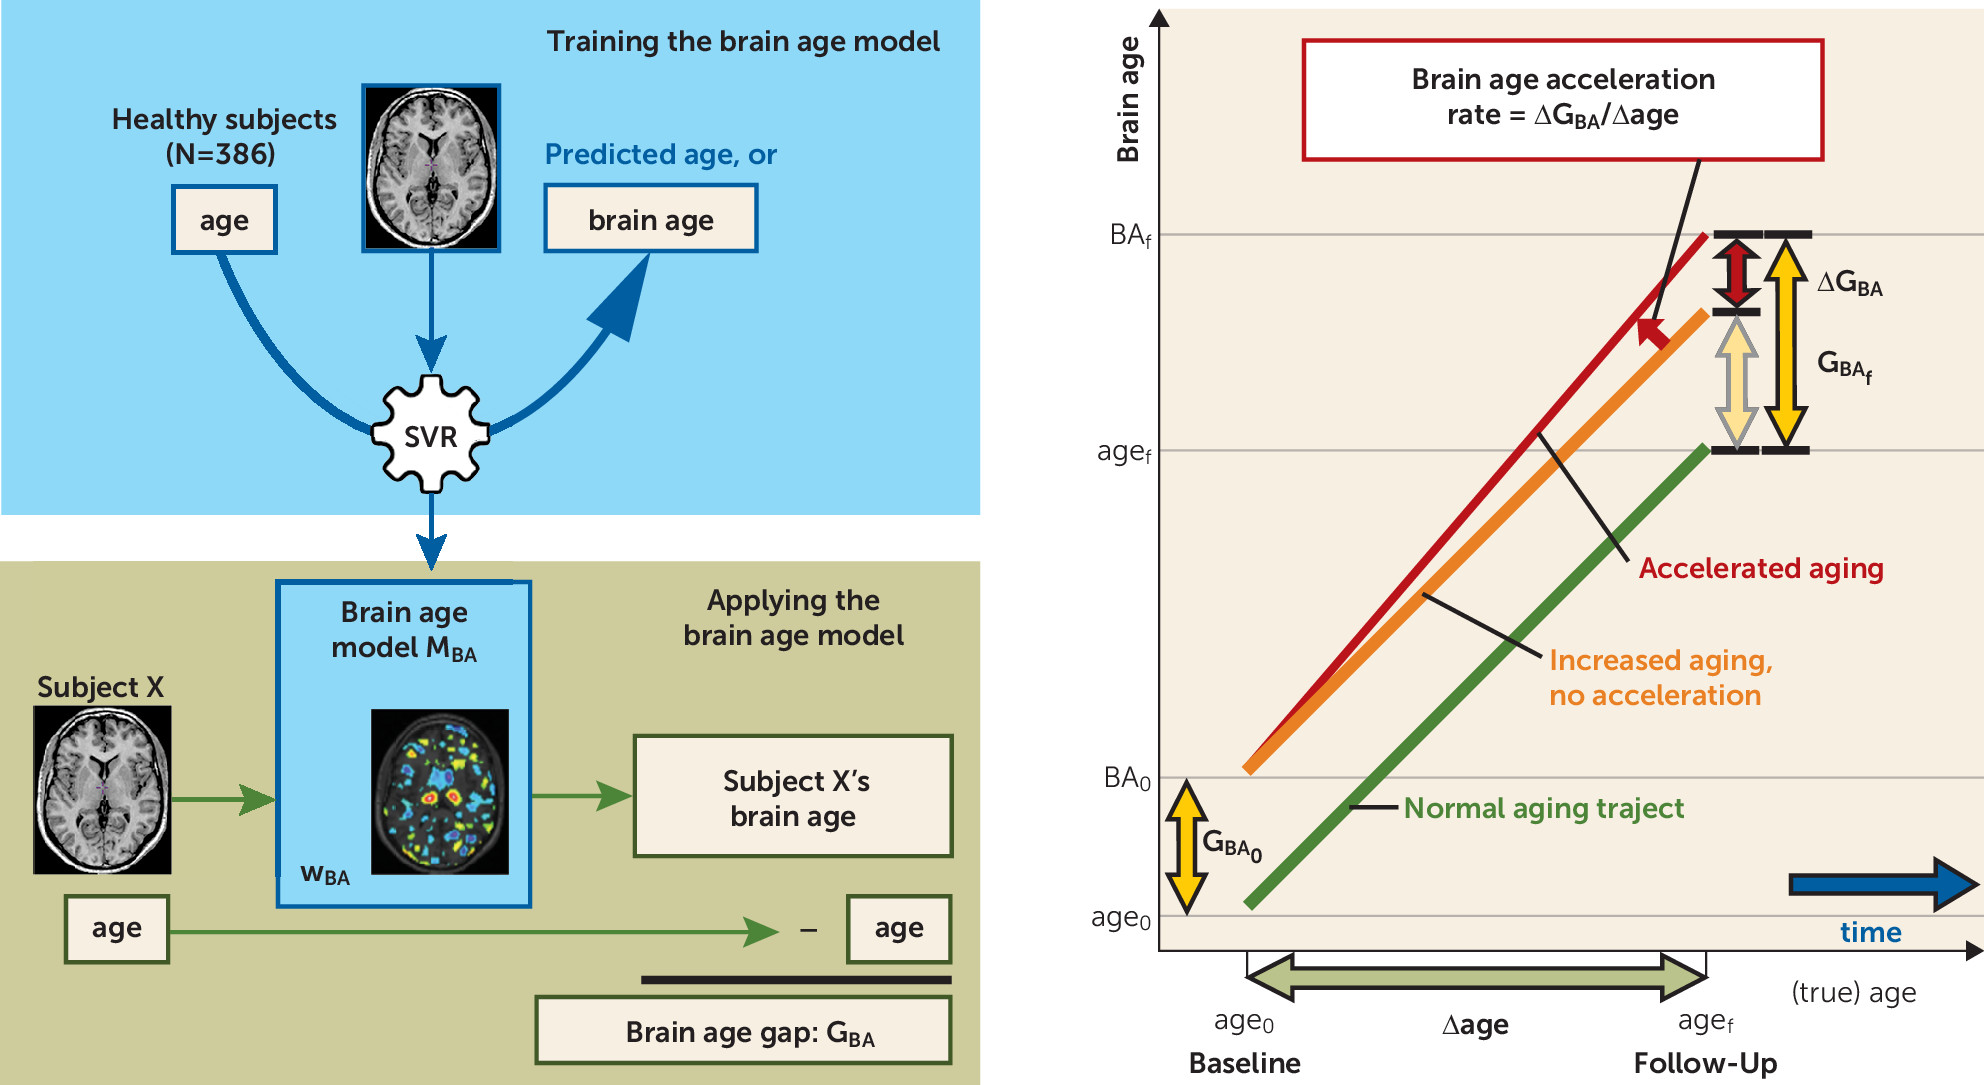
FIGURE 1. Schematic of the Support Vector Regression Machine and the Longitudinal Modela
a The support vector regression (SVR) machine was trained on the baseline images of all healthy subjects to predict age from the gray matter density images (top left panel), resulting in the brain age model MBA. This model can be applied to any (new) subject’s gray matter density image to predict (brain) age (bottom left panel); wBA represents the model's weight vector. The difference between brain age (BA) and chronological age is the brain age gap (GBA). The panel on the right shows brain age in a longitudinal design. The horizontal axis represents true age, and the vertical axis brain age. Age and brain age (BA) of a subject are shown at baseline (subscript 0) and follow-up (subscript f). Normal aging, increased but stable (no acceleration) brain age, and increased and accelerated brain aging are shown. The brain age acceleration rate is the ratio of the change in brain age gap (ΔGBA) and the change in age (Δage) between baseline and follow-up measurements.
The total sample consisted of 727 subjects: 341 schizophrenia patients and 386 healthy subjects. A baseline scan was acquired for each subject. From 378 subjects, one or more follow-up scans were acquired after 1–13 years, amounting to 1,197 scans in total. The age range at baseline was 16–67 years (Table 1). All T1-weighted images were acquired on a 1.5-T Philips scanner and had a resolution of 1×1×1.2 mm3. Images were preprocessed using our image-processing pipeline (21, 28), resulting in gray matter density images in a standardized space (21) for all subjects. In these images, the voxel values reflect the amount of gray matter tissue present at that location on a scale from 0 to 1 (for details, see reference 27).
TABLE 1. Demographic and Clinical Characteristics of Schizophrenia Patients and Healthy Comparison Subjects in an MRI Study of Brain Aging in Schizophrenia
CharacteristicSchizophrenia PatientsaHealthy Comparison Subjects
 N%N%
Baseline scan341100386100
Follow-up scans    
 11925618648
 26318113
 3124  
 462  
First episode (<1 year ill at baseline)b5223  
Baseline medication status    
 On atypical antipsychoticsc20862  
 On conventional antipsychoticsc10130  
 Medication naivec3711  
 MeanSDMeanSD
Age at baseline (all subjects) (years)29.509.9634.0711.81
Age at baseline (subjects with follow-up scans) (years)28.138.9532.1012.40
Age at first follow-up (years)31.619.5835.9812.99
Interval from baseline to first follow-up (years)3.481.623.841.44
PANSS scores at baseline    
 Positive scaled15.875.77  
 Negative scaled17.075.74  
 General psychopathology scalee33.379.45  
 Total scoree65.7717.25  
GAF score at baselinef50.4817.51  
PANSS scores at first follow-up    
 Positive scaleg12.344.62  
 Negative scaleg13.566.00  
 General psychopathology scaleh26.147.68  
 Total scoreh51.9915.61  
GAF score at first follow-upi54.5217.38  
Illness durationj (years)4.213.73  
During interscan interval    
 Number of hospitalizationsk1.061.63  
 Cumulative duration of hospitalizationl (days)174381  
 Antipsychotic daily dosage at follow-up (chlorpromazine equivalents)m349.6181.7  
 Cumulative antipsychotic daily dosage (chlorpromazine equivalents)n2,511.51,106.0  
a
Percentages are based on the number of baseline scans.
b
Information available for 230 subjects.
c
Information available for 335 subjects.
d
Information available for 210 subjects.
e
Information available for 202 subjects.
f
 Information available for 110 subjects.
g
 Information available for 146 subjects.
h
Information available for 145 subjects.
i
 Information available for 118 subjects.
j
 Information available for 230 subjects.
k
 Information available for 130 subjects.
l
 Information available for 129 subjects.
m
 Information available for 94 subjects.
n
 Information available for 69 subjects.

Validation and Reliability

The validity of the age prediction model was tested in an independent sample of 55 healthy subjects and 60 schizophrenia patients (ages 19–48 years) scanned at 3 T with a resolution of 0.75×0.75×0.80 mm3 (29). A fifth sample (30), consisting of five healthy volunteers (ages 25–35 years) who were scanned twice within 12 days, was used to test the scan-rescan reliability of the age prediction model.

Algorithms

Multivariate pattern recognition techniques are capable of transforming high-dimensional image data into single outcome values (y) such as class (binary) or age (continuous). The data, in our case gray matter density images, are represented by a feature vector, x. We used two machine learning algorithms: the support vector machine (31, 32) and support vector regression machine (13, 32). Both algorithms are supervised learning techniques that include two phases. During the training phase, the support vector or support vector regression machine is trained on labeled data (x), resulting in a prediction model (M). During the test phase, the model is applied to unlabeled (new) data: y=M(x). ν-Support vector regression was used for age prediction. The support vector machine was used for binary classification, that is, separating schizophrenia patients and healthy subjects. Optimal parameter settings for the latter were taken from Nieuwenhuis et al. (27) and from a grid search for the age prediction (see the online data supplement).

Brain Age Model

The baseline images of all 386 healthy subjects were used to train a support vector regression machine to predict a subject’s age from the gray matter density image. The resulting model, MBA, consisted of a weight map, wBA, containing each voxel’s weight for the prediction of age. Positive or negative weights indicate that higher or lower gray matter density, respectively, contributes to predicting a greater age. The performance of MBA was assessed in this set using leave-one-out cross-validation, by calculating the amount of chronological age variance explained by the model (R2) and the mean absolute error between predicted and chronological age. In addition, the validity and reliability of the brain age model was assessed by applying MBA to 3-T scans (in sample 4) and repeated scans within a very short interval (in sample 5).
The predicted age will be called brain age, and its deviation from the chronological age, brain age gap (GBA [14, 20]) (Figure 1). GBA reflects whether a subject’s brain appears older or younger than expected from its chronological age. The MBA model was subsequently applied to all schizophrenia baseline images and to all healthy and schizophrenia follow-up images. A subject’s age at baseline and at follow-up was predicted by applying a cross-validation version of MBA that had been built without that subject’s baseline scan. In this way, bias in the age estimations was avoided. Brain age gaps for the schizophrenia patients were calculated and compared with those of the healthy subjects using t statistics at baseline and follow-up. Changes in brain age gap (ΔGBA) from baseline to follow-up were compared between patients and healthy subjects (for details, see the online data supplement).
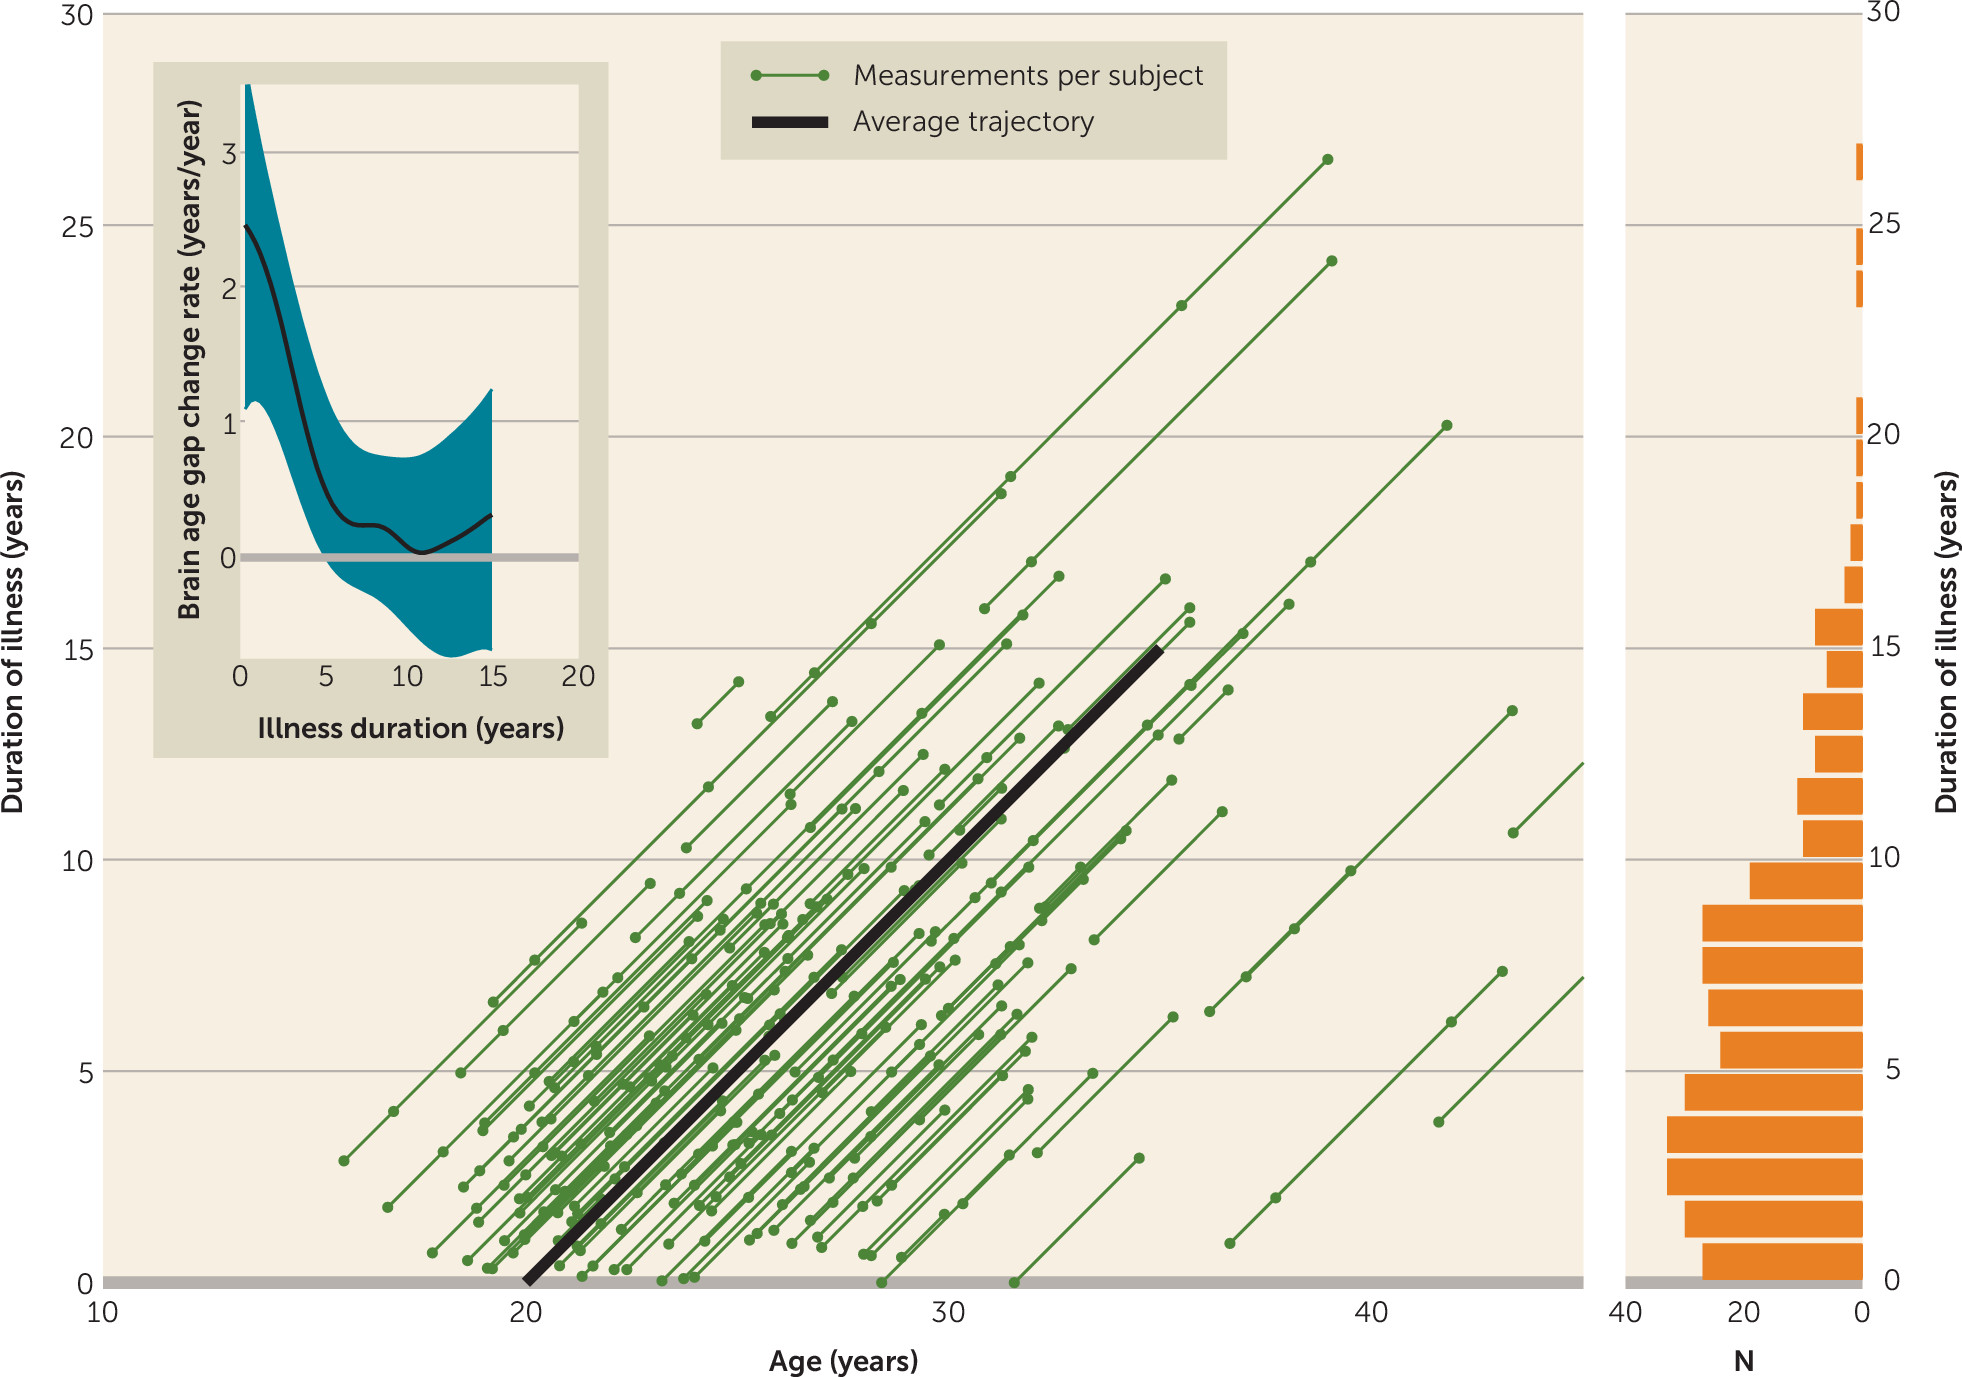
All scans (N=340) from the patients for whom duration of illness was available were used to analyze the relationship between age, duration of illness, and change in brain age gap (Figure 2). The rates of change in brain age gap (ΔGBA/Δage) along the individual trajectories between two measurements were used in a locally weighted regression analysis (27). This yielded an “average” rate of change in brain age gap along the course of an “average” patient, from 0 years of illness at age 20 to 15 years of illness at age 35 (thick line in Figure 2).
FIGURE 2. Individual Trajectories of Age and Duration of Illness for All Schizophrenia Patients in the Samplea
a The number of scans (represented by dots along the trajectory lines) per subject varies between 2 and 5; their distribution with respect to duration of illness is shown in the bar graph on the right-hand side. The thick line indicates the “average” trajectory, reflecting a patient with a start of illness at age 20. A locally weighted regression of rate of change in brain age gap (ΔGBA/Δage) was carried out along this trajectory, with Gaussian kernel widths of 3 years for age and 2 years for duration of illness, yielding the “average” rate of change of the brain age gap, represented by the line in the inset, with blue bands showing 95% confidence intervals.

Model Separating Schizophrenia Patients and Healthy Subjects

The 541 baseline images (267 healthy subjects and 274 schizophrenia patients) from samples 1 and 2 were used to train a support vector machine model predicting patient status (ySZ=1: schizophrenia, ySZ=−1: healthy) of patients and healthy subjects, based on their gray matter density images corrected for brain age (27, 33). The weight map (wSZ) of the resulting model, MSZ, contained each voxel’s weight, with positive or negative weights indicating that higher or lower gray matter density, respectively, contributes to being classified as patient. Using cross-validation, the percentage of correctly classified subjects was used to assess the model’s performance. The model was subsequently applied to all healthy and schizophrenia follow-up images.

Schizophrenia Gap, Brain Age, and Schizophrenia Fingerprints

In analogy to the brain age gap, we define the schizophrenia gap (GSZ) to reflect the difference between an individual’s schizophrenia prediction score (ySZ) and the average healthy comparison score. Using the brain age (schizophrenia) weight map, each subject’s gray matter density pattern can be decomposed into a part coinciding with it—the brain age (schizophrenia) fingerprint—and a remaining part. An individual’s GBA and GSZ are reflections of the size of the respective fingerprints, which allow comparisons between them in terms of gray matter density, as well as the building of classification models on their combination (for details, see the online data supplement).

Significance of the Weight Maps

Ten thousand models were built using permuted ages (brain age) or labels (schizophrenia). This resulted in a null distribution of weights against which the weights of the real models (MBA, MSZ) were tested to find the voxel-wise significance of the weight maps. Although analytical solutions exist for support vector machines (34), the lack of such a method for support vector regression led us to use this bootstrap method for both models (35).

Relationship With Clinical Parameters

Associations between changes in brain age and schizophrenia gaps and Positive and Negative Syndrome Scale (PANSS) total scores and Global Assessment of Functioning Scale (GAF) scores at baseline and follow-up, and number and cumulative duration of hospitalizations and cumulative antipsychotic daily dosage during the interscan interval and daily dosage at follow-up were calculated. We applied a Bonferroni correction for multiple comparisons to test the significance of the associations.

Results

Brain Age Model: Accuracy, Validity, and Reliability

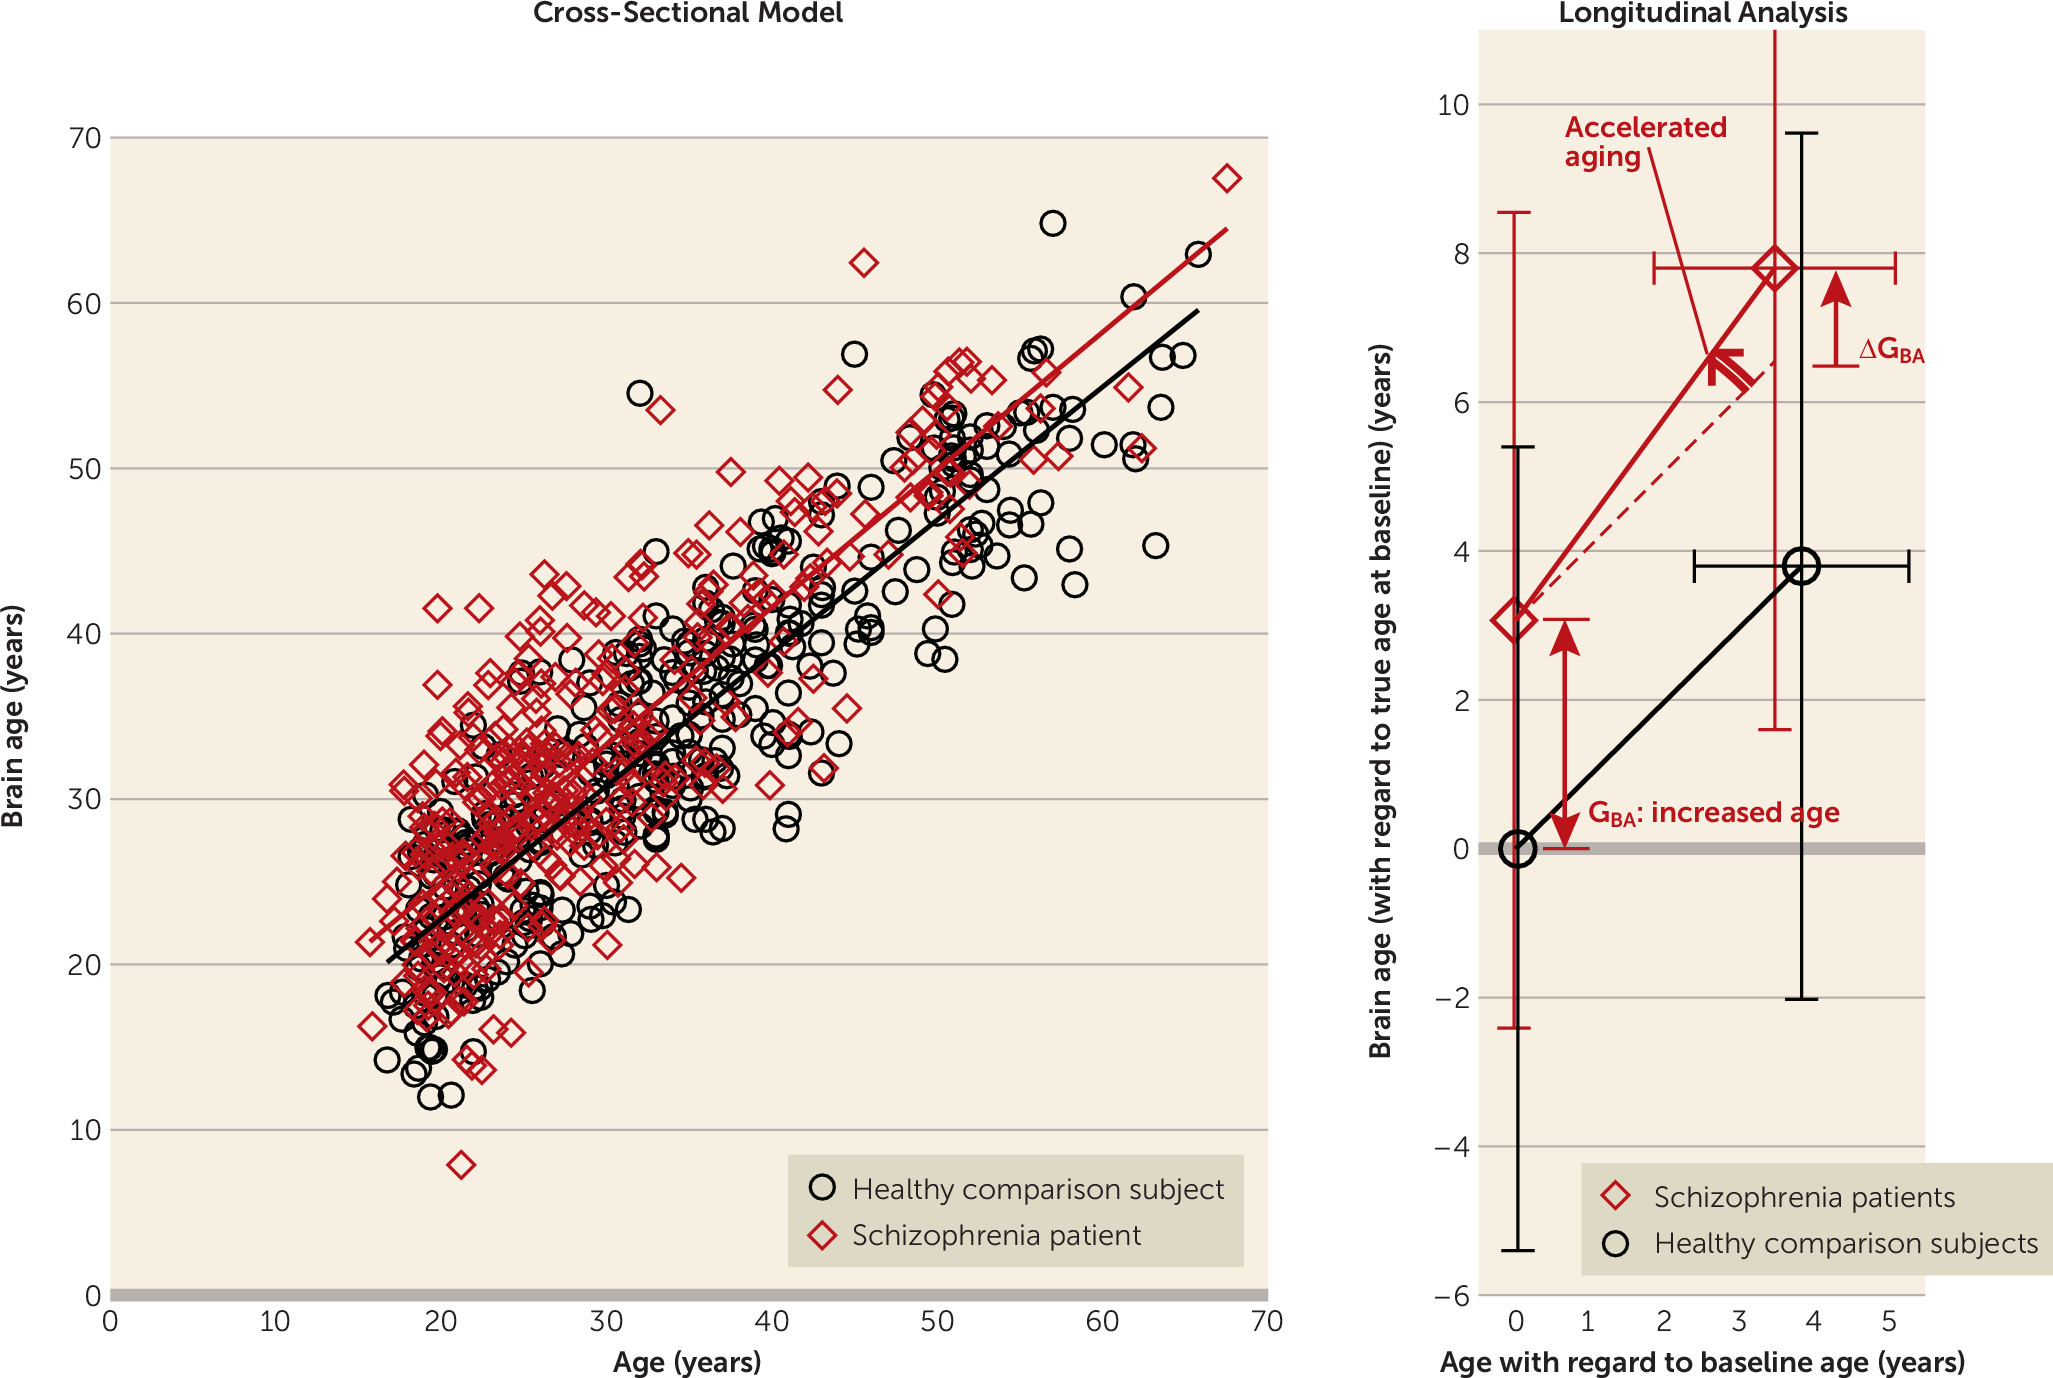
The brain age model explained almost 80% of the baseline age variance (R2=0.79) in healthy subjects. The mean absolute error was 4.31 years. These values are comparable to earlier models (4.98 years (14); 4.6 years (20), R2=0.83) (Figure 3).
FIGURE 3. Brain Age Versus Chronological Age at Baseline and From Baseline to Follow-Upa
a The cross-sectional model (left) was built from the baseline scans of the sample of healthy subjects (N=386). Each healthy subject’s brain age was predicted by applying the version of the model with that subject’s scan left out. Each schizophrenia patient’s brain age was predicted by applying the full model to his or her baseline scan (N=351). In the longitudinal analysis (right), the brain age gap at baseline (GBA) and acceleration during follow-up (ΔGBA/Δage) are indicated by arrows; the dashed line is the reference line for unaccelerated aging. At follow-up (on average 3.48 years later [SD=1.62]), the brain age of the patients had progressively increased by 4.72 years (SD=4.14), increasing the gap to 4.32 years (SD=6.20) (N=192; t=9.65, p<0.001). With respect to the baseline gap of 3.08 years (SD=5.48) in these patients, the gap increased by 1.24 years (SD=3.81) (t=4.53, p<0.001). In other words, the aging accelerated at a rate of 4.72/3.48=1.36 years/year, or an additional 4 months in each year during the follow-up period.
Mean brain age gap at baseline for the healthy subjects was, as expected, almost zero: GBA=−0.0017 years (SD=5.40) (less than 1 day).
Application of the brain age model to the 3-T images yielded a mean brain age gap of −0.18 years (SD=4.80) (mean absolute error=3.86 years) in healthy subjects and +5.59 years (SD=5.11) in schizophrenia patients.
When applied to the brain images of subjects who were scanned twice within 12 days, the brain age model yielded differences in brain age with a mean of 0.062 years (SD=1.516).
Applying a “reverse” brain age model, built on brain images of schizophrenia patients, yielded a brain age gap of −4.83 years for the healthy subjects (see the online data supplement).

Application of the Brain Age Model to Patient and Follow-Up Scans

In healthy subjects, the mean brain age gap at follow-up (on average 3.84 years later [SD=1.44]) was GBA=−0.045 years (SD=5.82) (16 days), not significantly different from zero. This shows that, on average, the aging of healthy subjects’ brains was consistent with their increasing chronological age during the interscan interval.
At baseline, the brain age of schizophrenia patients was significantly greater than their chronological age: GBA=3.36 years (SD=5.87) (N=341; t=10.73, p<0.001), indicating excessive aging of the brain at baseline.
At follow-up (on average 3.48 years later [SD=1.62]), the brain age of the patients had progressively increased by 4.72 years (SD=4.14), increasing the gap to GBA=4.32 years (SD=6.20) (N=192; t=9.65, p<0.001); ΔGBA=1.24 years (SD=3.81) (t=4.53, p<0.001). The aging thus accelerated at a rate of 4.72/3.48=1.36 years/year, or an additional 4 months in each year during the follow-up period (Figure 3).

Brain Age Acceleration Along the Age and Duration-of-Illness Trajectory

Results of the locally weighted regression of ΔGBA/Δage for the “average” patient’s age and duration-of-illness trajectory are shown in Figure 2 (inset). Just after illness onset, the brain age gap starts growing by about 2.5 years/year—in other words, when the patient has become 1 year older (and thus has been ill for one more year) his or her brain age has become 3.5 years older. Subsequently, the acceleration rate rapidly slows over the first few years of the illness. After about 5 years, the acceleration is no longer significant: the brain age gap stays constant.

Separation of Healthy Subjects and Schizophrenia Patients: Comparisons in Gray Matter Density Space

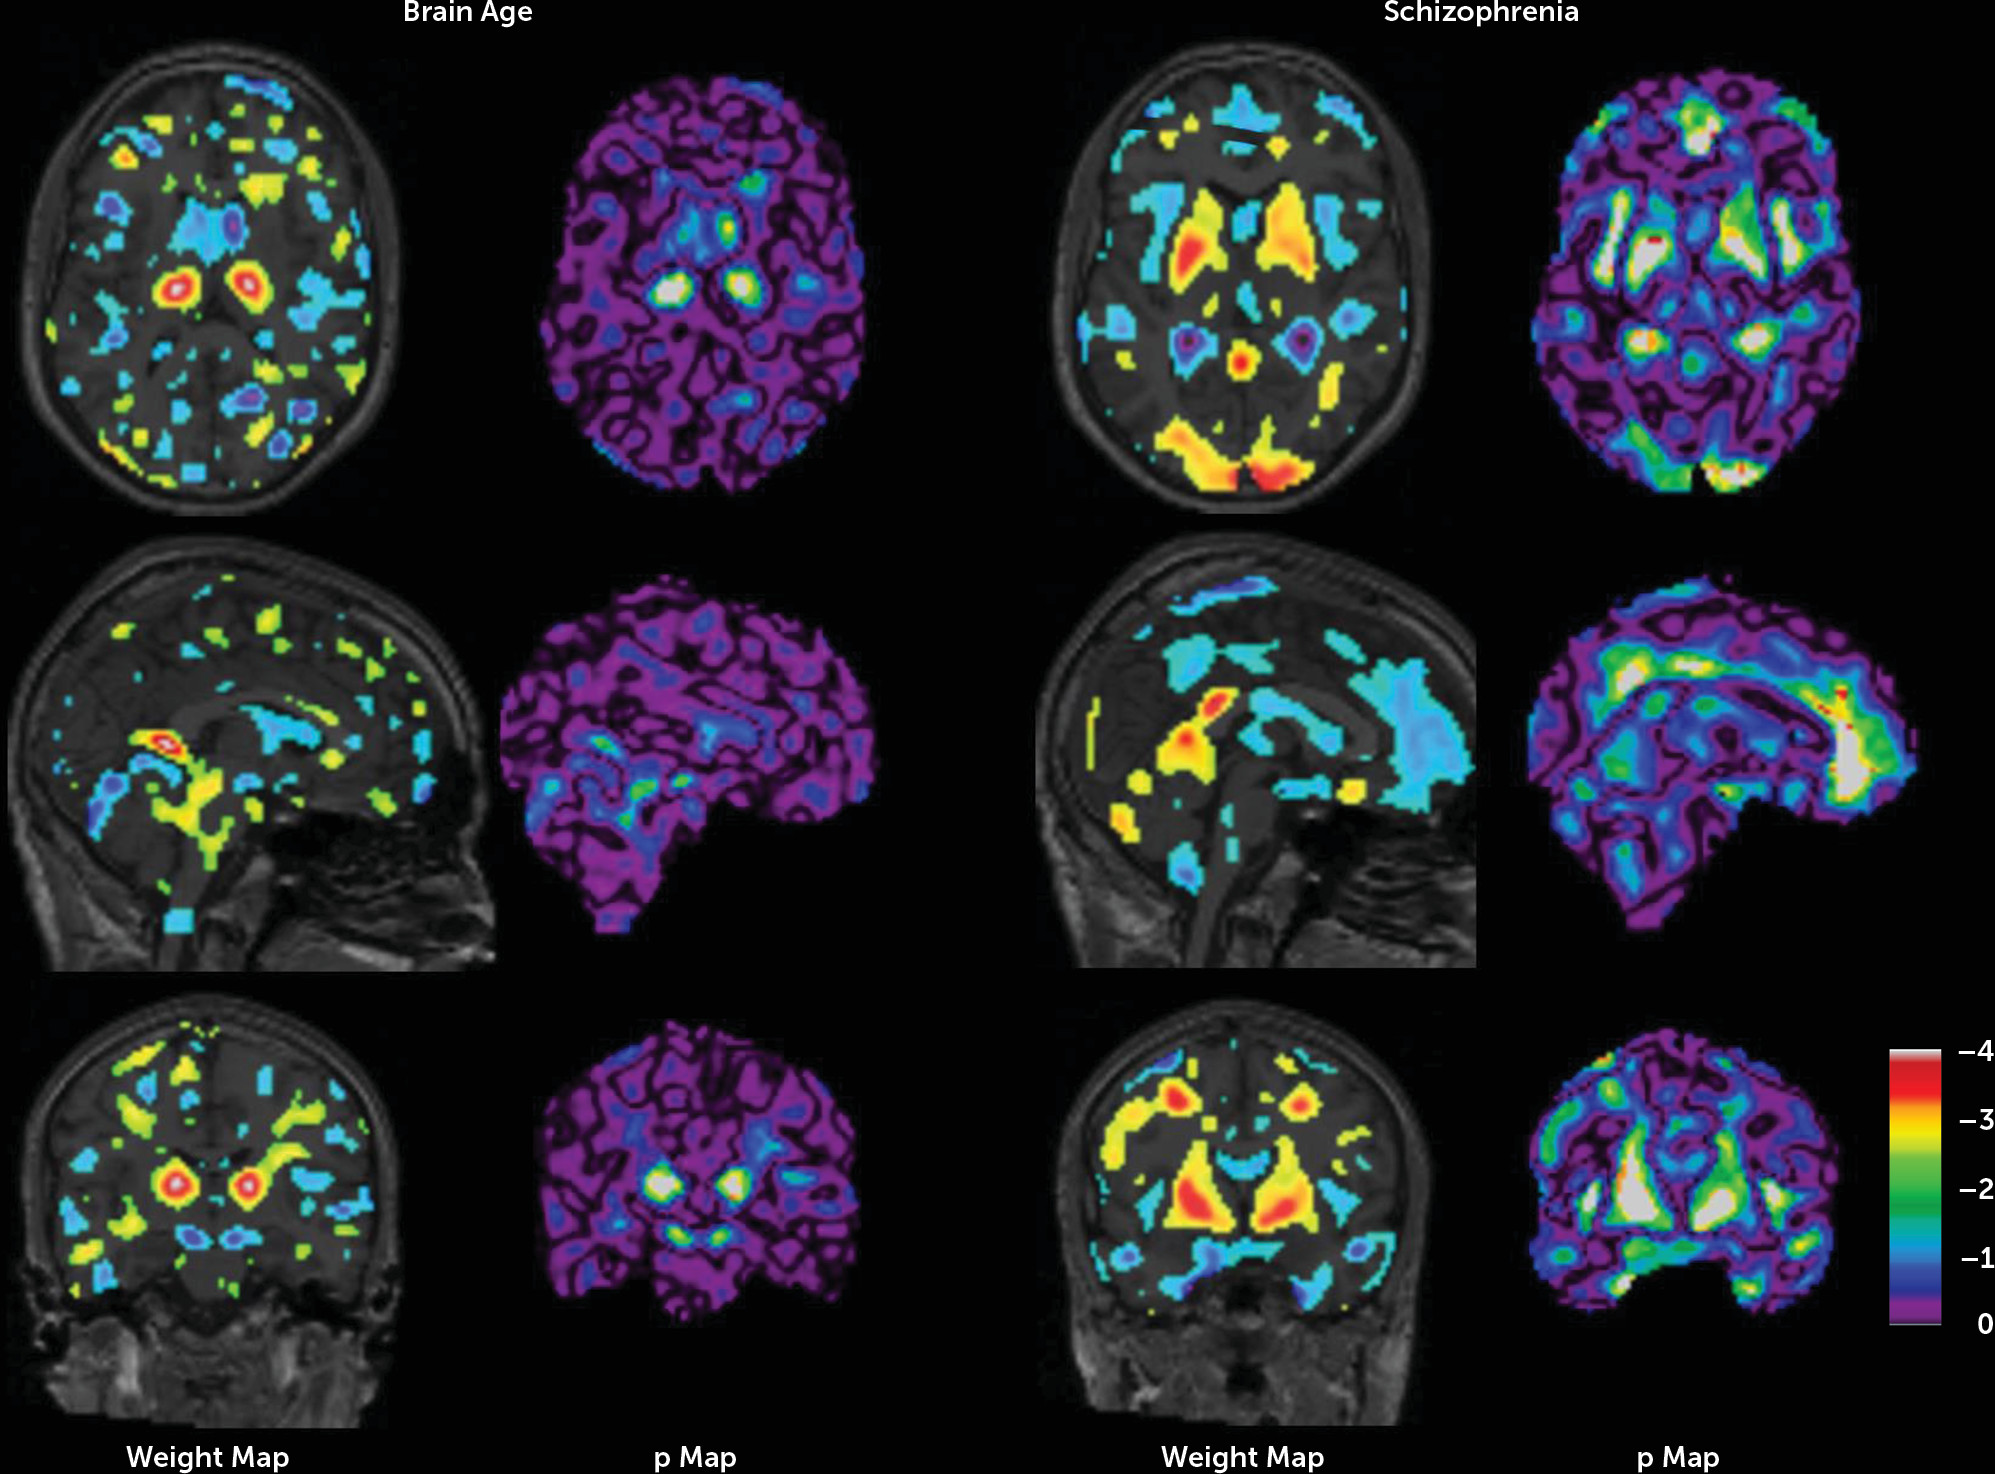
The schizophrenia model separated patients and healthy subjects with an accuracy of 68.6%. From baseline to follow-up, the size of the gray matter density component associated with the brain age gap (GBA), the brain age fingerprint, increased by 0.151 (t=2.35, df=191, p<0.01) for schizophrenia patients as compared with healthy subjects (see Table S1 in the online data supplement). From baseline to follow-up, the length of the brain-age-corrected gray matter density component associated with the schizophrenia gap (GSZ), the schizophrenia fingerprint, changed by 0.132 (t=0.77, df=191, n.s.) in the direction of “more schizophrenia” for patients as compared with controls. Although about as large as the change of the GBA-associated fingerprint, the change in the schizophrenia fingerprint was not significant because of the large standard deviation of the changes, which in turn was related to a large increase in the standard deviation of the size of the patient’s fingerprint at follow-up, from 0.59 to 1.87 (F=3.17, p<0.001). Figure 4 shows the weight maps of the models and their significance.
FIGURE 4. Weight Maps and 10log(p) Maps of the Brain Age Model and the Schizophrenia Modela
a The figure shows axial, sagittal, and coronal views (top, middle, and bottom rows, respectively). Warm colors refer to relative increases of gray matter density in older with respect to younger subjects (MBA) or schizophrenia subjects with respect to healthy subjects (MSZ), and vice versa for cool colors. The absolute values of the weights have been clamped between 0.0003 and 0.0013 in the brain age model and 0.0006 and 0.0025 in the schizophrenia model. Brain regions with substantial negative weight include the left and right caudate nucleus, the putamen, the cerebral peduncle, the cerebral vermis, parts of the temporal lobe, the right posterior part of the cerebrum (angular/lingual/cingulate), and the left occipital pole. Those with substantial positive weights include the left and right thalamus, the cistern of the lamina tecti/great cerebral vein, and the left middle temporal gyrus. Negative weights in the schizophrenia model were found near the left and right posterior horns of the lateral ventricles, the insula, parts of the temporal lobes, large areas in the frontal lobes, the inferior parietal lobule, and the precuneus. Positive weights were found in the left and right putamen and globus pallidus, the right inferior occipitofrontal fasciculus (indicating white matter reduction), the left and right occipital poles, and left and right precentral gyrus.
Applying a GBA=1.55-year threshold value, GBA can be used to separate patients and healthy subjects with an accuracy of 60.2% (a sensitivity of 59.5% and a specificity of 60.9%). Training a two-feature support vector machine on the (GBA,GSZ) fingerprints resulted in a schizophrenia classification model with 71.5% accuracy (see Figure S4 in the data supplement).

Relationship With Clinical Parameters

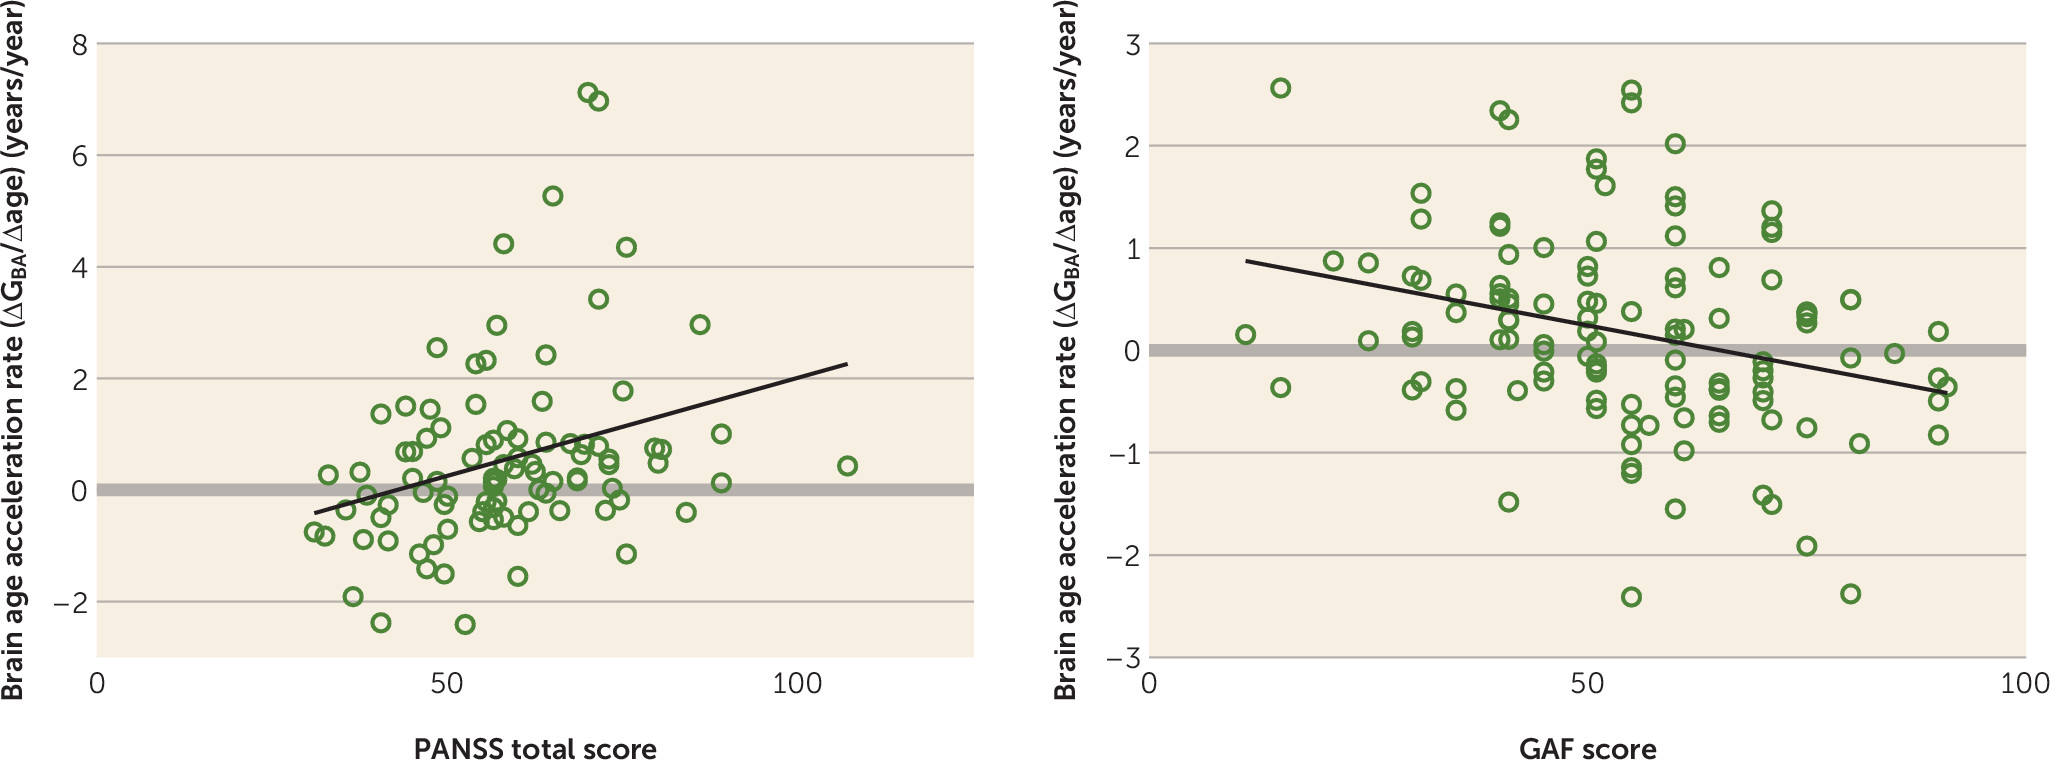
At follow-up, brain age gap was significantly negatively associated with GAF score (Figure 5; see also Table S3 in the data supplement) and positively with antipsychotic dosage (see Table S3). Brain age acceleration rate was negatively associated with GAF score and positively with PANSS total score at follow-up, and positively with number of hospitalizations, duration of hospitalization, and cumulative antipsychotic intake. The latter was also significantly associated with schizophrenia gap acceleration rate.
FIGURE 5. Relationship Between Brain Age Acceleration Rate (ΔGBA/Δage) and Positive and Negative Syndrome Scale (PANSS) and Global Assessment of Functioning Scale (GAF) Scores

Discussion

This longitudinal study in 727 subjects with 1,197 scans is, to our knowledge, the first to show that some of the frequently and consistently reported progressive changes in the gray matter morphology of schizophrenia patients (6) resemble, and possibly reflect, an accelerated aging process that is related to outcome. The remaining part of the progressive changes in patients is qualitatively different from the brain changes observed in healthy subjects over time, and possibly reflects individual variation related to the illness and medication use.
At baseline, brain age in schizophrenia patients was 3.36 years greater than chronological age, replicating earlier results (20) (but see “Methodological Considerations” in the data supplement for a discussion of the possible influence of methodology on our finding of a brain age gap smaller than that reported in reference 20). This means that at around 4 years of illness (when baseline scans were made in this study) brain morphology in schizophrenia patients is similar to that of healthy subjects who are more than 3 years older. Despite this already considerable age gap at baseline, the brain morphology of the schizophrenia patients showed (further) accelerated aging over the 3.5-year follow-up period. Specifically, while the pattern of brain aging in the healthy subjects developed in line with the increase in their chronological age, in the schizophrenia patients this pattern progressed at an augmented pace of 1.36 years/year: an additional 4 months in each year during the follow-up period.
We also found differences between patients and healthy subjects in gray matter change that were qualitatively different from those involved in aging. The “schizophrenia gap”—the aggregate of these differences—was present at baseline and widened during the interval. Interestingly, the variance increased significantly over the interscan interval, rendering the widening of the schizophrenia gap over time nonsignificant. This suggests that these illness-specific changes are more related to the individual course of the disease. Indeed, an association (albeit a weak one) with outcome was found, while differences in medication played a much more significant role in acceleration of the schizophrenia gap than of the brain age gap (see Table S3 in the data supplement). Conversely, the relative interindividual stability of the accelerated brain aging in the schizophrenia patients suggests that it is due to shared factors underlying the disease.
Healthy subjects displayed considerable variability in changes in their brain age gaps during the measurement interval as well. While these changes were on average zero, their standard deviation was 2.7 years. A large part of these changes (2.2 years, as determined from repeated scans) can be attributed to real structural aging of the brain. The nature and cause of these changes are unknown, but they could be of genetic origin or be related to cognitive functioning (36, 37) or to differences in lifestyles or physical (29, 38) and mental (39) activity.
The accelerated aging of the brain in schizophrenia takes place predominantly during the first years after disease onset. After the first year of illness, the brain age gap had increased by about 2 years. Over the first 5 years of follow-up, the acceleration rate slowed to almost zero. Since, in our sample, this period roughly coincides with ages 20–25 (Figure 2), the end of a period of neuromaturational processes such as synaptic pruning and dendritic retraction (40), the accelerated aging in schizophrenia patients may reflect accelerated neuromaturation. Interestingly, the individual variation in changes in brain age gap among patients was larger (SD=3.8 years) than in healthy subjects. This could be related to the same factors that play a role in healthy subjects as well, such as genetic background, cognitive functioning, and lifestyle, although the effect of some of these factors may be magnified in schizophrenia as a result of, for example, diminished cognitive challenges and reduced levels of physical activity. Nevertheless, our data also suggest that some of the accelerated aging of the brain in schizophrenia is related to the severity of the illness, since we found it to be positively associated with symptom and outcome scores and number and duration of hospitalizations. That progressive aging of the brain becomes less pronounced after the first years of illness could reflect the transition from a clinically unstable period, with large variability in functioning, to a relatively stable period, when patients have reached a plateau in functioning (41, 42). The large variation in the pace of brain aging among the schizophrenia patients could thus be a reflection of this individual variation in the course of the disease and, related to that, lifestyle.
Applying our age prediction model in an independent sample, we found a zero brain age gap in healthy subjects and a significant gap (5.6 years) in schizophrenia patients. This replication at a different field strength (3 T) supports the generalization of our age prediction model. Interestingly, most brain areas that played a role in the prediction of age were not involved in the prediction of schizophrenia and vice versa. Many regions were found where lower gray matter density contributed to the greater age prediction, which is in line with the gray matter decreases found in aging brains (43). These regions included the left and right caudate nucleus, the putamen, parts of the temporal lobes, the cerebellar vermis, and the left occipital pole. A few regions were found with the opposite effect: higher gray matter density contributed to greater age prediction in the posterior parts of the thalami. Whether these effects are true structural or physiological changes in gray matter or reflect degrading surrounding white matter tissue remains to be investigated. In the schizophrenia prediction weight map, widespread decreases in gray matter density were found at the interface between the left and right hemispheres and in the frontal lobe, the temporal lobe, the insula, and around the lateral ventricles. A number of marked positive associations between gray matter density and schizophrenia were also found in the left and right occipital poles, the putamen, and the globus pallidus. Interestingly, the latter two structures were the only regions that were enlarged in a meta-analysis of brain volumes in schizophrenia (3).
The findings of this study should be considered in light of some limitations. Our brain age model is insensitive to any nonlinear changes of gray matter with age. Most patients had been ill for several years at the time of their first scan, so changes in brain age just after illness onset were based on a relatively low number of subjects. Patients with the poorest outcomes may not have been able to participate at follow-up (22; but see also 25), which may have confounded the results on brain aging. Almost all patients used antipsychotic medication at the time of scanning, making it impossible to separate the effects of medication on aging of the brain from those of the illness. However, progressive brain changes in a sample of chronic, never-medicated schizophrenia patients (ages 20–70 years) have recently been reported (44).
In conclusion, our data suggest that the widely reported progressive gray matter loss in schizophrenia reflects in part an accelerated aging of the brain that is quantitatively, but not qualitatively, different from that observed in healthy aging. While we also find brain abnormalities that are qualitatively different from those observed in healthy subjects, their evolution over time is highly variable. Thus, the progressive brain loss in schizophrenia appears to reflect two different processes: one relatively homogeneous, reflecting accelerated aging of the brain and related to outcome, the other more variable and specific, possibly reflecting individual variation related to the illness and to medication use. Differentiating between these two processes may not only elucidate the various factors influencing brain loss in schizophrenia, but also assist in individualizing treatment.

Acknowledgments

The authors thank Tim Mulder, Tessa Tensen, Joyce van Baaren, and Rachel Brouwer for technical assistance.

Supplementary Material

File (appi.ajp.2015.15070922.ds001.pdf)

References

1.
Bois C, Whalley HC, McIntosh AM, et al: Structural magnetic resonance imaging markers of susceptibility and transition to schizophrenia: a review of familial and clinical high risk population studies. J Psychopharmacol 2015; 29:144–154
2.
Fusar-Poli P, Smieskova R, Serafini G, et al: Neuroanatomical markers of genetic liability to psychosis and first episode psychosis: a voxelwise meta-analytical comparison. World J Biol Psychiatry 2014; 15:219–228
3.
Haijma SV, Van Haren N, Cahn W, et al: Brain volumes in schizophrenia: a meta-analysis in over 18 000 subjects. Schizophr Bull 2013; 39:1129–1138
4.
Hulshoff Pol HE, Brans RGH, van Haren NEM, et al: Gray and white matter volume abnormalities in monozygotic and same-gender dizygotic twins discordant for schizophrenia. Biol Psychiatry 2004; 55:126–130
5.
Kubicki M, Shenton ME: Diffusion tensor imaging findings and their implications in schizophrenia. Curr Opin Psychiatry 2014; 27:179–184
6.
Olabi B, Ellison-Wright I, McIntosh AM, et al: Are there progressive brain changes in schizophrenia? A meta-analysis of structural magnetic resonance imaging studies. Biol Psychiatry 2011; 70:88–96
7.
Van Haren NE, Cahn W, Hulshoff Pol HE, et al: Confounders of excessive brain volume loss in schizophrenia. Neurosci Biobehav Rev 2013; 37:2418–2423
8.
Cahn W, Rais M, Stigter FP, et al: Psychosis and brain volume changes during the first five years of schizophrenia. Eur Neuropsychopharmacol 2009; 19:147–151
9.
Andreasen NC, Liu D, Ziebell S, et al: Relapse duration, treatment intensity, and brain tissue loss in schizophrenia: a prospective longitudinal MRI study. Am J Psychiatry 2013; 170:609–615
10.
Fusar-Poli P, Smieskova R, Kempton MJ, et al: Progressive brain changes in schizophrenia related to antipsychotic treatment? A meta-analysis of longitudinal MRI studies. Neurosci Biobehav Rev 2013; 37:1680–1691
11.
Rais M, van Haren NE, Cahn W, et al: Cannabis use and progressive cortical thickness loss in areas rich in CB1 receptors during the first five years of schizophrenia. Eur Neuropsychopharmacol 2010; 20:855–865
12.
Brans RG, van Haren NE, van Baal GC, et al: Heritability of changes in brain volume over time in twin pairs discordant for schizophrenia. Arch Gen Psychiatry 2008; 65:1259–1268
13.
Drucker H, Burges CJC, Kaufman L, et al: Support Vector Regression Machines, in Advances in Neural Information Processing Systems 9 (Proceedings). Cambridge, Mass, MIT Press, 1997, pp 155–161
14.
Franke K, Ziegler G, Klöppel S, et al: Estimating the age of healthy subjects from T1-weighted MRI scans using kernel methods: exploring the influence of various parameters. Neuroimage 2010; 50:883–892
15.
Mwangi B, Hasan KM, Soares JC: Prediction of individual subject’s age across the human lifespan using diffusion tensor imaging: a machine learning approach. Neuroimage 2013; 75:58–67
16.
Erus G, Battapady H, Satterthwaite TD, et al: Imaging patterns of brain development and their relationship to cognition. Cereb Cortex 2015; 25:1676–1684
17.
Cao B, Mwangi B, Hasan KM, et al: Development and validation of a brain maturation index using longitudinal neuroanatomical scans. Neuroimage 2015; 117:311–318
18.
Khundrakpam BS, Tohka J, Evans AC, et al: Prediction of brain maturity based on cortical thickness at different spatial resolutions. Neuroimage 2015; 111:350–359
19.
Dosenbach NU, Nardos B, Cohen AL, et al: Prediction of individual brain maturity using fMRI. Science 2010; 329:1358–1361
20.
Koutsouleris N, Davatzikos C, Borgwardt S, et al: Accelerated brain aging in schizophrenia and beyond: a neuroanatomical marker of psychiatric disorders. Schizophr Bull 2014; 40:1140–1153
21.
Hulshoff Pol HE, Schnack HG, Mandl RC, et al: Focal gray matter density changes in schizophrenia. Arch Gen Psychiatry 2001; 58:1118–1125
22.
van Haren NE, Hulshoff Pol HE, Schnack HG, et al: Focal gray matter changes in schizophrenia across the course of the illness: a 5-year follow-up study. Neuropsychopharmacology 2007; 32:2057–2066
23.
Cahn W, Hulshoff Pol HE, Lems EB, et al: Brain volume changes in first-episode schizophrenia: a 1-year follow-up study. Arch Gen Psychiatry 2002; 59:1002–1010
24.
Boos HB, Cahn W, van Haren NE, et al: Focal and global brain measurements in siblings of patients with schizophrenia. Schizophr Bull 2012; 38:814–825
25.
Kubota M, van Haren NE, Haijma SV, et al: Association of IQ changes and progressive brain changes in patients with schizophrenia. JAMA Psychiatry 2015; 72:803–812
26.
van der Schot AC, Vonk R, Brouwer RM, et al: Genetic and environmental influences on focal brain density in bipolar disorder. Brain 2010; 133:3080–3092
27.
Nieuwenhuis M, van Haren NE, Hulshoff Pol HE, et al: Classification of schizophrenia patients and healthy controls from structural MRI scans in two large independent samples. Neuroimage 2012; 61:606–612
28.
Brouwer RM, Hulshoff Pol HE, Schnack HG: Segmentation of MRI brain scans using non-uniform partial volume densities. Neuroimage 2010; 49:467–477
29.
Scheewe TW, van Haren NE, Sarkisyan G, et al: Exercise therapy, cardiorespiratory fitness, and their effect on brain volumes: a randomised controlled trial in patients with schizophrenia and healthy controls. Eur Neuropsychopharmacol 2013; 23:675–685
30.
Schnack HG, van Haren NE, Brouwer RM, et al: Mapping reliability in multicenter MRI: voxel-based morphometry and cortical thickness. Hum Brain Mapp 2010; 31:1967–1982
31.
Vapnik VN: An overview of statistical learning theory. IEEE Trans Neural Netw 1999; 10:988–999
32.
Chang C-C, Lin C-J: LIBSVM: A Library for Support Vector Machines. ACM Trans Intell Syst Technol 2011; vol 2, no 3, article no 27
33.
Schnack HG, Nieuwenhuis M, van Haren NE, et al: Can structural MRI aid in clinical classification? A machine learning study in two independent samples of patients with schizophrenia, bipolar disorder, and healthy subjects. Neuroimage 2014; 84:299–306
34.
Gaonkar B, Davatzikos C: Analytic estimation of statistical significance maps for support vector machine based multi-variate image analysis and classification. Neuroimage 2013; 78:270–283
35.
Mourão-Miranda J, Bokde AL, Born C, et al: Classifying brain states and determining the discriminating activation patterns: support vector machine on functional MRI data. Neuroimage 2005; 28:980–995
36.
Schnack HG, van Haren NE, Brouwer RM, et al: Changes in thickness and surface area of the human cortex and their relationship with intelligence. Cereb Cortex 2015; 25:1608–1617
37.
Franke K, Gaser C: Longitudinal changes in individual BrainAGE in healthy aging, mild cognitive impairment, and Alzheimer’s disease. GeroPsych (Bern) 2012; 25:235–245
38.
Pajonk FG, Wobrock T, Gruber O, et al: Hippocampal plasticity in response to exercise in schizophrenia. Arch Gen Psychiatry 2010; 67:133–143
39.
Yotsumoto Y, Chang LH, Ni R, et al: White matter in the older brain is more plastic than in the younger brain. Nat Commun 2014; 5:5504
40.
Cannon TD: How schizophrenia develops: cognitive and brain mechanisms underlying onset of psychosis. Trends Cogn Sci 2015; 19:744–756
41.
Davidson L, McGlashan TH: The varied outcomes of schizophrenia. Can J Psychiatry 1997; 42:34–43
42.
van Haren NE, Cahn W, Hulshoff Pol HE, et al: Brain volumes as predictor of outcome in recent-onset schizophrenia: a multi-center MRI study. Schizophr Res 2003; 64:41–52
43.
Pfefferbaum A, Rohlfing T, Rosenbloom MJ, et al: Variation in longitudinal trajectories of regional brain volumes of healthy men and women (ages 10 to 85 years) measured with atlas-based parcellation of MRI. Neuroimage 2013; 65:176–193
44.
Zhang W, Deng W, Yao L, et al: Brain structural abnormalities in a group of never-medicated patients with long-term schizophrenia. Am J Psychiatry 2015; 172:995–1003

Information & Authors

Information

Published In

Go to American Journal of Psychiatry
American Journal of Psychiatry
Pages: 607 - 616
PubMed: 26917166

History

Received: 16 July 2015
Revision received: 5 November 2015
Accepted: 18 December 2015
Published online: 26 February 2016
Published in print: June 01, 2016

Authors

Details

Hugo G. Schnack, Ph.D.
From the Department of Psychiatry, Brain Center Rudolf Magnus, University Medical Centre Utrecht, Utrecht.
Neeltje E.M. van Haren, Ph.D.
From the Department of Psychiatry, Brain Center Rudolf Magnus, University Medical Centre Utrecht, Utrecht.
Mireille Nieuwenhuis, M.S.
From the Department of Psychiatry, Brain Center Rudolf Magnus, University Medical Centre Utrecht, Utrecht.
Hilleke E. Hulshoff Pol, Ph.D.
From the Department of Psychiatry, Brain Center Rudolf Magnus, University Medical Centre Utrecht, Utrecht.
Wiepke Cahn, M.D., Ph.D.
From the Department of Psychiatry, Brain Center Rudolf Magnus, University Medical Centre Utrecht, Utrecht.
René S. Kahn, M.D., Ph.D.
From the Department of Psychiatry, Brain Center Rudolf Magnus, University Medical Centre Utrecht, Utrecht.

Notes

Address correspondence to Dr. Schnack ([email protected]).

Funding Information

Dr. Hulshoff Pol serves as a steering committee member in CINS-II, a research program funded by Lundbeck. Dr. Cahn has received unrestricted research grants from or served as an independent symposium speaker or consultant for Eli Lilly, Bristol-Myers Squibb, Lundbeck, Sanofi-Aventis, Janssen-Cilag, AstraZeneca, and Schering-Plough. The other authors report no financial relationships with commercial interests.

Metrics & Citations

Metrics

Citations

Export Citations

If you have the appropriate software installed, you can download article citation data to the citation manager of your choice. Simply select your manager software from the list below and click Download.

For more information or tips please see 'Downloading to a citation manager' in the Help menu.

Format
Citation style
Style
Copy to clipboard

View Options

View options

PDF/EPUB

View PDF/EPUB

Login options

Already a subscriber? Access your subscription through your login credentials or your institution for full access to this article.

Personal login Institutional Login Open Athens login
Purchase Options

Purchase this article to access the full text.

PPV Articles - American Journal of Psychiatry

PPV Articles - American Journal of Psychiatry

Not a subscriber?

Subscribe Now / Learn More

PsychiatryOnline subscription options offer access to the DSM-5-TR® library, books, journals, CME, and patient resources. This all-in-one virtual library provides psychiatrists and mental health professionals with key resources for diagnosis, treatment, research, and professional development.

Need more help? PsychiatryOnline Customer Service may be reached by emailing [email protected] or by calling 800-368-5777 (in the U.S.) or 703-907-7322 (outside the U.S.).

Media

Figures

Other

Tables

Share

Share

Share article link

Share