Developing statistical models to make causal inferences from observational data offers important challenges for psychiatric researchers. Unlike variables that merely covary in a data set, A is said to cause B if the following conditions are met: 1) plausibility: A impacts B is consistent with accepted theory; 2) temporal precedence: A precedes B in time; 3) simultaneous effects: the effect of A on B can be distinguished from the effect, if any, of B on A; and 4) exogeneity: A affects B after all confounding factors C are held constant. Whether known or unknown to the researcher, confounding factors are associated with both A and B and, if left unaccounted for, will contribute to the observed correlation between A and B.
In this issue of the
Journal, Blanco et al. (
1) estimated the association between pain severity and prescription opioid use disorder in a representative sample of noninstitutionalized adults. They found that patients with painful conditions were at higher risk of opioid use disorder, and they conclude that “careful monitoring and consideration of nonopioid alternative treatments is warranted.”
The authors addressed the above causality conditions, including simultaneous effects, by applying structural equation modeling to the survey’s baseline (wave 1) and follow-up (wave 2) data structure and selecting confounders from among “several background demographic and clinical characteristics.” This approach works when the cause (in this case, pain) is outside the control of the patient and a well-designed database includes all critically important confounding variables that affect outcomes. It is, however, worth noting what happens if important unobserved confounders are present.
Following Heckman and Navarro-Lozano (
2) and refined by Lu and White (
3), control functions are designed to account for both observable and unobservable confounders. Here, we can let
y be the outcome opioid use disorder and
D be the variable of interest, pain severity, with
Z as the vector of observable covariates of outcome that are available in the data set and
U as the vector of remaining unobservable covariates that are not available in the data set. If the true data-generating process of outcome is linear, then:
where the coefficient to D, β0, is the true pain effect size and the parameter of interest. Similarly, α0 and γ0 are the true effects of Z and U, respectively, μ0 is the intercept parameter, and ϵ0 is an independent and identically distributed random error.
To estimate
β0, suppose we model the contribution of the unobserved covariates to outcome as
where
W0 are proxies for the missing opioid use disorder covariates and
W1 are additional variables representing drivers of pain (
D) and proxies of drivers of pain, with model parameters
δi for i=
c,
D,
Z,
W0, and
W1.
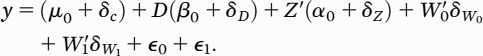
ϵ1 is an independent and identically distributed random error. Substituting equation 2 into equation 1 yields:
Note that the parameter coefficient to D equals the true effect β0 plus confounding bias δD. The strategy is to deliberately misspecify equation 2 by entering additional variables W1 so that pain (D) will no longer contribute to the total impact of the unobserved covariates in equation 2. One can test for bias by taking a transform (squared) of the estimated residuals in equation 3, regressing on the right-hand side of equation 2, and testing directly for (δD ≠ 0). By re-estimating equation 3 for different sets of qualifying W1 variables, one can test whether the resulting effect size estimates vary—i.e., are robust. Since the focus on adding variables is to compute an unbiased pain effect, estimates of the coefficients to Z variables will likely remain biased (δZ ≠ 0), leaving the estimated effect of Z on opioid use disorder risk uninterpretable.
There are other strategies. For instance, two-stage residual inclusion replaces
W1 with the estimated residuals to regressing pain on variables that are correlated with pain, do not drive opioid use disorder, and are uncorrelated with
U and
ϵ0 (
4).
If present, correcting for unobserved confounders can make a difference. In our study of over 12,500 Veterans Affairs physician residents (
5), we found that an association between psychological safe learning environments and physician resident satisfaction with clinical learning after adjusting for 16 factors fell by 50% when the estimate was further adjusted for unobserved confounders using a two-stage residual inclusion method.
One problem with control functions is that effect size estimates for the other covariates often remain biased and thus are uninterpretable. We have investigated using an approach designed to identify the true data-generating process and then estimate its parameters. “Best approximating models” (
6,
7) begin with a stochastic/exhaustive search of all possible models constructed from a list of plausible covariates, plus nonlinear transforms and interaction terms. Each model is estimated to account for over-fitting and multicollinearity. The best-fitting model is selected from among those that do not test positive for model misspecification. The key here is to test whether the researcher’s final model is correctly specified to represent the true data-generating process (
8,
9). As described above, models that can predict may not necessarily reflect the true data-generating process. For instance, a misspecified candidate model that differed by an incorrect transformation and irrelevant predictor from a data-generating process third-order power series was found to be observationally equivalent, yet it tested positive for model misspecification (
8,
9). In simulation experiments in head-to-head comparisons with propensity score matching (which does not account for unobserved confounders), best approximating models were shown to differ by less than 10% of the true effect size in the presence of unobserved confounders, compared with estimates from propensity score matching that fell between 75% below and 50% above the true effect size (
10,
11).
While Blanco et al. are to be applauded for using advanced analytics to compute true associations from observational data sets, investigators should be encouraged to consider more principled and systematic approaches in selecting their covariates, followed by testing their performance to see whether the variable of interest is conditionally exogenous, or the final model representing the data-generating process is correctly specified.