Autism spectrum disorder (ASD), estimated to affect at least 1 in 59 children (
1), is difficult to characterize neurobiologically because of significant phenotypic heterogeneity among individuals with ASD. A key source of this heterogeneity is sensory processing atypicalities (
2), particularly sensory overresponsivity (SOR), which has prevalence rates ranging from 56% to 70% among individuals with ASD (
3). SOR limits individuals’ ability to participate in the community, complete daily living tasks, and interact socially (
4–
6). SOR is well characterized behaviorally as avoidance of and/or severe negative responses to sensory stimuli (e.g., noisy environments, scratchy clothing) (
7), but until recently, little was known about the neurobiology underlying SOR. Examining the neurobiological underpinnings of heterogeneity in ASD is essential to moving toward a precision medicine approach to treating autism. Neuroimaging studies support the relationship between behavioral heterogeneity in SOR and distinct patterns of brain responses to sensory stimuli—for example, children and adolescents with SOR show sensory-limbic overresponsivity to mildly aversive visual, auditory, and tactile stimuli (
8,
9). The mechanisms underlying this overactivation are poorly understood, but a recent study (
9) suggested that individuals with SOR have both slower sensory-limbic habituation and reduced prefrontal regulation of amygdala responses to sensory stimuli (
9). These findings have important implications for intervention: difficulty with habituation contraindicates exposure therapy for SOR. However, additional research is needed to determine whether individuals with ASD and SOR habituate more slowly or not at all and whether SOR is also related to difficulties with generalization.
Generalization is key to exposure therapy because it is impossible to conduct graduated exposure on every sensory stimulus and situation (exposure would be less effective if, for example, it reduced responses to lawnmowers but not to blenders). Notably, Green et al. (
9) also showed that while individuals with ASD who did not have SOR had typical sensory-limbic habituation, they showed atypical increased prefrontal regulation of amygdala activity. Thus, while low-SOR children and adolescents showed more typical behavioral sensory responsiveness, their brain responses were distinct from those of both typically developing youths and high-SOR youths with ASD. These different profiles could represent compensatory mechanisms and/or atypically high neural demands when processing sensory stimuli despite seemingly typical behavioral responses. A better characterization of the distinct neural profiles of autistic individuals with varied behavioral sensory responses is essential to developing targeted interventions. Therefore, in this study we examined patterns of responses to mildly aversive sensory stimulation in children and adolescents with ASD with high or low behavioral SOR and in typically developing youths in key brain regions of interest identified from previous studies (amygdala, sensory cortices, prefrontal cortex). We focused on neural responses across repeated stimulation using extended initial exposure and a subsequent generalization period during which participants were exposed to similar but new stimuli.
Other studies have found habituation, adaptation, and/or inhibitory deficits in both tactile and auditory modalities in ASD. In a tactile discrimination study, adaptation stimuli were found to have a reduced effect on children and adolescents with ASD, suggesting deficits in habituation and inhibition (
10). Adults with ASD have been found not to reduce their subjective ratings of sounds over time, suggesting habituation difficulty (
11). Multiple studies have demonstrated that individuals with ASD have atypical prepulse inhibition, suggesting reduced sensorimotor gating (
12). Finally, infants at high risk for autism have been shown to exhibit reduced auditory-evoked-potential habituation to repeated tones (
13). Taken together, these studies suggest deficits in sensory gating, the process by which an initial stimulus leads to a reduction in response to subsequent stimuli. However, these studies either did not examine how these basic sensory processes were related to SOR or found limited relationships between the two. Responses to a basic pulse or tone may not reflect responses to complex real-world environments. Individuals with ASD have also shown decreased amygdala habituation to higher-level social stimuli (
14–
16), but no other functional MRI (fMRI) studies have examined how within-ASD-group differences in SOR are related to neural responses to ecologically valid sensory stimuli across multiple levels (basic sensory processing, emotional arousal, top-down inhibition). We hypothesized that children and adolescents with ASD who have SOR would show deficits in habituation of amygdala and sensory cortices even across longer stimulus presentations than previously examined, as well as deficits in generalization to new but similar stimuli, compared with both typically developing and low-SOR participants with ASD. Additionally, we predicted that low-SOR participants with ASD would show patterns of habituation and generalization distinct from both typically developing and high-SOR participants with ASD, including greater prefrontal down-regulation.
Methods
Participants
Participants were 42 children and adolescents with ASD and 27 typically developing matched control subjects (mean age, 13.6 years; range, 8.2–18.0 years). Participants had a full-scale IQ within the normal range on the Weschler Abbreviated Scales of Intelligence (
17). The groups did not differ significantly in age, motion during fMRI, or performance IQ. The typically developing group had significantly higher verbal and full-scale IQ (
Table 1). Full-scale IQ was thus tested as a covariate in all group comparisons. Participants in the ASD group had a diagnosis of ASD, confirmed with the Autism Diagnostic Interview–Revised (
18) and the Autism Diagnostic Observation Schedule (
19); severity was assessed with the Vineland Adaptive Behavior Scales and the Social Responsiveness Scale (
20) (
Table 1). Sixteen participants in the ASD group were taking psychoactive medications (selective serotonin reuptake inhibitors, N=1; psychostimulants, N=7; multiple medications, N=8). There were no significant differences in the ASD group between participants with and without medication in any of the regions of interest or in connectivity values.
fMRI Sensory Paradigm
Participants were exposed to two consecutive paradigms: an initial exposure phase lasting 8.5 minutes, during which they experienced six blocks each of 15-second auditory, tactile, and joint (simultaneous auditory and tactile) conditions. The exposure paradigm was similar to one previously used (
9) but longer to allow more time for habituation. The subsequent generalization phase lasted 5.75 minutes, during which participants experienced four blocks each of novel but similar 15-second auditory, tactile, and joint stimuli matched for aversiveness with exposure stimuli. Auditory stimuli consisted of pulsing pink and violet noise sounds. Tactile stimuli were two different scratchy sponges rubbed on participants’ inner left arms at one stroke per second. Participants focused on a central fixation cross throughout the task, with 12.5 seconds of fixation between trials and 12.5-second initial and final fixations. Data on these paradigms have not been previously published. (Additional details on stimuli and MRI data acquisition are provided in the
online supplement.)
Behavioral Measures
Child sensory questionnaires were completed by parents (
Table 1). An SOR composite score was created by standardizing and averaging auditory and tactile subscales of the SOR measures across all participants. To compare SOR subgroups, the ASD group was divided into high-SOR and low-SOR groups by median split on the SOR composite score and compared with the typically developing group (excluding one high-SOR typically developing youth). The high- and low-SOR groups did not differ significantly in age, IQ, or overall in-scanner motion (
Table 1). The high-SOR group had significantly more motion during the first half of generalization (see Table S1 in the
online supplement), so motion was tested as a covariate in generalization analyses and included when significant at p<0.10.
Short Sensory Profile.
The Short Sensory Profile (
21) is a widely used parent report measure of sensory dysregulation across modalities. We used the two auditory sensitivity items from the auditory/visual subscale, and the tactile sensitivity and underresponsive/seeks sensation subscales. Higher scores indicate lower impairment. This measure has strong reliability and validity (
22).
Sensory Over-Responsivity Inventory.
The Sensory Over-Responsivity Inventory (
23) is a parent checklist of sensations that bother their child. The auditory and tactile subscales were used for this study. The number of items parents rate as bothering their child discriminates between children with and without SOR (
23).
MRI Data Acquisition
Scans were acquired on a Siemens Prisma 3-T MRI scanner. Each functional run involved the acquisition of 706 (exposure) or 476 (generalization) multiband echo planar imaging volumes (gradient-echo, TR=720 ms, TE=37 ms, flip angle=52°, 104×90 matrix, 208 mm FOV, 72 slices, voxel size=2×2×2 mm). The Siemens “prescan normalize” option was used after signal inhomogeneities were apparent in the first few scans, and groups were matched on percentage of participants with prescan normalization (75% of the ASD group and 81% of the TD group). Auditory stimuli were presented using magnet-compatible noise-cancelling headphones. Participants wore earplugs to reduce scanner noise.
fMRI Data Analysis
Analyses were performed using the FMRIB Software Library (FSL), version 5.0.10 (
www.fmrib.ox.ac.uk/fsl). Preprocessing included motion correction to the mean image, spatial smoothing (Gaussian kernel full width at half maximum=5 mm), and high-pass temporal filtering (t>0.01 Hz). Functional data were linearly registered to a common stereotaxic space by registering to the MNI152 T1 2 mm template (12 degrees of freedom).
FSL’s fMRI Expert Analysis Tool (FEAT), version 6.0, was used for statistical analyses. Fixed-effects models were run separately for each subject, then combined in a higher-level mixed-effects model to investigate within- and between-group differences. Single-subject models for all analyses included 12 motion parameters as covariates. Each experimental condition (auditory, tactile, or joint) was modeled with respect to fixation during rest. Higher-level group analyses were carried out using FSL’s Local Analysis of Mixed Effects State (FLAME 1+2) (
24–
26).
Neural habituation.
Change in neural response (“habituation”) to the joint (auditory and tactile) stimuli across exposure and generalization phases in key regions of interest was compared between SOR subgroups (the low-SOR, high-SOR, and typically developing groups). Regions of interest were chosen on the basis of regions shown to be related to SOR in previous studies (
8,
9) and included the right and left amygdala, postcentral gyri, Heschl's gyri, orbitofrontal cortex (OFC), as well as the ventral medial prefrontal cortex (vmPFC). The primary visual cortex (V1) was also examined to determine group differences in inhibition of sensory regions unrelated to the stimuli presented. For each participant, parameter estimates from the six exposure blocks and four generalization blocks (compared with fixation) were extracted from the masks. (See the
online supplement for region-of-interest masks and outlier adjustment details.) Repeated-measures analyses of variance (ANOVAs) were used to examine group differences in regions of interest across time; exposure analyses included three time points: early
E (blocks 1–2), middle
E (blocks 3–4), and late
E (blocks 5–6). Generalization analyses also had three time points: the late
E block, to examine change from the exposure to the generalization phase, then early
G (blocks 1–2) and late
G (blocks 3–4). ANOVAs included within-subject factors of block (early
E, middle
E, late
E, or late
E, early
G, late
G) and laterality (when relevant) as well as the between-subject factor of SOR group (low-SOR, high-SOR, typically developing). Full-scale IQ was included as a covariate if it had an effect at p<0.1.
Functional connectivity.
A psychophysiological interaction analysis was used to examine how amygdala-frontal functional connectivity changed from the first to the second half of the joint exposure phase as a function of SOR. Psychophysiological interaction analyses examine the interaction between task and the time series of a seed region (here, the right and left amygdala) to identify brain areas where activity is more correlated with the seed region during one part of the task compared with the other (here, the first compared with the second half of the joint exposure). For consistency with habituation analyses, the amygdala seeds used were the same as for the habituation analyses (4-mm spheres around the peak exposure coordinates for each group, added together). Because our interest was in prefrontal regulation of the amygdala, we constrained analyses to the frontal lobes using a mask that included the frontal pole, frontal gyri, anterior cingulate, and OFC Harvard-Oxford masks. SOR composite score was entered as a regressor to determine frontal regions where change in amygdala connectivity across the exposure condition was related to SOR. Analyses were thresholded at Z>1.7 (p<0.05) and cluster-corrected within the frontal lobes at p<0.05.
Exposure/generalization within- and between-group comparisons.
Although not a focus of this study, whole-brain analyses were run using methods consistent with our previous work (
8,
9) to allow easy comparisons. Within-group activation maps for each condition (compared with fixation) were thresholded at Z>2.3 (p<0.01) and whole-brain cluster-corrected at p<0.05 using FSL. Between-group comparison thresholds were Z>1.7 (p<0.05), whole-brain cluster-corrected at p<0.05; only clusters with peaks of Z>2.3 are reported as significant. Full-scale IQ was covaried in all between-group analyses.
Results
Behavioral Results
Independent-sample t tests showed that the ASD group had significantly more severe SOR symptoms than the typically developing group (
Table 1). The high-SOR group (by definition) had higher SOR scores than the low-SOR group; there were no group differences in underresponsivity.
fMRI Results
Neural habituation during joint condition.
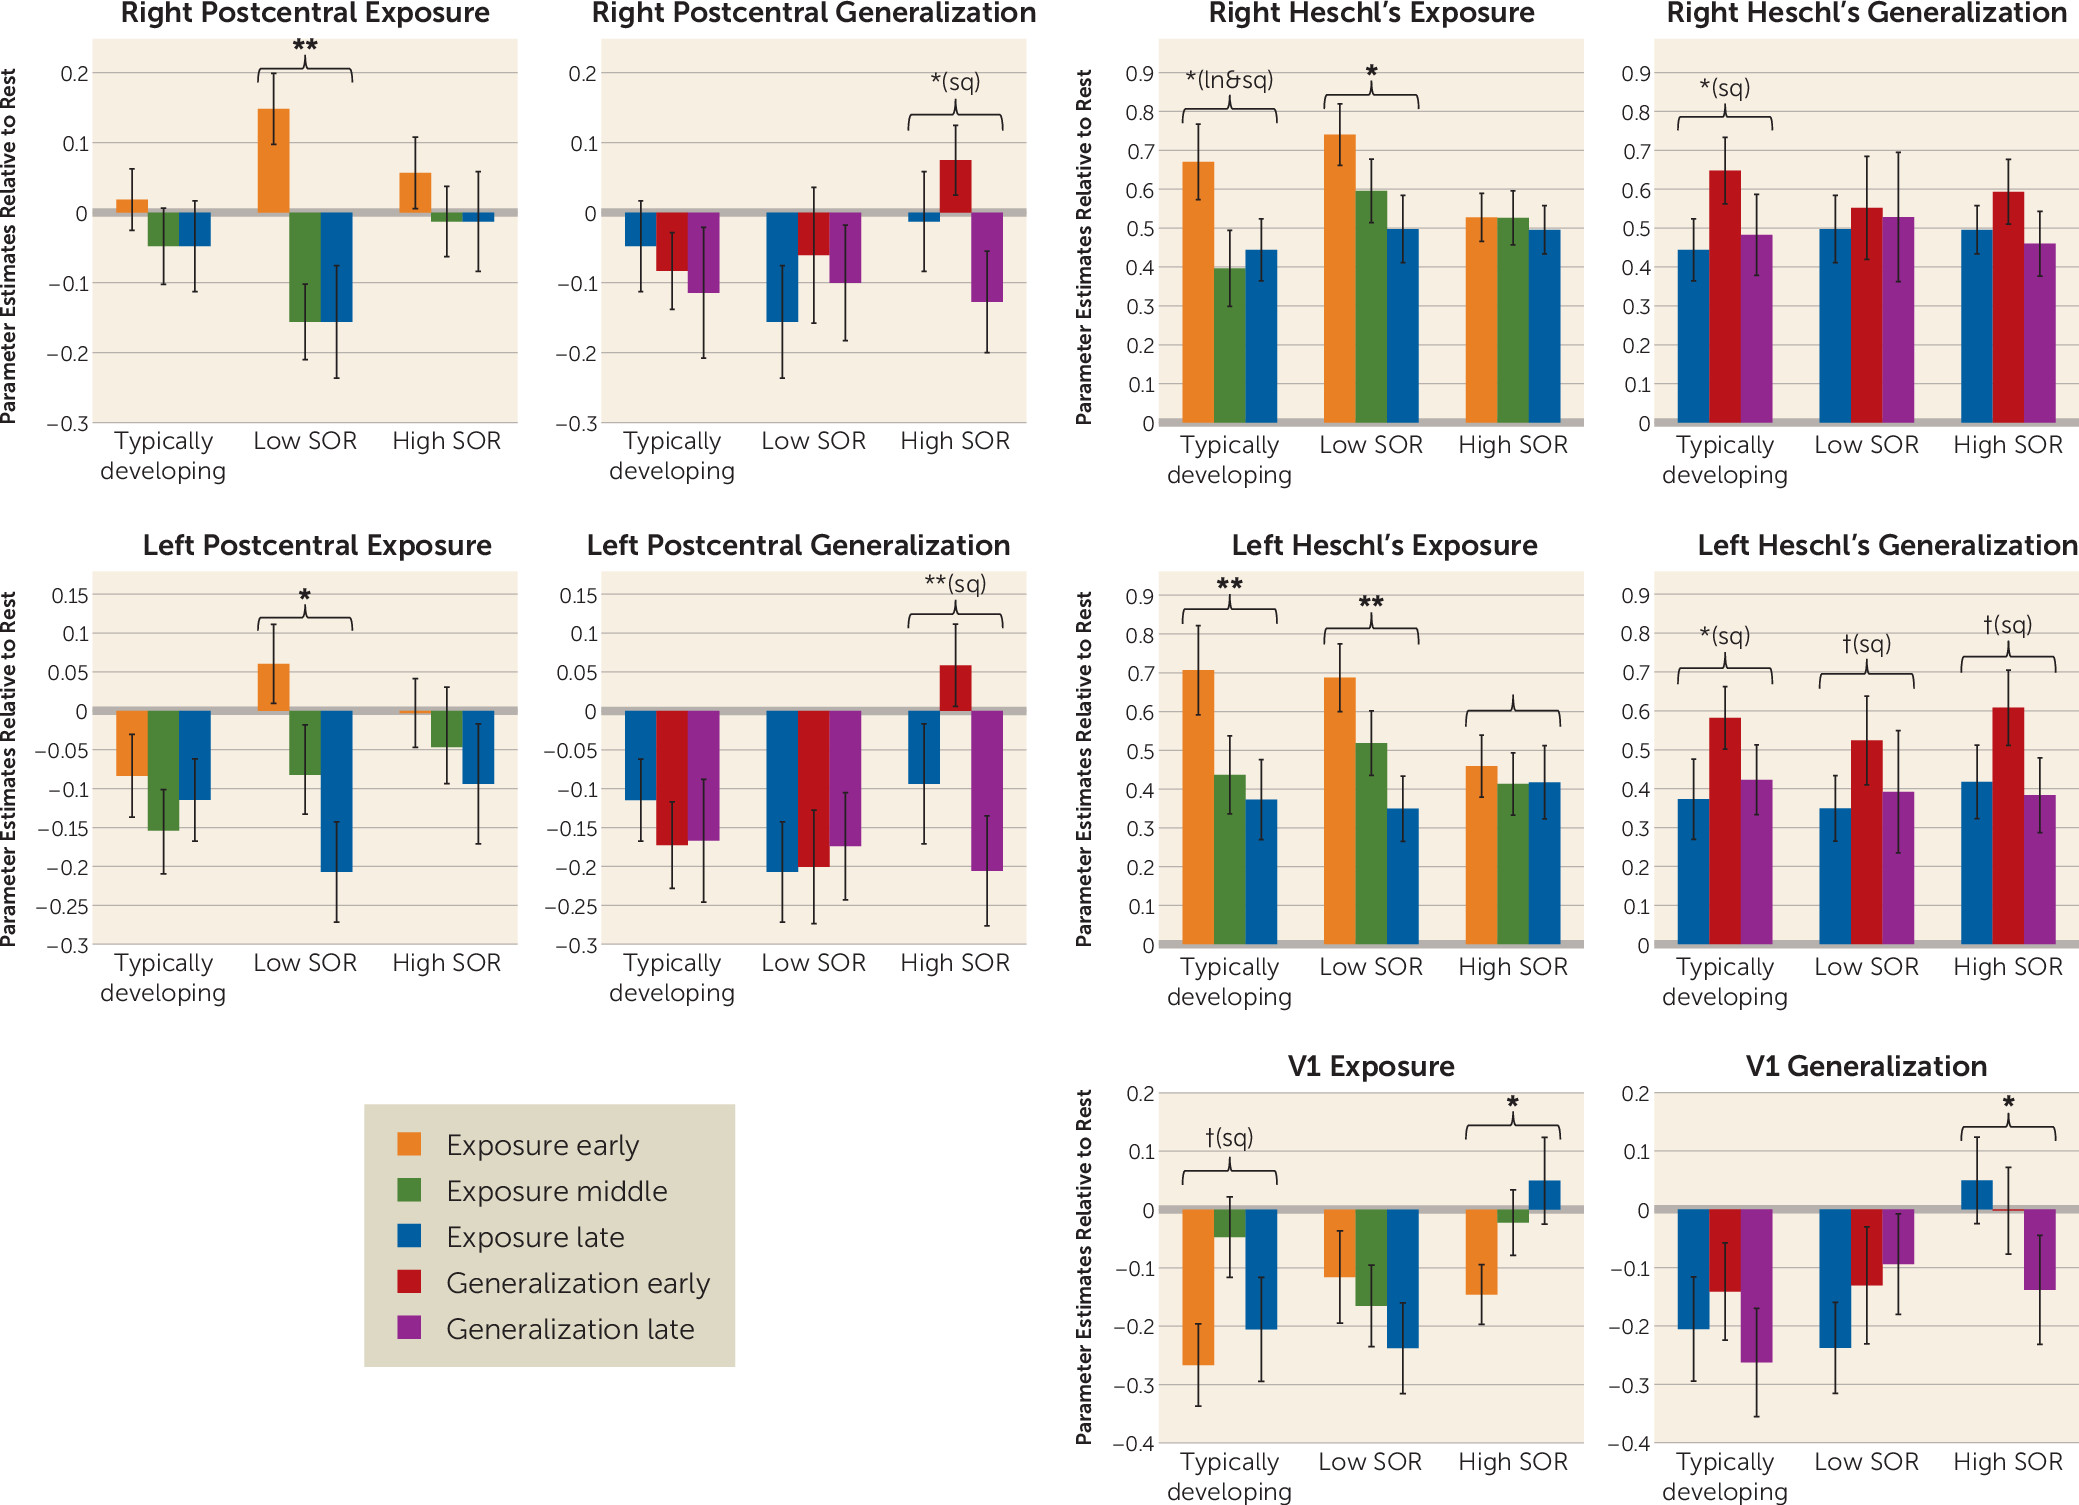
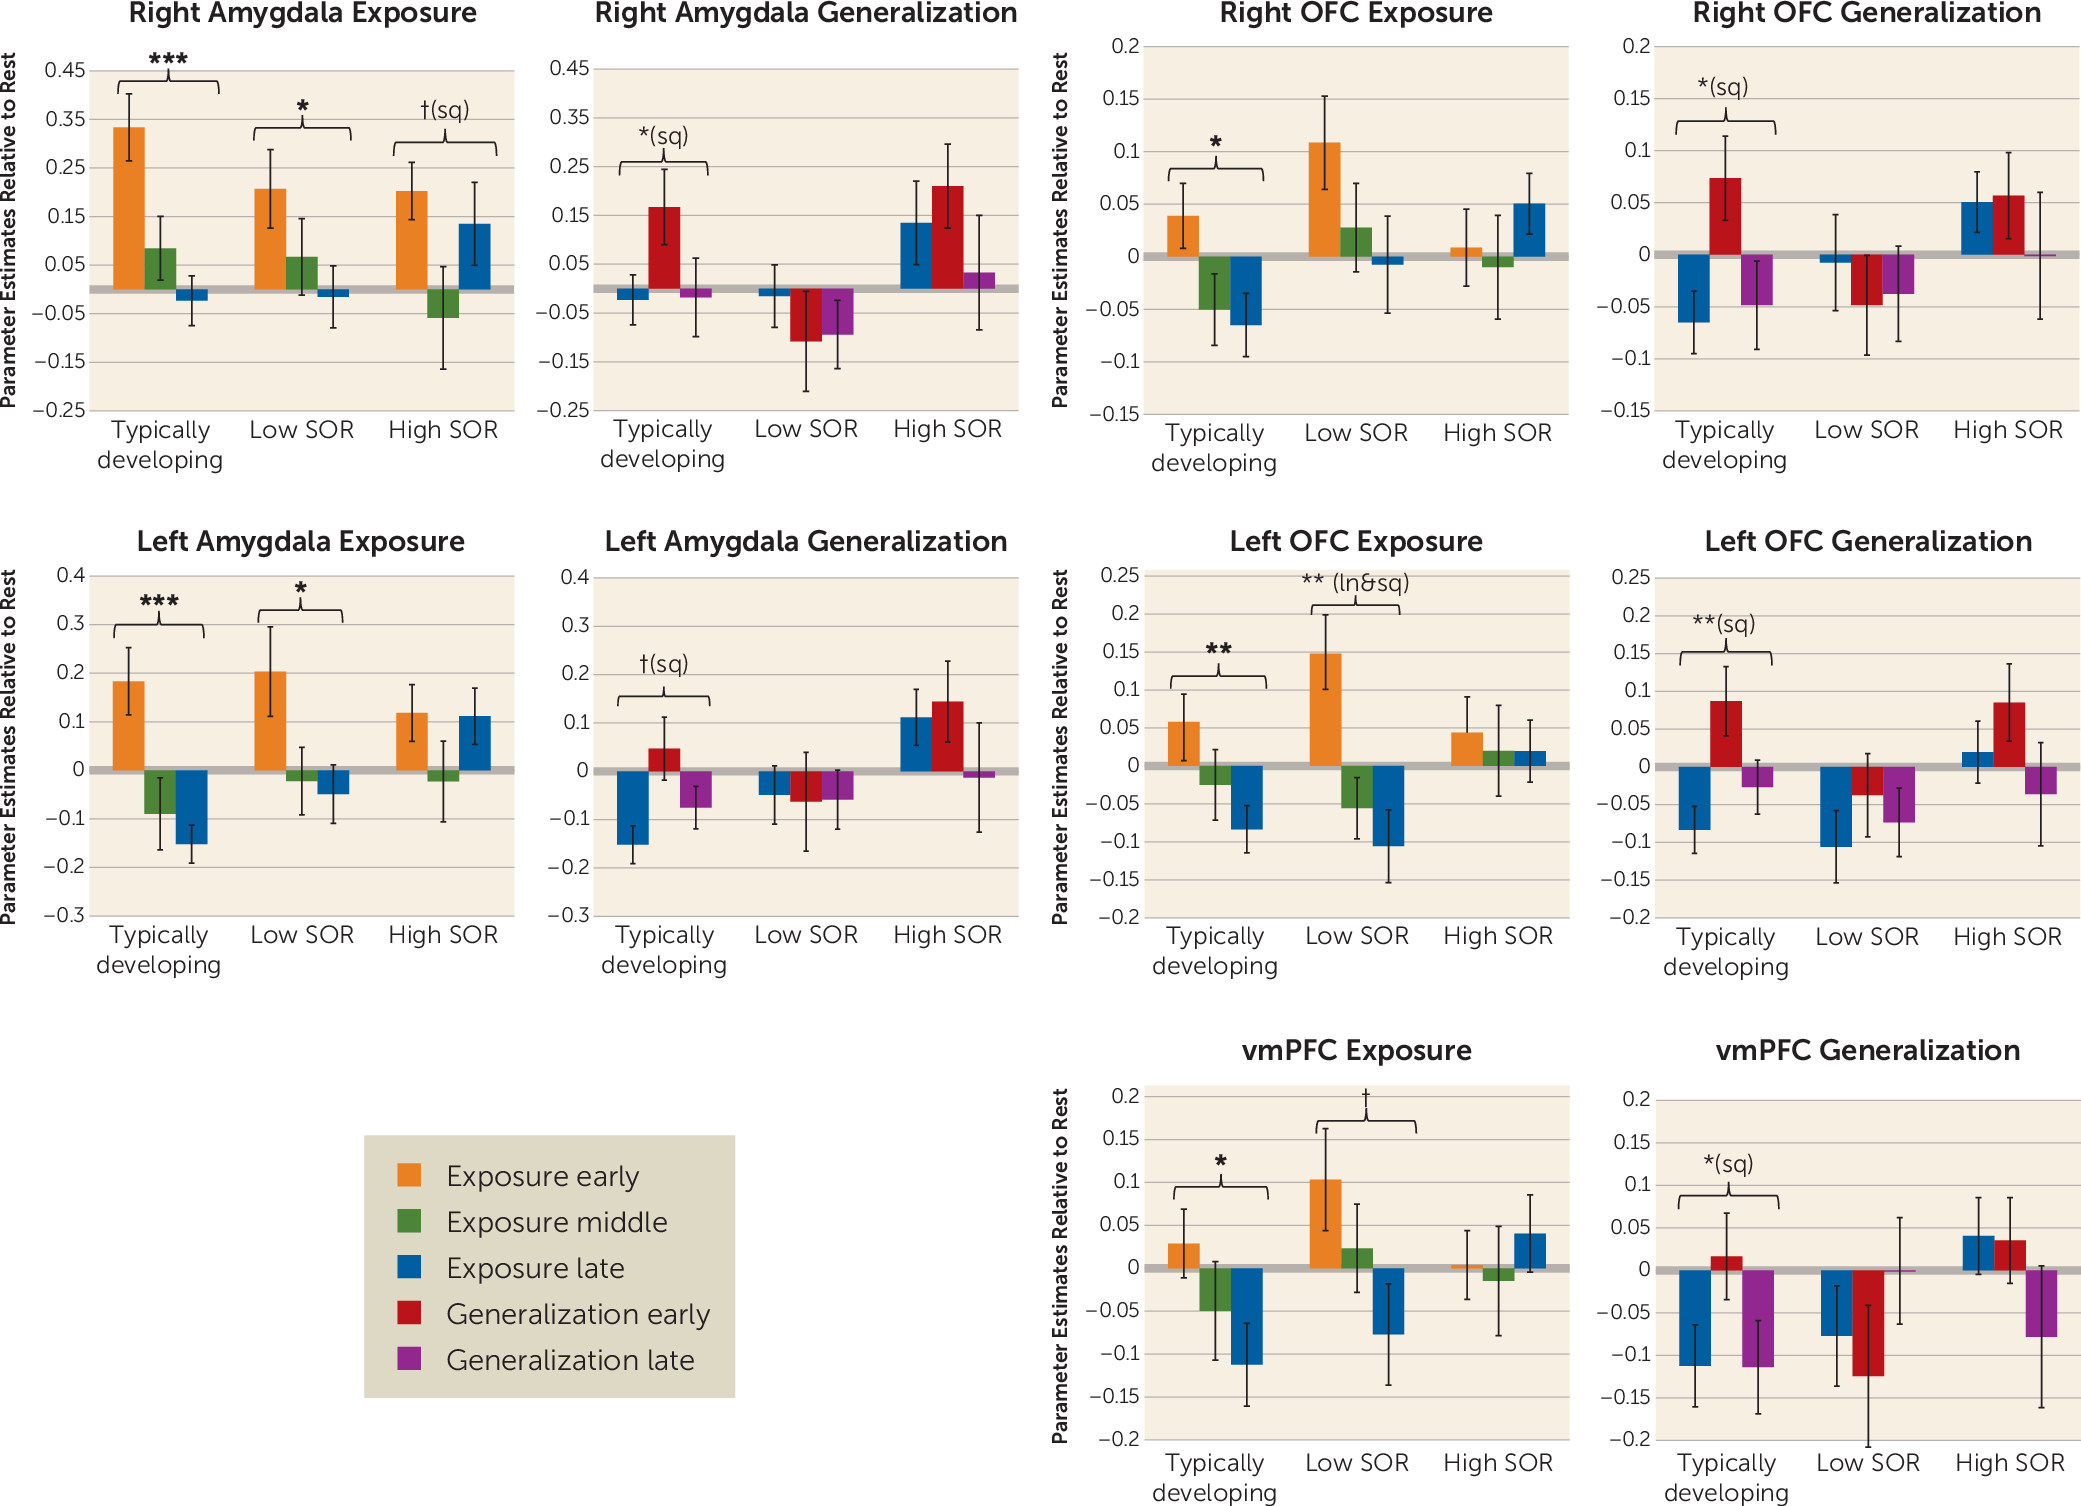
The habituation analyses compared the high-SOR ASD, low-SOR ASD, and typically developing groups on initial response to the joint (auditory and tactile) stimuli and change over time (habituation) in blood-oxygen-level-dependent responses across the exposure phase—brain response across early, middle, and late time points of the initial six blocks of sensory stimulation—and across the generalization phase—change in brain response from the late time point of exposure through the first and second halves of sensory stimulation with novel but similar stimuli. Analyses were conducted within key regions of interest: the sensory cortex and frontal-limbic regions (amygdala, OFC, vmPFC). Because there were no significant group differences in initial response to the joint stimuli in any region of interest, the results presented below focus on group differences in the linear (slope) and quadratic (change in slope) change over time (
Figures 1 and
2). Full ANOVA statistics are presented in
Tables 2 and
3 and in the
online supplement.
Somatosensory cortex.
The groups differed significantly in habituation during both the exposure and generalization phases. The low-SOR group showed significant decreases in the postcentral gyrus across the initial joint auditory and tactile exposure, whereas the typically developing and high-SOR groups had no significant change. In response to the generalization stimuli, the high-SOR group showed first increased, then decreased responses; the other two groups showed no significant change. Group differences in the generalization phase were greater for the left than for the right postcentral gyrus, driven by the typically developing and low-SOR groups inhibiting the (irrelevant) left postcentral gyrus.
Auditory cortex.
Activation decreased bilaterally across the exposure phase for the low-SOR and typically developing groups, but just as seen in the somatosensory cortex, the high-SOR group showed no significant habituation. For the generalization stimuli, all three groups showed an increase, then a decrease in the left auditory cortex, but only the typically developing group showed this pattern in the right auditory cortex; neither ASD group showed right hemisphere auditory changes.
Primary visual cortex (V1).
Because the high-SOR group activated the left somatosensory cortex, a region not expected to respond to the left-arm stimulation, we further investigated atypical inhibition (decreased activity compared with baseline) in extraneous sensory cortices by examining V1. All three groups showed initial inhibition of V1, but this inhibition was sustained for the typically developing and low-SOR groups, whereas the high-SOR group had significant V1 increases across the exposure phase and overall greater activation than either the low-SOR group or the typically developing group. The low-SOR and typically developing groups continued to show V1 inhibition throughout the generalization phase, although the low-SOR group had increases that fell short of significance (still below baseline). The high-SOR group showed significant decreases in V1 activation, from significant activation at the end of the exposure phase to significant inhibition at the end of the generalization phase.
Amygdala.
The low-SOR and typically developing groups showed sustained decreases in amygdala response across the exposure phase, whereas the high-SOR group initially showed decreased and then increased amygdala response. For the generalization stimulus, only the typically developing group showed initially increased and then decreased response. Additionally, the high-SOR group had significantly higher amygdala response than the low-SOR group across the generalization phase: the high-SOR group started high and stayed high, whereas the low-SOR group started low and stayed low, showing no significant amygdala response to the novel stimulus.
Prefrontal cortex.
Activity in the left and right OFC and vmPFC decreased significantly across the exposure period for the low-SOR and typically developing groups only. In response to the generalization stimulus, all groups showed initial bilateral OFC signal increases and then subsequent decreases. Across the generalization phase, there was significantly greater OFC activation in the high-SOR compared with the low-SOR group. The vmPFC showed a similar pattern of activation in the generalization phase, but the change in activation, time-by-SOR interaction, and main effect of SOR were not significant.
Functional connectivity.
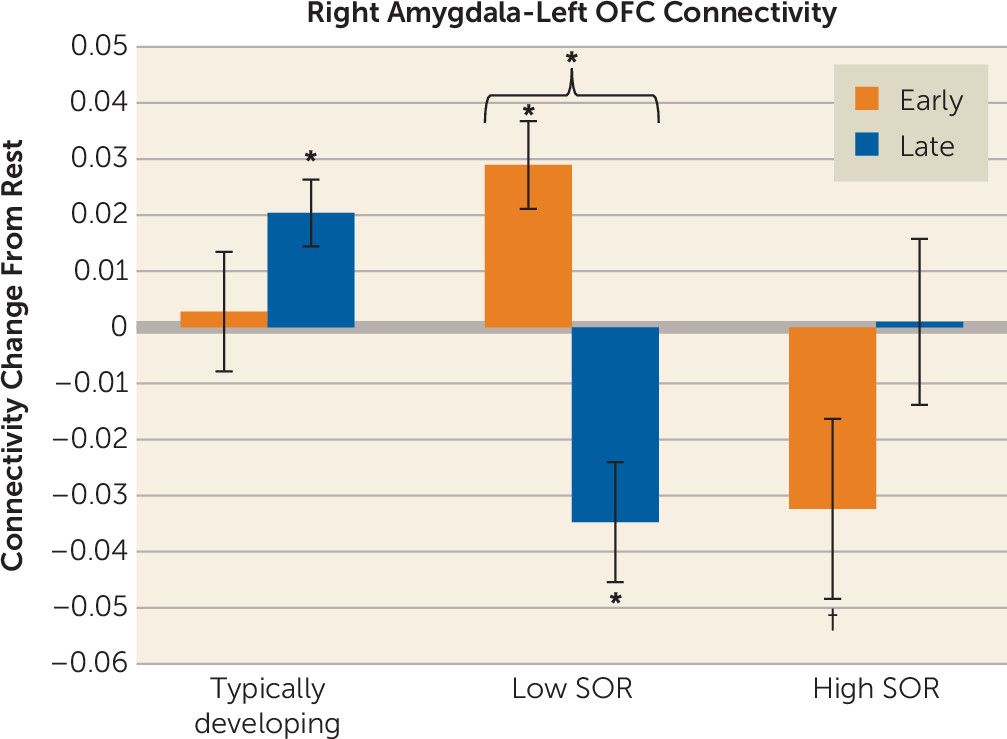
Considering that SOR was related to reduced amygdala habituation, we performed a functional connectivity analysis to examine how SOR was related to changes in amygdala-prefrontal connectivity from the first to the second half of exposure to the joint (auditory and tactile) stimuli. Within the ASD group, SOR was correlated with significant connectivity changes between the right amygdala and the left OFC. There was no correlation between SOR and change in left amygdala connectivity. To determine the direction of effects, we extracted parameter estimates from the left OFC and conducted a repeated-measures ANOVA with SOR group as a between-group factor and time as within-subject factor (
Figure 3; see also the
online supplement). There was (by definition) an SOR-by-time effect. Post hoc analysis showed that the low-SOR group switched from positive to negative connectivity across the exposure phase, whereas the high-SOR group initially had negative connectivity values in the first half of exposure, which then changed to near-zero levels by the second half of the exposure phase, thus this difference with the second half of exposure did not reach significance. The typically developing group showed no significant changes in connectivity.
Whole-brain within- and between-group results.
During the initial joint (auditory and tactile) exposure, the ASD group had greater activation in the left and right parietal lobule/postcentral gyrus, left precentral gyrus, left amygdala, right superior temporal gyrus, right OFC, and medial PFC. During joint generalization, the ASD group had greater activation in the right parietal lobule/postcentral gyrus and precentral gyrus. There were no significant typically developing > ASD differences. (Auditory and tactile conditions are described in the online supplement; see Tables S2–S7 and Figures S1–S3.)
Discussion
In this study, we demonstrated that children and adolescents with ASD who have low or high SOR exhibit atypical and distinct patterns of brain responses to multiple aversive sensory stimuli and generalization of response to new, similar stimuli. These patterns suggest unique underlying neurobiological mechanisms for sensory processing difficulties in autism.
First, for individuals with ASD, habituation is a dynamic process involving top-down regulation, which is impaired in high-SOR children and adolescents with ASD. High-SOR participants lacked habituation across sensory cortices and amygdala, consistent with our previous findings (
9), which are extended here to show that longer sensory exposure does not allow delayed habituation. Rather, amygdala decreases were unsustained, which, along with the finding that the high-SOR ASD group showed initial but unsustained amygdala-prefrontal connectivity, suggests that the high-SOR group cannot maintain regulation of sensory responses across extended periods. This contrasts with what we observed in the low-SOR group, which switched from positive to negative amygdala-prefrontal connectivity across sensory exposure, suggesting that they are engaging regulatory processes, consistent with their significant habituation of sensory and amygdala responses. Strikingly, although we explored amygdala connectivity with the entire frontal lobe, the right amygdala–left OFC connectivity found here to be associated with SOR was the same as reported previously in Green et al. (
9). Notably, we further show here that the key SOR group difference is in their patterns of connectivity change across sensory exposure.
Second, unlike high-SOR participants with ASD, low-SOR participants lacked neural responsiveness to new but similar stimuli, potentially indicating overregulation, difficulty with discrimination, or hyporesponsivity. The low-SOR group showed no significant change in responses to the new stimuli in any sensory or fronto-amygdala regions of interest. This hyporesponsivity to the new stimuli could be caused by overregulation in which an initially adaptive inhibition of response becomes overgeneralized, inhibiting responses to new information, which is supported by EEG research (
27,
28). In contrast, the typically developing group showed an increased response to the new stimulus that rapidly attenuated in most regions. The high-SOR group also had higher responsiveness to the new stimuli in most regions but, notably, no significant change in responsiveness from the end of the initial exposure period.
Finally, high-SOR children and adolescents with ASD cannot maintain inhibition of irrelevant sensory cortices, leading to reduced cross-modality segregation of sensory responses. After auditory and left-arm tactile stimulation, the low-SOR ASD and typically developing groups showed inhibition (decreased activation compared with fixation) in the left postcentral gyrus and visual cortex. In contrast, the high-SOR ASD group showed a marked inability to maintain down-regulation across sensory exposure and/or with a novel stimulus. This is consistent with the high-SOR pattern of inability to maintain prefrontal-amygdala regulation. Reduced inhibition of irrelevant sensory cortices is also consistent with findings by Jao Keehn et al. (
29) showing impaired down-regulation of the visual cortex during auditory processing; notably, we further showed that SOR-related down-regulation abnormalities are dynamic across time. This inability to maintain down-regulation across time is consistent with the emerging theory of GABA/glutamate imbalance (
30–
32). Children with ASD show reduced sensorimotor GABA levels, associated with a lower tactile dynamic detection threshold, suggesting abnormalities in feed-forward inhibitory mechanisms (
32).
However, a limitation of this study is the lack of detailed underresponsivity measures. Research on sensory subgroupings within ASD (
33) suggests a subgroup with severe mixed hypo- and hyperresponsivity, consistent with our high-SOR group having the highest scores on both SOR and underresponsivity. Other subgroups include mild hyporesponsivity and mild hyperresponsivity (
33), consistent with our low-SOR group, which shows lower SOR and underresponsivity scores than the high-SOR group, but still higher than typical. Therefore, the high- and low-SOR groups may actually be better characterized as severe and mild sensory groups; research that includes more in-depth hyporesponsivity measures and observational sensory measures can better characterize these groups. Given the relatively small sample size in the present study, replication with a larger sample is necessary both to confirm the results and to characterize potentially mixed profiles within the low-SOR group.
Additionally, future research should address the effect of development on SOR and its neural correlates; age-related increases in prefrontal regulation of the amygdala could underlie age-related decreases in SOR seen in some individuals with ASD (
34).
Conclusions
Taken together, our results indicate that in ASD, sensory habituation is a dynamic, time-varying process dependent on sustained regulation across time, which is specifically impaired in children and adolescents with ASD with high SOR. However, those with ASD with low SOR also show distinct, nontypical response patterns, including increased prefrontal regulation and reduced reactivity to new stimuli. These results validate the need for further research testing personalized interventions for SOR; while our findings indicate that sensory processing is atypical across most children and adolescents with ASD, different subgroups show distinct profiles that go beyond simple over- or underresponsivity classifications. Accordingly, exposure therapy could be more effective for low-SOR individuals, who show ability to down-regulate, than for high-SOR individuals, who cannot maintain down-regulation and may be better served by building top-down coping strategies. However, exposure therapy for low-SOR individuals may need to be paired with interventions that enhance the salience of novel cues and prevent overregulation.
Acknowledgments
The authors were also supported by the following training grants/fellowships: a National Research Service Award postdoctoral fellowship to Dr. Green (F32 MH105167), a National Institute of Neurological Disorders and Stroke (NINDS) pre-/postdoctoral training grant (F99 NS105206) to Dr. Hernandez, a National Institute of Child Health and Human Development predoctoral fellowship (F31 HD088102) to Ms. Liu, a NINDS institutional training grant (T32NS048004) and a National Research Service Award predoctoral fellowship (F31MH110140) to Ms. Lawrence, fellowships from the Roche/ARCS Foundation Scholar Award Program in the Life Sciences to Ms. Lawrence and Ms. Liu, and a National Research Service Award predoctoral fellowship (F31HD090937) to Dr. Tsang.
This research was conducted in part under the auspices of the Help Group–UCLA Autism Research Alliance, which contributed to participant recruitment.
