Abstract

Objective:

The authors sought to study the transcriptomic and genomic features of completed suicide by parsing the method chosen, to capture molecular correlates of the distinctive frame of mind of individuals who die by suicide, while reducing heterogeneity.

Methods:

The authors analyzed gene expression (RNA sequencing) from postmortem dorsolateral prefrontal cortex of patients who died by suicide with violent compared with nonviolent means, nonsuicide patients with the same psychiatric disorders, and a neurotypical group (total N=329). They then examined genomic risk scores (GRSs) for each psychiatric disorder included, and GRSs for cognition (IQ) and for suicide attempt, testing how they predict diagnosis or traits (total N=888).

Results:

Patients who died by suicide by violent means showed a transcriptomic pattern remarkably divergent from each of the other patient groups but less from the neurotypical group; consistently, their genomic profile of risk was relatively low for their diagnosed illness as well as for suicide attempt, and relatively high for IQ: they were more similar to the neurotypical group than to other patients. Differentially expressed genes (DEGs) associated with patients who died by suicide by violent means pointed to purinergic signaling in microglia, showing similarities to a genome-wide association study of Drosophila aggression. Weighted gene coexpression network analysis revealed that these DEGs were coexpressed in a context of mitochondrial metabolic activation unique to suicide by violent means.

Conclusions:

These findings suggest that patients who die by suicide by violent means are in part biologically separable from other patients with the same diagnoses, and their behavioral outcome may be less dependent on genetic risk for conventional psychiatric disorders and be associated with an alteration of purinergic signaling and mitochondrial metabolism.
Suicide is the 10th ranking cause of death in the United States for all age groups combined, and the second for younger samples; the rising trend in recent years may be worsening as a result of the ongoing pandemic (1). Aside from collateral antisuicide effects of lithium (2) and clozapine (3), both underused medications, pharmacologic treatments specific to suicide do not exist, and medications mostly rely on targeting psychiatric disorders that are risk factors. However, death by suicide in the absence of identifiable psychiatric disorders is not rare (4, 5), and most patients with psychiatric conditions at high risk do not actually die by suicide. Notably, suicidal behavior aggregates in families, independent of the transmission of those high-risk disorders (6). Further, suicidal behavior has been linked with biological features and risk factors not necessarily shared by psychiatric disorders associated with it (5, 7, 8). In this regard, severe anxiety/agitation and poor impulse control may be better predictors of suicide plans and attempts than the presence of a psychiatric diagnosis (9). Suicidal behavior has therefore been proposed as a diagnostic entity in the classification of mental disorders (5, 7), although this is a matter of ongoing debate. Contrasting the biology of suicide patients with that of nonsuicidal patients with similar psychiatric diagnoses, and separately with neurotypical control subjects not affected by mental illness, may be a way forward to elucidate molecular mechanisms underlying the choice of suicidal behavior.
In addition to recent popular genetic approaches leveraging sample size (e.g., genome-wide association studies), attention to stratifying the clinical phenotype can increase the power to detect genomic effects in psychiatric conditions (10). Suicide is not a unitary entity and involves complex biological and psychosocial determinants, in which a particular mental state motivates and accompanies an extreme and definitive behavior; the biological readout of the emotional intensity of this final disposition might be observable in postmortem brain tissue. Indeed, it has been argued that risk factors for suicide include those for suicidal ideation and those for progression to the actual behavior (11). Suicidal ideation factors account more for the motivational phase (the development of the intention or desire to die), and the latter for the volitional phase (the enactment of that intention). Aggression is among the critical moderators of the shift from suicidal ideation to action (12); notably, violence against the self and violence against others show a shared association (13).
In principle, the decision to kill oneself using a violent method is less likely to be reversible, implicating suicide methods (14) that employ relatively high levels of aggression as potential hallmarks of individuals who do this. The state of mind of those individuals, as they employ violent methods, is reasonably expected to differ from those who choose nonviolent methods; this has been related to altered decision making (15, 16). Thus, the investigation of how suicide was performed might translate into a less heterogeneous readout in the biology fixed in the brain at death. Further supporting the distinction of suicide by violent or by nonviolent means, we reported in two independent studies (14, 17) association of expression of a single gene, LINC01268, specifically with suicide by violent means. A genotype associated with relatively increased expression of LINC01268 in the brain was also linked to emotional regulation and aggressive behaviors even in living individuals not engaged in suicidal behaviors or thoughts.
In this study, we investigated gene expression in suicide decedents with RNA sequencing in the dorsolateral prefrontal cortex (DLPFC), a brain area that has been associated with behavioral regulation in general (18), with aggression control in particular (19), and with suicide and aggressive behavior in our previous hypothesis-driven single-gene-level study (14). Our findings suggest that completed suicides by violent means may be in part dissociable transdiagnostically, with the differentially expressed genes (DEGs) implicating purinergic signaling and showing similarities to a genome-wide association study (GWAS) of a Drosophila aggression model (20). We measured genomic risk scores for each of the psychiatric disorders included in the sample, as well as for cognition and for suicide attempt, and tested how they predict diagnosis or traits in patients who died by suicide with violence compared with other patients and control subjects. Finally, we used weighted gene coexpression network analysis (WGCNA) to test for gene coexpression modules and module interactions specifically associated with suicide by violent means. Our data suggest that the genomic profiles of risk of suicide by violent means are not consistent with their primary psychiatric diagnoses, and that their DEGs may operate in the context of a unique energetic metabolism configuration that sets them apart from the other individuals.

Methods

Postmortem Data: RNA sequencing

Study subjects.

Samples were obtained from the Lieber Institute postmortem RNA sequencing (RNA-seq) data set (21, 22). Of the brain regions available in our repository and linked to aggression, the DLPFC (Brodmann area [BA] 46/9) afforded us the largest N for the analysis. As in our previous study (14), only samples with RNA integrity number (RIN) ≥6.9 were used. The samples include tissue from donors of European ancestry (affected with schizophrenia, major depression, or bipolar disorder) ≥13 years of age, to minimize effects on gene expression based on associations with ancestry or early developmental stages (23). This cohort of brains has been described in detail in our previous single-gene study (14), with the difference that two samples have been dropped after further quality control. Indeed, after the hg38 realignment (see below) of our RNA-seq data using SPEAQeasy (24), these two samples did not satisfy inclusion criteria based on identity matching between genotypes from DNA genotyping and genotypes inferred from RNA variant calling. These criteria are based on a set of common expressed variants that can be inferred by both DNA and RNA, from which a correlation matrix can be computed to identify sample swaps (24). The resulting sample of 226 includes nonsuicide and suicide patients. Additionally, the samples in this study include a group of nonsuicide control subjects not affected with mental disorders (the neurotypical group) from the same repository with similar characteristics (BA 46/9, of European ancestry, age ≥13 years; N=103), who mostly died by natural death. Detailed information on the samples is provided in Table S1 in the online supplement.

Postmortem brain tissue.

Methods of collection followed an established protocol that has been reported elsewhere (21, 22). Briefly, gray matter tissue from the crown of the middle frontal gyrus was obtained from the coronal slab corresponding to the middle one-third immediately anterior to the genu of the corpus callosum; subcortical white matter was carefully trimmed from the area immediately below the middle frontal gyrus (22). Total RNA was extracted from ∼100 mg of homogenate DLPFC gray matter tissue, using the RNeasy kit (Qiagen) according to the manufacturer’s protocol.

Manner of death and suicide.

All case narratives were reviewed to establish the degree of violence associated with suicide deaths; the decision is not based on preset categories, but rests on the evaluation of all circumstances. Briefly, a suicide by violent means is a suicide where self-harm with lethal intent is carried out by causing likely painful injuries; examples are hanging, gunshot, blunt force, sharp force, jumping from heights, self-imposed motor vehicle accident, and so on. A suicide by nonviolent means consists of actions that are more “physiological,” such as swallowing or breathing something that is not painful at that moment (i.e., drug overdose, carbon monoxide), hence does not require the individual to produce injuries on their body to die. However, we do not adhere to fixed labels (e.g., “poisoning”=always nonviolent, others=always violent), but we consider the circumstances of each suicide. Examples of suicide cases (asphyxia, drowning, etc.) that can fall in either category were detailed in our previous study (14), together with the methods employed in our sample. All diagnoses and decisions about manner of suicide were determined blind to any of the molecular data.

Gene expression.

As in our previous study (14), we analyzed BrainSeq PhaseI poly(A)+ library data (21, 25). RNA extraction and sequencing have been described previously (21, 25); in the present work, data were revised by aligning reads to the human genome UCSC hg38 build (26). We additionally performed quantitative polymerase chain reaction (qPCR) to validate the differential expression (DE) of a selected set of DEGs.

Differential expression across manners of death.

We fitted a main model to test association of suicide with gene expression, adjusting for quality surrogate variables (qSVs) (27) accounting for RNA quality based on an experimental paradigm (described in the next subsection), sex, and age as follows:
where PCs are principal components (qSVs), and the four groups in the model were classified as 1) nonsuicide patients with psychiatric disorders (“nonsuicide patients,” N=99); 2) patients with psychiatric disorders who died by suicide by nonviolent means (“nonviolent suicide patients,” N=50); 3) patients with psychiatric disorders who died by suicide by violent means (“violent suicide patients,” N=77); each compared with the baseline condition of 4) nonsuicide individuals not affected by psychiatric disorders (the “neurotypical group,” N=103) and between each other. A sensitivity analysis fitting a model that excluded the neurotypical group, using nonsuicide patients as baseline condition, was done in order to also adjust for diagnosis as a potential confounder (see the online supplement), as follows:
In the DE analyses, after removing low-expressed genes (mean reads per kilobase million [RPKM] <0.17) using the expression_cutoff function in segmented, we performed voom normalization in the Limma package (28), and we then used the lmTest and ebayes functions in the package to fit the statistical models to estimate log2 fold changes, moderated t-statistics, and corresponding p values. We extracted statistics of the different coefficients of interest, and we employed the function makeContrasts for further comparisons.
Multiple-testing correction via the false discovery rate (FDR) was applied using the set of expressed genes (23,346 genes). All DEG results shown in this report are FDR<0.05.

RNA quality correction.

In addition to selecting only samples with RIN ≥6.9, we estimated and removed from the DE analysis potential further biases of RNA quality by using quality surrogate variable analysis (qSVA). This method (27), developed using data from RNA degradation experiments, has been shown to improve rates of replication in DEG analyses across postmortem human brain studies. The qSVA model approach and its implementation have been described in detail elsewhere (25, 27). Principal component analysis was performed on the log2-transformed degradation matrix (with an offset of 1) and the top nine principal components were selected using the Buja and Eyuboglu (BE) algorithm, and extracted. The set of these principal components (i.e., quality surrogate variables, qSVs) was included as adjustment variables in DE analyses. Six principal components were selected and included in DE analysis that fit the sensitivity analysis model, based on the BE algorithm output on this subset. We note that such qSVs are also highly correlated with pH in our sample: this further excludes the possibility that DE results may be confounded by different agonal states, of which pH may be considered a proxy, as a marker of terminal hypoxia. Additionally, qSVs are also highly correlated with RIN and postmortem interval, as shown in Figure S1 and Table S2 in the online supplement).

Gene ontology.

The list of DEGs generated in each contrast, and the genes in each WGCNA module, were analyzed through the Gene Ontology (GO) Consortium toolkit (29) against a custom background of all genes expressed in the DE model. We chose a p value calculation based on the FDR method of accounting for multiple testing, as provided by the Consortium. We complemented this analysis with an upstream regulator analysis in IPA (Ingenuity Systems; Qiagen China Co.) against a background of genes expressed in the CNS provided by the tool. The GO Consortium toolkit (29) was also employed for enrichment on the list of genes linked to Drosophila aggression, against the related background.

Cellular proportion deconvolution.

Deconvolution was performed with the ReferenceBasedDecomposition function from the R package BisqueRNA, version 1.0.4 (30), using the use.overlap=FALSE option. The single-cell reference data set used was single-nucleus RNA-seq from the 10X Genomics protocol, which includes tissue from eight donors and five brain regions (31). The nine cell types considered in the deconvolution of the tissue were astrocytes, endothelial cells, microglia, mural cells, oligodendrocytes, oligodendrocyte progenitor cells, T cells, excitatory neurons, and inhibitory neurons. Marker genes were selected by first filtering for genes common between the bulk data and the reference data, then calculating the ratio of the mean expression of each gene in the target cell type over the highest mean expression of that gene in a nontarget cell type. The 25 genes with the highest ratios for each cell type were selected as markers, from which estimates of cellular proportion were derived as described in reference 32.

Postmortem Data: Genomic Risk Scores

Study subjects.

Samples were obtained from the Lieber postmortem repository for the calculation of polygene or genomic risk scores (GRSs) (21). This cohort, an extension of the expression data set with less than one-third of subjects overlapping, includes 895 samples (888 samples after removing extreme outliers for the studied GRSs) from donors who were control subjects of European ancestry (i.e., neurotypical individuals: nonsuicide, not affected with mental disorders, N=247) or patients (nonsuicide or suicide, affected with schizophrenia, N=147; major depression, N=310; or bipolar disorder, N=184) ≥13 years of age, similarly to the RNA-seq cohort. The samples were classified for suicide and suicide methods similarly to the DE data set (see Table S1 in the online supplement). Of note, while the DE analysis does not warrant dividing patients within diagnostic groups for statistical power issues, we did each GRS analysis in the appropriate diagnostic group.

Genotyping.

Genomic DNA was extracted from cerebellum of the same samples using standard procedures with FlexiGene DNA kits (Qiagen, Germany). Genotyping was performed as previously described (21, 33, 34), and an independent set of single-nucleotide polymorphisms (SNPs) obtained by linkage disequilibrium (LD) pruning (35) was used to perform genome-wide clustering to obtain multidimensional scaling components for quantitative measures of ancestry. We removed SNPs that had a genotype missing rate >10%, deviation from Hardy-Weinberg equilibrium (p<1e−06), or minor allele frequency <0.05%. Additional quality control was performed on individual genotyping results. Individuals were removed if their overall genotyping rate was below 97%. The data were checked for sample duplications and cryptic relatedness.

Derivation of GRSs.

GRSs (also known as polygenic risk scores or PRSs) (36) were calculated for each individual, using summary statistics of GWASs for each diagnosis or trait under consideration, as described elsewhere (37). In brief, GRSs are a measure of cumulative genomic risk (36), calculated as the sum of alleles weighted by the corresponding effects for the diagnosis or trait identified by the respective GWAS (i.e., schizophrenia [38], schizophrenia resilience [39], major depression [40], bipolar disorder [41], IQ [42], and suicide attempt [43] GWASs). Consistent with the standard procedure for GRS calculation (37, 38), only autosomal SNPs were included in the analysis, to prevent bias related to sex. We performed an LD clumping of the SNPs by removing variants that had r2≥0.1 with the index SNP within 500 kb, as reported elsewhere (37, 38). We multiplied beta or the natural log of the odds ratio of each index SNP, obtained from the respective GWAS, by the imputation probability for the effective allele of each index SNP, and summed the products over all index SNPs. For each diagnosis or trait, ten GRSs (GRS1–GRS10) were calculated using subsets of SNPs selected according to the GWAS p value thresholds of association with each disorder: 5e−08 (GRS1), 1e−06 (GRS2), 1e−04 (GRS3), 0.001 (GRS4), 0.01 (GRS5), 0.05 (GRS6), 0.1 (GRS7), 0.2 (GRS8), 0.5 (GRS9), and 1 (GRS10). SNPs in sets with lower p values are also in sets with higher p values (for example, SNPs in GRS1 are included in GRS2, SNPs in GRS2 are included in GRS3, and so on). GRS6 was employed in the analyses in this report, following previous evidence (38) that it has the highest accuracy in predicting the respective disease or trait.

Postmortem Data: WGCNA

Weighted gene coexpression network analysis was performed on the residuals from the linear model used in the DE analysis that accounted for death modality and removed the unwanted variance associated with age, sex, and qSVs, as previously described (67, 68). For this purpose, we fitted a model through the cleaningY function (https://github.com/LieberInstitute/jaffelab), by which the variable 4Groups was protected (estimated, but not marginalized), whereas variance explained by the other variables (age, sex, qSVs) was removed. A coexpression network from the expression residuals calculated as explained above was constructed for all 329 samples by using a standard WGCNA pipeline, as previously described (44, 45). Briefly, we computed gene pairwise correlations (method bi-weight), and adjacency matrices (parameters: β power=4, estimated with the sft function, network type signed hybrid), and detected modules of coexpressed genes with hierarchical clustering (cutreeDynamic function, parameters: minimum module size=20, merge cut height=0.15, pam stage=TRUE). We calculated module eigengenes for the detected modules with a WGCNA routine (https://cran.r-project.org/web/packages/WGCNA/WGCNA.pdf) that implements a singular value decomposition algorithm. We used module eigengenes in comparisons between the main groups and in pairwise correlations (i.e., module eigengene network analysis [46]) moderated by the death modality (4Groups).
See the online supplement for details on additional statistical analyses.

Results

A Brain Transcriptional Landscape Related to Suicide Method

The comparison of nonsuicide patients with the neurotypical group yielded 80 DEGs (34 down and 46 up in nonsuicide patients) (Figure 1A); there was no significant GO term enrichment for these genes (see Table S3A in the online supplement). The comparison of nonviolent suicide patients with the neurotypical group yielded 362 DEGs (149 down and 213 up) in nonviolent suicide patients (Figure 1B), with the genes up-regulated being 6.74-fold enriched for the Huntington disease pathway (i.e., P00029, FDR=0.05; see Table S3B). The comparison of nonviolent suicide patients with nonsuicide patients yielded 44 DEGs (21 down and 23 up in nonviolent suicide patients) (Figure 1C), and there was no significant GO enrichment for these genes (see Table S3C).
FIGURE 1. Differential expression analysis from the comparison of nonsuicide, nonviolent suicide, violent suicide patients, and neurotypical individualsa
a The figure presents volcano plots of the differentially expressed genes (DEGs) in dorsolateral prefrontal cortex (RNA sequencing) obtained comparing nonsuicide patients with neurotypical individuals (panel A), nonviolent suicide patients with neurotypical individuals (panel B), nonviolent suicide patients with nonsuicide patients (panel C), violent suicide patients with neurotypical individuals (panel D), violent suicide patients with nonsuicide patients (panel E), and violent suicide patients with nonviolent suicide patients (panel F). DEGs at FDR<0.05 are shown in red, and the top DEGs are labeled with the gene name. All the statistics were obtained from the DE analyses using a linear model adjusting for sex, age, and quality surrogate variables accounting for RNA quality.
In contrast, the comparison of violent suicide patients with the neurotypical group identified only eight DEGs (three down and five up in violent suicide patients) (Figure 1D), and there was no significant GO enrichment for these genes (see Table S3D). The comparison of violent suicide patients with nonsuicide patients yielded 189 DEGs (67 down and 122 up in violent suicide patients) (Figure 1E); there was no significant enrichment for the down-regulated DEGs, while the analysis of the up-regulated DEGs returned several terms of enrichment (see Table S3E). Specifically, analysis of these DEGs showed a robust enrichment for biological and molecular processes involving the G protein-coupled purinergic nucleotide receptor signaling pathway (GO:0035589, 76.5-fold enrichment at FDR=0.01) and activity (GO:0045028, 76.5-fold enrichment at FDR=0.003). DEGs overlapping these terms include P2RY12, P2RY13, GPR34 (a paralog of P2RY14), and PTAFR; notably, P2RY13 and P2RY12 are in the top 10 DEGs in this contrast. P2RY13 and P2RY12 have previously been shown to be the most highly correlated genes with LINC01268, the gene highlighted in our previous studies (14, 17). In addition, the top DEG in this contrast was LINC00996 (FDR=3.80E−06), a long noncoding RNA, which is transcribed from a locus on chr7 with GWAS-significant association with brain oscillatory activity (47). In this locus, LINC00996 flanks several GTPase, IMAP family genes (GIMAP), some of which have previously been linked to completed suicide cases within high-risk families, regardless of co-occurring psychopathology (48). GIMAP6 and GIMAP8 were also DEGs in this contrast.
The most dramatic differences in DEG analyses involved the comparison of violent suicide patients against nonviolent suicide patients, yielding 843 DEGs (417 down and 426 up in violent suicide patients) (Figure 1F). The DEGs with greater expression in nonviolent suicide patients showed enrichment for terms related to GTP binding (including binding of purine nucleoside and nucleotide) and, again, Huntington disease (5.49-fold enriched at FDR<0.0007) as well as cytoskeletal proteins related to Huntington disease, i.e., tubulin (PC00228, 22.05-fold enriched at FDR<0.00003; see Table S3F in the online supplement). The analysis for DEGs with greater expression in violent suicide patients again showed robust enrichment for terms regarding the G protein-coupled purinergic nucleotide receptor activity (GO:0045028, 26.08-fold enrichment at FDR=0.03), produced by the same top DEGs that emerged in the previous contrast (P2RY12, P2RY13, GPR34, PTAFR) with the addition of P2RY14. LINC00996 was again among the top DEGs (FDR=0.0003), and several GIMAP isoforms in its locus were DE as well: GIMAP6, GIMAP7, GIMAP2, GIMAP1, and GIMAP4 (all of them previously linked to completed suicide cases regardless of psychopathology [48]), plus GIMAP8, although at FDR=0.08. The upstream regulator analysis revealed a consistent inhibition of EIF4E, a translation regulator, in the violent suicide condition.
Overall, these results suggest that at least at the transcriptional level in DLFPC, patients who die by suicide by violent means are clearly separable from patients with analogous psychiatric conditions who do not die by suicide as well as from patients who die by suicide by nonviolent means. Additionally, nonviolent suicide patients are minimally different in these analyses from nonsuicide patients; this and the other results are strengthened in sensitivity analyses performed in a patient-only design, adjusting for diagnosis (see Figures S2A,B in the online supplement). In contrast, these data show that patients who die by suicide by violent means are relatively less differentiated from neurotypical individuals, as very few DEGs emerge in the comparison between these two groups. Figures 2A–E graphically display these data in regard to the expression of the purinergic genes and of LINC00996; Table S4A–F in the online supplement contains full results of DE for each contrast. Finally, we validated these principal results with qPCR (see Figure S3 in the online supplement).
FIGURE 2. Transcriptional differences between groups of the top DEGs in violent suicidea
a Box plots of expression of the purinergic genes (panels A–H) and of LINC00996 (panels I and J) in the combined patient sample (left) and by diagnosis (right). DEGs=differentially expressed genes; Neurotypical=nonsuicide control subjects; nS-pt=nonsuicide patients; nvS-pt=nonviolent suicide patients; vS-pt=violent suicide patients; BP=bipolar disorder; MD=major depressive disorder; SZ=schizophrenia; RPKM=reads per kilobase million. The purinergic genes and LINC0096 are consistently up-regulated in patients who died of suicide by violent means and in neurotypical individuals, compared with other patients, in each diagnostic group.
Additional sensitivity analyses (see the online supplement) excluded length of illness (as a proxy of illness severity), minor age, brain trauma (see Table S5 and Figure S4A,B in the online supplement), and exposure to various substances, per toxicological screening (see Figure S5A,B in the online supplement), as well as to potential therapeutics as potential confounders, or interacting factors, in these results. Table S3H in the online supplement summarizes the DE statistics (contrast of violent suicide patients against nonsuicide patients, and against nonviolent suicide patients) for the main genes of interest as well as the enrichment of the purinergic related terms, in each sensitivity analysis.
Finally, analysis performed separately by sex suggests that the DEGs may be driven by the male sample, although in the absence of a significant interaction with sex, a larger female sample would be necessary for a firm conclusion (see Figure S6 in the online supplement).

Evidence of a Linear Continuum of Gene Expression in the Context of Suicide

Because the results indicate a higher number of DEGs when contrasting violent suicide patients with other patients, rather than with neurotypical individuals, we further explored the transcriptomic divergence between the four groups. Specifically, we analyzed how differences in gene expression between these four groups were related, also using a threshold-free algorithm for detecting and visualizing overlap trends between gene expression profiles (49) (see the section “Violent suicide patients are less differentiated from neurotypical individuals than from other patients in DEGs” in the online supplement).
The analysis shows that the genes up-regulated in violent suicide patients compared with nonsuicide patients tended also to be up-regulated in violent suicide patients compared with the neurotypical group (see Figure S7A,B,G in the online supplement), and in the neurotypical group compared with nonsuicide patients (see Figure S7C,D,H); the same was true for the down-regulated DEGs (see Figure S7A–D,G,H). These results support the intriguing possibility that at a transcriptional level in DLPFC, the neurotypical condition lies between nonsuicide patients and violent suicide patients. In addition, the genes up-regulated in violent suicide patients compared with nonviolent suicide patients tended also to be up-regulated in nonsuicide patients compared with nonviolent suicide patients and vice versa (see Figure S7E,F,I). In other words, these results suggest that the nonviolent suicide patient and the violent suicide patient conditions represent the opposite tails of a potential continuum of gene expression in DLPFC.
To test this possibility more directly, we investigated whether gene expression changed linearly from nonviolent suicide to nonsuicide patients to neurotypical individuals to violent suicide patients. We modeled a linear relationship between gene expression and an ordinal variable, where the four conditions of nonviolent patient, nonsuicide patient, neurotypical individual, and violent suicide patient were coded respectively as 0, 1, 2, and 3. Remarkably, we found that 936 genes were significantly (FDR<0.05) associated with the ordinal scale: in particular, 493 genes showed a linear increase and 443 genes a linear decrease of gene expression from nonviolent suicide to nonsuicide patients to neurotypical individuals to violent suicide patients. The genes with a significant linear increase of expression included LINC00996, the top DEG lincRNA in violent suicide patients, and, notably, the genes driving the enrichment for purinergic signaling associated with suicide by violent means. Indeed, the genes with linearly decreasing expression were significantly enriched for the Huntington disease pathway and related terms, while the genes with linearly increasing expression were significantly enriched for the G protein-coupled purinergic nucleotide receptor signaling pathway and activity (i.e., top term of enrichment at 23.36-fold; see Table S3G in the online supplement).
Taken together, these findings further support the conclusion that violent and nonviolent suicides are considerably different in DLPFC gene expression, defining the opposite tails of a transcriptional continuum in the samples we studied. However, we cannot exclude the possibility that acute ingestion of large quantities of one or more toxicants by the nonviolent suicide patients affected their brain levels of gene expression. Conversely, the violent suicide cases do not pose this risk, so the observation remains that those genes that are less expressed in nonsuicide patients compared with neurotypical individuals are more expressed in violent suicide patients compared with nonsuicide patients (see Figure S7C,D,H in the online supplement), and marginally more expressed (i.e., at a genome-wide marginal level of significance) in violent suicide patients compared with neurotypical individuals (see Figure S7A,B,G) and vice versa (see Figure S7A–D,G–H).

Cellular Deconvolution

We performed deconvolution to test for potential differences between groups in the estimated proportion of nine cell types. The analysis shows a relative reduction in the estimated proportion of oligodendrocyte progenitor cells in violent compared with nonviolent suicide (see Figure S8 in the online supplement); however, the DE results were not affected by cellular composition (see Figure S9 in the online supplement).

Drosophila Aggressive Behavior

Because suicide by violent means has been associated with aggression (14, 17, 50, 51), we compared our data on suicide by violent means with two GWAS analyses of aggressive behavior in inbred and selected outbred strains of D. melanogaster (20). A total of 473 Drosophila genes were associated with aggressive behavior in theses analyses, of which 298 had human orthologs with DIOPT (52) scores >3. The genes implicated in the Drosophila GWAS analyses were enriched for many GO terms related to the purinergic pathway (the top terms are listed by fold enrichment in Table S3I in the online supplement), remarkably consistent with our results in human brain. We also explored GWAS data on aggression in other animals, such as chickens (53) and dogs (53), but were unable to confirm purinergic-specific signaling in the gene lists based on those studies. However, it is of note that those studies employed animals that were outbred or only partially inbred, and involved diverse phenotypes and underpowered sample sizes.

Divergence in Genomic Risk Between Patients Who Died by Suicide by Violent Means and Patients With Similar Diagnoses

The transcriptome analyses show that suicide by violent means represents a potentially distinct clinical group, at least in terms of displaying a profile of gene expression that is different from nonsuicide and nonviolent suicide patients with similar diagnoses. We therefore investigated whether these expression differences were reflected at the genome level by analyzing GRSs for each of the psychiatric disorders in the patient samples, and for other traits associated with suicide (see Table S1 in the online supplement for sample details).

GRS in patients with schizophrenia.

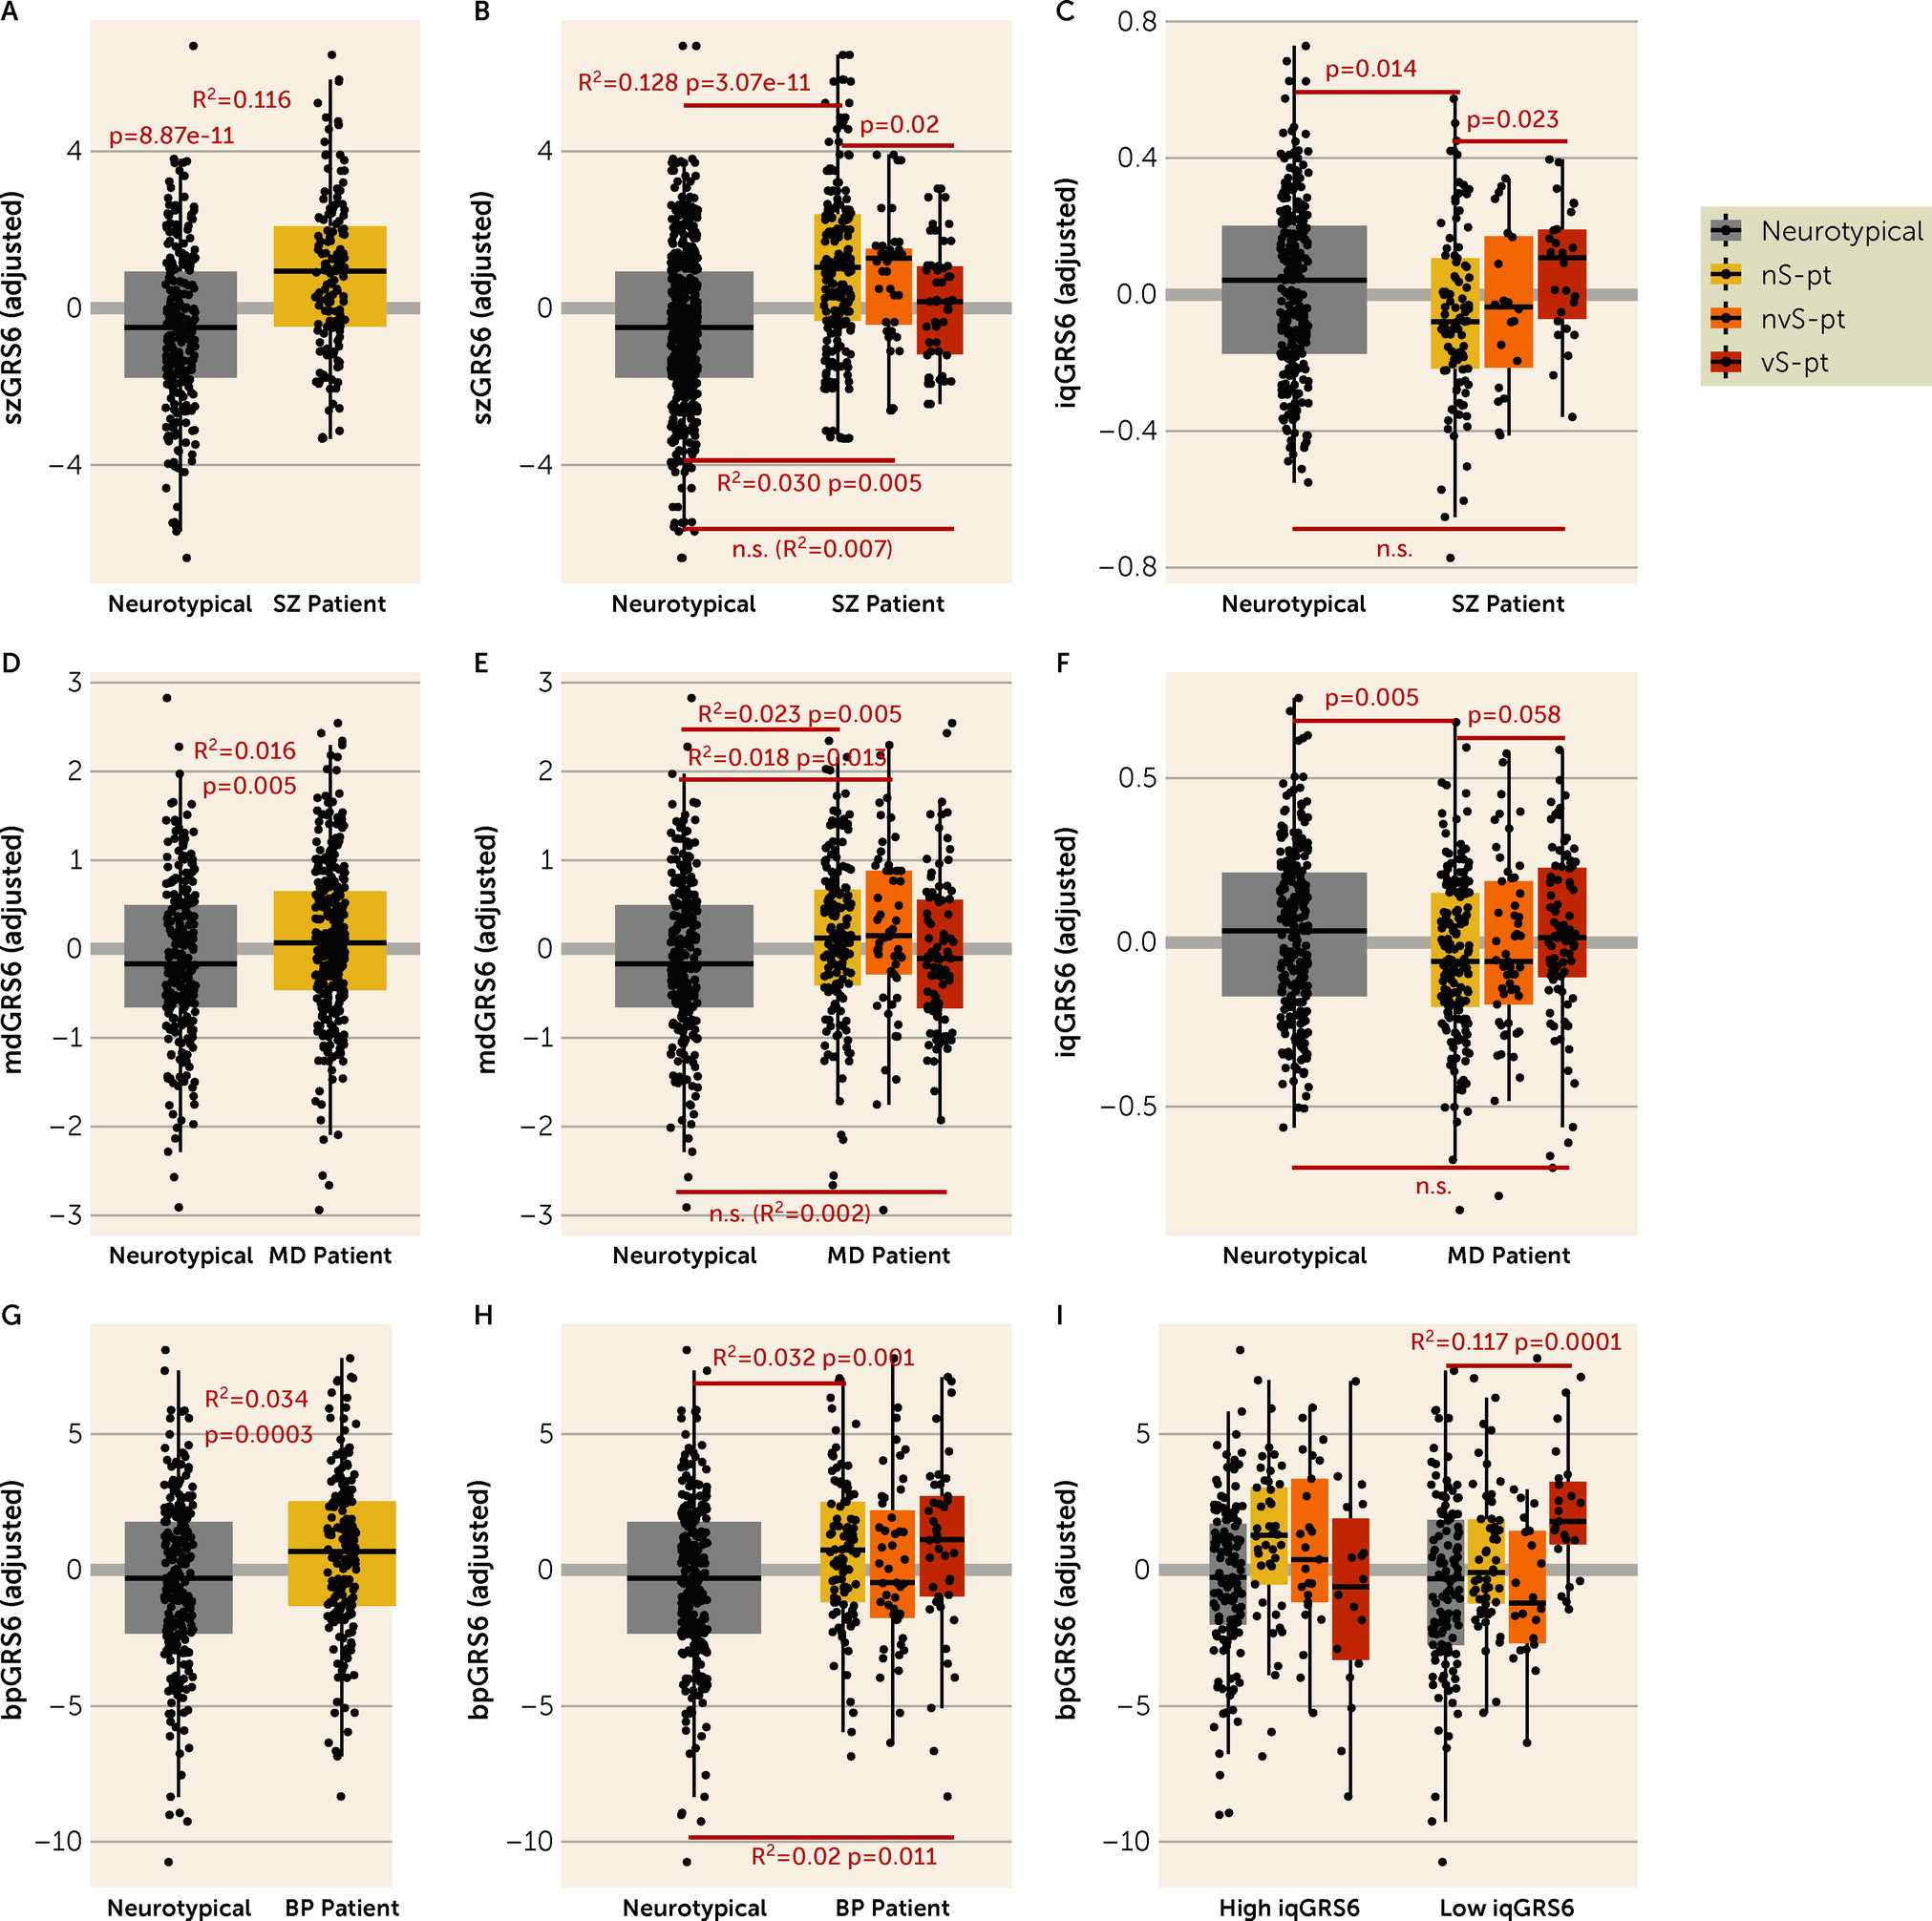
As expected, the schizophrenia GRS calculated from the latest GWAS data (38), and with a GWAS p value threshold of 0.05, was significantly higher in all patients affected with schizophrenia (N=147) compared with neurotypical individuals (N=247) (t=6.673, p=8.87e−11), and the variance of case-control status explained by schizophrenia GRS at this p value threshold was 11.6% (Figure 3A). When patients with schizophrenia were divided into the three subsets of patients related to suicide (nonsuicide, nonviolent suicide, and violent suicide), nonsuicide patients and nonviolent suicide patients had higher schizophrenia GRS compared with neurotypical individuals (respectively, t=6.847, p=3.07e−11, and t=2.820, p=0.005). However, the scores for violent suicide patients were not significantly different from those for the neurotypical group (t=1.429, p=0.154) and were significantly lower than those for nonsuicide patients with the same diagnosis (t=−2.311, p=0.021) (Figure 3B). Indeed, schizophrenia GRS was significantly associated with case-control status when considering only nonsuicide cases, and it explained 12.8% of the variance of case-control status. The variance of case-control status was down to 3% when nonviolent suicide cases were considered. When only violent suicide cases were considered, schizophrenia GRS was not associated with case-control status, as it explained only 0.7% of the variance. In other words, the liability of schizophrenia explained by the schizophrenia GRS was more than 18 times higher in nonsuicide patients compared with violent suicide patients, and more than 4 times higher in nonviolent suicide patients compared with violent suicide patients. These results were not affected by the inclusion or exclusion of patients with schizoaffective disorder (see the online supplement). These data echo the transcriptomic analysis in suggesting that patients with schizophrenia who died by suicide by violent means are different in terms of genomic risk for their own given diagnosis compared with other patients with schizophrenia.
FIGURE 3. Analysis of genomic risk by diagnosis and across groupsa
a Box plots of the relationship between genomic risk scores (GRSs) for diagnosis and IQ and case-control status in each of the three diagnostic groups: schizophrenia (SZ), major depression (MD), and bipolar disorder (BP). GRS values are those calculated from single-nucleotide polymorphisms that were significant at a p value of 0.05 in genome-wide association studies (GRS6; see the main text). Panels A–C are based on the subsample of neurotypical individuals and patients with schizophrenia (SZ): panel A shows GRS for schizophrenia (szGRS6) and schizophrenia case-control status, panel B shows GRS for schizophrenia case-control status, with schizophrenia patients divided into the three manner-of-death categories (nonsuicide patients [nS-pt], nonviolent suicide patients [nvS-pt], violent suicide patients [vS-pt], and panel C shows GRS for IQ (iqGRS6) and schizophrenia case-control status, with schizophrenia patients divided into the three categories. Panels D–F are based on the subsample of neurotypical individuals and patients with major depression: panel D shows GRS for major depression (mdGRS6) and major depression case-control status, panel E shows GRS for major depression case-control status, with major depression patients divided into the three categories, and panel F shows GRS for IQ and major depression case-control status, with major depression patients divided into the three categories. Panels G–I are based on the subsample of neurotypical individuals and patients with bipolar disorder: panel G shows GRS for bipolar disorder (bpGRS6) and bipolar disorder case-control status, panel H for bipolar disorder case-control status, with bipolar disorder patients divided into the three categories, and panel I for the interaction between bipolar disorder GRS6 and IQ GRS6 on bipolar disorder case-control status, with patients divided into the three categories. See the main text for comment and detailed statistics. All the statistics were generated using multiple logistic regression (panels A, B, D, E, G, and I) and multiple regression (panels C and F), adjusting for population stratification (10 principal components), sex, and age.
In light of these results, we considered that an additional insight to risk for a disease is how some people avoid illness despite other risk factors. Since variants associated with schizophrenia resilience are not significantly associated with risk (39), we tested how suicide patients with schizophrenia behave in terms of schizophrenia resilience GRS. Consistent with what we obtained with schizophrenia GRS, we found that resilience GRS was significantly higher in violent suicide patients compared with neurotypical individuals (t=2.034, p=0.043), with a similar trend in violent suicide patients compared with nonviolent suicide patients (t=1.704, p=0.089), while there were no other significant comparisons across the other various groups (see Figure S10 in the online supplement).
Because cognitive impairment is a relevant feature of schizophrenia risk and illness (54), and cognition may be relevant to suicide, we investigated differences in GRS for IQ (42) between groups. We found that while IQ GRS was significantly lower in nonsuicide schizophrenia patients compared with neurotypical individuals (t=−2.469, p=0.0140), there were no significant differences in IQ GRS between neurotypical individuals and violent suicide schizophrenia patients (t=1.042, p=0.2982), who indeed had higher IQ GRS compared with nonsuicide patients (t=2.282, p=0.0230) (Figure 3C). There was no significant difference in IQ GRS between nonviolent suicide patients and the other groups, although this may be a statistical power issue. Although IQ GRS was inversely correlated with schizophrenia GRS (r=−0.1708447, p=0.0007), we found consistent results (see Figure S11 in the online supplement) in additional analyses of IQ GRS adjusting for schizophrenia GRS.

GRS in patients with major depression.

Similarly to the schizophrenia GRS, the GRS for major depression (40) was significantly, although modestly, higher in all patients affected with major depression (N=310) compared with the neurotypical group (N=247). The variance of case-control status explained by major depression GRS was 1.6% when we considered the whole group of patients with this diagnosis (t=2.839, p=0.0047) (Figure 3D). However, when they were divided into the three subsets (nonsuicide, nonviolent suicide, and violent suicide), major depression GRS was significantly associated with case-control status only when we considered nonsuicide cases (t=2.803, p=0.005) and nonviolent suicide cases (t=2.485, p=0.013), but not when we considered violent suicide patients, whose depression GRSs were not significantly different from those of the neurotypical group (t=0.867, p=0.38646) (Figure 3E). Indeed, the variance of case-control status explained by depression GRS was up to 2.3% when only nonsuicide patients were considered, 1.8% when nonviolent suicide patients were considered, and down to 0.2% when patients with depression who died by violent suicide were considered. In other words, the liability of major depression explained by genomic risk is more than 10 times higher in nonsuicide than in violent suicide cases.
Similar to the analysis of the sample with schizophrenia, we investigated differences in IQ GRS (42) between the patient groups. Again, we found that while IQ GRS was significantly lower in nonsuicide patients compared with neurotypical individuals (t=−2.830, p=0.004), there was no significant difference in IQ GRS between neurotypical individuals and violent suicide patients (t=−0.328, p=0.743), who indeed trended toward higher IQ GRS compared with nonsuicide patients (t=1.901, p=0.057) (Figure 3F). In these data, nonviolent suicide patients were not significantly different from the other groups, which may be an issue of sample size. Additional analysis on the relationship of case-control status with IQ GRS, adjusting for major depression GRS, provided the same results (see Figure S12 in the online supplement).

GRS in patients with bipolar disorder.

As expected, GRS for bipolar disorder (41) was significantly higher in all patients affected with bipolar disorder (N=184) compared with control subjects (N=247), explaining 3.4% of the liability to illness (t=3.644, p=0.0003) (Figure 3G). In contrast to the results based on diagnoses of schizophrenia and depression, GRS shows less clear dispersion based on suicide or method in the context of a diagnosis of bipolar disorder. Patients with bipolar disorder who died by suicide using violent methods (t=2.544, p=0.0113) and nonsuicide patients (t=3.217, p=0.0014) had higher bipolar disorder GRS compared with neurotypical control subjects. Bipolar disorder GRS explained 3.2% and 2% of the variance of case-control status, respectively. There was a similar trend for nonviolent suicide patients (t=1.512, p=0.1313). Indeed, bipolar disorder GRS was not significantly different between nonsuicide patients and nonviolent and violent suicide patients with bipolar disorder (Figure 3H). Additionally, violent suicide patients and nonviolent suicide patients had similar IQ GRS, which was in fact not significantly different across all four groups, including the neurotypical group (see Figure S13 in the online supplement). While bipolar disorder GRS and IQ GRS were not correlated in the whole sample (r=−0.0060, p=0.90), they showed a negative correlation selectively in the subsample of violent suicide patients (r=−0.47, p=0.002) (see Figure S14 in the online supplement), suggesting an interaction between the two scores. Therefore, we divided the sample into high and low IQ GRS (defined as above or below the median IQ GRS), and detected an interaction between the two scores on violent suicide case-control status (t=3.016, p=0.003). In the presence of low IQ GRS, bipolar disorder GRS was able to predict 11.7% of the variance of violent suicide case-control status (t=4.004, p=0.0001) (Figure 3I), while in the presence of high IQ GRS, the variance of violent case-control status explained by bipolar disorder GRS was dramatically reduced to 0.17% (t=−0.464, p=0.644). Thus, within the bipolar diagnosis group, reduced genomic risk for the disorder was found in the violent suicide group having relatively higher GRS for intellectual capacity, analogous in part to the findings in schizophrenia and depression.

Suicidal intent.

GWASs on human aggression of adequately powered sample size are lacking to date (55). However, since suicide attempt is considered a risk factor for suicide completion (56), we used summary statistics from a recent GWAS on attempted suicide (43) to calculate GRS for suicide attempt and we tested, in our total sample, the association with suicide completion. Compared with the neurotypical group, nonviolent suicide patients had higher suicide attempt GRS (t=2.503, p=0.01251), as did nonsuicide patients (t=3.072, p=0.00219), while violent suicide patients were, once again, not significantly different from the neurotypical group (t=0.900, p=0.36844). In other words, suicide attempt GRS was higher in all patients except violent suicide patients.
Finally, we excluded the possibility that the differences in gene expression between groups are driven by the GRSs, since in our sample there are no genes with expression significantly associated with any of the tested GRSs (FDR>0.05). Indeed, when each of the three main diagnosis GRSs and IQ GRS were added to the set of predictors, the results were not affected, as shown in Figures S15 and S16 in the online supplement. We can therefore conclude that GRSs do not drive the transcriptomic results.

Weighted Gene Coexpression Network Analysis

To gain further insight into the biological processes potentially involved in the brain correlates of violent suicide while reducing the dimensionality of the data set, we used WGCNA, an approach accounting for the coordinated expression among genes. A coexpression network based on all 329 brain samples produced 44 modules, and we used their module eigengenes in downstream analysis. We first searched for modules associated with suicide by violent means in comparison to the other groups. The only module significantly associated with violent suicide patients, compared with all others (Bonferroni p value=0.0484), was sienna3, a module enriched for synaptic transmission and GABA synthesis (see Table S6A and Figure S17 in the online supplement). We next searched for modules enriched for violent suicide DEGs. As expected, the most enriched module was green (purinergic signaling, including P2RY12, P2RY13, GPR34, and PTAFR (see Table S6B); other modules were salmon (defense response, immunity), orange (negative regulation of MAP kinase activity), white (angiogenesis), and again sienna3 (geneset tests in Figure S18 and Table S6 in the online supplement). Within the green module, the four purinergic receptors of interest show features of hub genes, that is, higher intramodule connectivity (see Table S6H,I); moreover, 33 of the hubs in this module are also DEGs in violent suicide (see Table S6H,I), further supporting an alteration of the purinergic signaling.
Finally, we investigated relationships between modules that appear specific for violent suicide by prioritizing module eigengene pairwise correlations that were significantly affected by the four group conditions—that is, module eigengenes that interacted with death modality in predicting expression of other module eigengenes. In this way, we identified two module eigengene interactions that were nominally significant in all groups compared with violent suicide: yellowgreen (not enriched for any term) with salmon (see Figure S19 in the online supplement), and green (purinergic) with lightcyan1 (Figure 4). Notably, lightcyan1 was highly enriched for terms related to cellular respiration in mitochondria (i.e., the Krebs cycle, electron transport, etc.) and includes one gene (MT-ND6) whose peripheral expression has previously been associated with suicide (57). This result suggests that in violent suicide, as gene connectivity in the green module increases, so does connectivity in the lightcyan1 module, while the opposite is true in all other individuals. Finally, we further verified that the main module eigengenes of interest (green, lightcyan1, salmon, sienna3, and white) emerging in this analysis were not significantly associated with the covariates age, sex, or diagnosis (p values >0.05).
FIGURE 4. Weighted gene coexpression network analysis, interaction between the lightcyan1 module eigengene and groups on the green module eigengenea
a The figure shows a box plot of the interaction between the lightcyan1 module eigengene (i.e., energy metabolism in mitochondria) and the four main groups on the green module eigengene (G protein-coupled purinergic signaling). Interaction statistics: neurotypical individuals by violent suicide patients, t=−2.852, p=0.00462; nonsuicide patients by violent suicide patients, t=−2.482, p=0.01358; nonviolent suicide patients by violent suicide patients, t=−2.095, p=0.03693. All the statistics were generated using multiple regression with the interaction term module eigengene by group. nS-pt=nonsuicide patient; nvS-pt=nonviolent suicide patient; vS-pt=violent suicide patient.

Discussion

By leveraging RNA sequencing and genomic data from a large sample of DLPFC tissue from completed suicide cases, nonsuicide patients, and healthy control subjects and a focus on the suicide method, we identified signatures associated with suicide death and aspects of its phenomenology. We show that those who die by suicide by violent methods may have a separate clinical condition from other suicide cases and from nonsuicide psychiatric patients with similar diagnoses. G protein-coupled purinergic signaling may play a role in this distinction and in related aggressive phenotypes, in a specific mitochondrial background of altered energy metabolism.
A previous attempt at genome-wide expression profiling in suicide via next-generation sequencing (58), not taking into account means of suicide, failed to detect FDR-significant effects specific to suicide and not to major depression, likely because of limited sample size (total N=59, of which 21 were cases of suicide). That study, however, suggested potential deficits in microglia and ATPase activity in suicide. Additionally, an earlier microarray investigation (59), comparing suicides with nonsuicides with the same diagnosis (schizophrenia), found up-regulation of purinergic signaling (including P2RY13) in suicide, as did a recent study (60) looking at a selected pool of glia-related genes (including P2RY12) using real-time qPCR. By studying a larger sample with RNA sequencing, we have been able to parse out the effect of suicide on the brain transcriptome in the context of a psychiatric diagnosis and highlight the signaling involved, while providing novel insight into this extreme behavior.

Suicide by Violent Means May Be a Distinct Condition

The possibility that suicide by violent methods is a biologically meaningful designation—that is, relatively orthogonal to conventional psychiatric disorders—is first suggested by our analyses of gene expression. We showed that in the patients who died by suicide by violent means, the expression patterns are different not only from other patients diagnosed with the same psychiatric disorders but also from patients who died by suicide by nonviolent means.
We also investigated genomic risk, which is less likely to be confounded by the experience of the psychiatric condition or by postmortem tissue artifacts. The GRS analyses largely mirror the transcriptomic findings that patients who died by suicide by violent means show only marginal, if any, differences from neurotypical individuals in genomic risk, as well as divergence from nonsuicide patients and nonviolent suicide patients in genomic risk for their clinical diagnoses. Patients affected with schizophrenia or depression who died by suicide by violent means are less “genetically susceptible” to their diagnosed disorder, and more “genetically inclined” to higher IQ than other patients. Additionally, patients affected with schizophrenia who died by suicide by violent means are also more “genetically resilient” to their diagnosed disorder. These results support the conclusion that individuals with a diagnosis of schizophrenia or depression who select a violent means of suicide are distinguishable biologically from similarly diagnosed patients who do not make this extreme choice.
In contrast to the findings in patients diagnosed with either schizophrenia or depression, violent suicide patients with a diagnosis of bipolar disorder do not differ in diagnosis GRS compared with other patients with the same diagnosis. That those patients evince genetic risk more in line with others with bipolar disorder may be explained by evidence that this diagnosis is highly associated with impulsive behavior and with suicide, with suicide rates in some studies up to 20 to 30 times higher than in the general population (61). However, the possibility that, in general, violent suicide is associated with higher IQ GRS and low diagnosis GRSs is also supported by the analysis in patients with bipolar disorder, where, in the presence of high IQ GRS, violent suicide patients have lower bipolar disorder GRS compared with other patients.
Perhaps surprisingly, the genomic profile of the patients who died by violent suicide is not associated with suicide attempt GRS, which is consonant with the notion that genetic studies of suicide attempt may not catch the genetic architecture of the actual completed behavior, especially by violent methods. This is likely because they include, by design (43), people who survived a suicide attempt, thus excluding the more than 50% of suicidal patients who die in their first attempt (56) and who may better represent those at highest genetic risk for suicide completion (62).

The Potential Role of Purinergic Signaling and Mitochondrial Function

Our molecular data further suggest that suicide by violent means, while less biased by genetic risk for conventional psychiatric disorders, may share characteristics with entities such as aggression, as supported by the aggressive phenotype in Drosophila and by our previous findings in humans (14). Indeed, the DE analysis implicates purinergic signaling, and genes linked to aggressive behavior in two GWAS analyses in D. melanogaster (20) also point to purinergic-related terms as the most enriched processes. The purinergic DEGs belong to the coexpression network studied in our previous publication (14), with P2RY13 being the top gene most strongly related to LINC01268. P2RY13 codes for a transmembrane receptor, enriched in microglia (63) and involved in microglia-mediated hippocampal neurogenesis (64). Included in the same network is also P2RY12, a purinergic DEG and microglia-enriched gene as well (63), whose knockout produces behavioral alterations in mouse brain (65). P2Y12 receptors are involved in lithium pharmacodynamics (66), an interesting notion in light of lithium’s antisuicide properties. P2Y12 receptor signaling is also required for physiological microglia-neuron communication at somatic junctions (67, 68); notably, other human microglia signatures appear at the top of violent suicide DEGs, including CX3CR1, TMEM119, and SELPLG.
Intriguingly, the potential involvement of purine signaling in suicide by violent methods and in aggressive behaviors resonates with aspects of the syndrome caused by mutations in the gene HPRT1—Lesch-Nyhan disease (69). The most defining behavioral manifestation of the disease is the irresistible impulse to self-injury, including lip and finger biting, eye poking, and head banging (69). The etiopathogenesis of Lesch-Nyhan disease is poorly understood; however, as a result of HPRT1 deficiency, purine recycling to their nucleosides is not functional, leading to enhanced de novo purine synthesis (70). Of note, a recent study has shown that in mouse brain and plasma, prophylaxis with ketamine following stress is associated with long-term alterations of purine and pyrimidine metabolism (71); ketamine is also known to transiently reduce suicidal ideation with a single dose (72).
We searched for upstream regulators of the DEGs in violent suicide patients compared with nonsuicide patients, and compared with nonviolent suicide patients, and the analysis pointed to EIF4E, a critical regulator of translation. Intriguingly, a recent study has found that cell-specific translation via eIF4E is central to the antidepressant activity of ketamine (73). According to these data, ketamine would exert its therapeutic action by activating eIF4E; consistently, the directionality of our DEGs would suggest an upstream inhibition of this translational regulator.
Among violent suicide DEGs, the most significant is the functionally unknown LINC00996, which flanks several GTPases, IMAP family genes (GIMAP), some of which are also violent suicide DEGs. GIMAP genes in this region have previously been linked to completed suicide cases within high-risk families, regardless of co-occurring psychopathology (48). LINC00996’s expression is also restricted to microglia (74); importantly, an independent bioinformatic investigation (75) showed G protein-coupled purinergic nucleotide receptor signaling as one of the top pathways enriched for the genes related to LINC00996.
The DE results posed the challenging question of how the relatively fewer biological differences between violent suicide patients and neurotypical individuals identified here translate into their markedly different behavior. We cannot rule out the possibility that more substantial differences will emerge in transcriptional analyses of other brain regions, or in single cellular phenotypes, which are the subject of future investigation, or at epigenetic and proteomic levels, consistent with the enrichment of upstream signal to DEGs in violent suicide for translation regulators such as EIF4E. Meanwhile, the DE based on this contrast highlights only eight DEGs, the top of which is ELFN2, a recently identified adhesion molecule that selectively binds metabotropic glutamate receptors. Elfn2 knockout mice show susceptibility to seizure, anxiety/compulsivity, and hyperactivity (76). However, this gene is not DE in violent suicide patients compared with nonsuicide patients, which suggests that the result may be driven by case-control status.
According to the linear model results, neurotypical individuals are in the middle of a continuum of gene expression, featuring the purinergic DEGs, with the two extremes being violent suicide and nonsuicide/nonviolent suicide patients. One possible explanation for this evidence is that purinergic signaling functions optimally within a narrow window of expression, where lower expression is associated with disease status, and higher expression to health, but only within a certain threshold, as has been reported for other genes linked to neurotrophism (77).
Interestingly, the WGCNA results suggest that in the context of suicide by violent means, the purinergic DEGs may function in an opposite state of energy metabolism to that observed in all other individuals. Indeed, purinergic DEGs tend to be more coexpressed in the context of higher energy metabolism in the violent suicide cases, in contrast to lower energy metabolism coexpression in neurotypical individuals and the other groups. As mentioned, recruitment of microglial processes to somatic junctions is linked to mitochondria neuronal activity in neuron-microglia communication (67, 68). Recent evidence (78, 79) has further outlined a key role for microglia in neuronal inhibition, by converting ATP to ADP, which stimulates P2Y12 microglia receptors. In this light, another finding of the WGCNA data is the association with violent suicide of a module enriched for GABA synthesis. Thus, our data point to violent suicide, in contrast to the other three conditions, as involving a state of excessive neuronal-microglia communication that may be detrimental to brain function.

Potential Clinical Implications

Finally, our data may have potential clinical implications: addressing suicide by violent means as a separate condition may prove decisive to inform prevention. Violent suicide DEGs in brain specimens, if mimicked by peripheral biomarkers, may potentially differentiate a suicide candidate from a patient who is not shifting from considering death to actually pursuing it, offering novel and more precise targets for therapy in short-term risk for suicide.
In conclusion, our results converge in suggesting that patients who died by suicide by violent means may constitute a group whose brain biology and whose genetic profile of risk is less related to that of other similarly diagnosed psychiatric patients in the context of an alteration of the purinergic signaling and mitochondrial metabolism.

Acknowledgments

The authors are grateful for the contributions of the Office of the Chief Medical Examiner of the State of Maryland; the Office of the Chief Medical Examiner of Kalamazoo County, Michigan; the Office of the Chief Medical Examiner, University of North Dakota School of Medicine; Gift of Life of Michigan; and the Office of the Chief Medical Examiner of Santa Clara County, California, in assisting the Lieber Institute for Brain Development in the acquisition and curation of brain tissue donations for this study. Additional samples were provided by the Stanley Medical Research Foundation and the University of Maryland Brain and Tissue Bank. The authors are deeply grateful to the brave and generous families who consented to the brain donation of their deceased next of kin. The authors thank Richard Straub, Ph.D., and Shizhong Han, Ph.D., for insightful discussions. The authors thank the Lieber and Maltz families for their support, which funded the acquisition of brain tissue and the analytic work of this project.

Footnote

Data and materials availability: The genetic, gene expression, manner of death/suicide means data generated and analyzed in this study are available from the corresponding authors on reasonable request, together with the codes used for the analyses.

Supplementary Material

File (appi.ajp.2021.21030299.ds001.pdf)
File (appi.ajp.2021.21030299.ds002.xlsx)
File (appi.ajp.2021.21030299.ds003.xlsx)
File (appi.ajp.2021.21030299.ds004.xlsx)

References

1.
Reger MA, Stanley IH, Joiner TE: Suicide mortality and coronavirus disease 2019: a perfect storm? JAMA Psychiatry 2020; 77:1093–1094
2.
Post RM: The new news about lithium: an underutilized treatment in the United States. Neuropsychopharmacology 2018; 43:1174–1179
3.
Meltzer HY, Alphs L, Green AI, et al: Clozapine treatment for suicidality in schizophrenia: International Suicide Prevention Trial (InterSePT). Arch Gen Psychiatry 2003; 60:82–91
4.
Phillips MR, Yang G, Zhang Y, et al: Risk factors for suicide in China: a national case-control psychological autopsy study. Lancet 2002; 360:1728–1736
5.
Oquendo MA, Baca-Garcia E: Suicidal behavior disorder as a diagnostic entity in the DSM-5 classification system: advantages outweigh limitations. World Psychiatry 2014; 13:128–130
6.
Qin P, Agerbo E, Mortensen PB: Suicide risk in relation to family history of completed suicide and psychiatric disorders: a nested case-control study based on longitudinal registers. Lancet 2002; 360:1126–1130
7.
Oquendo MA, Baca-García E, Mann JJ, et al: Issues for DSM-V: suicidal behavior as a separate diagnosis on a separate axis. Am J Psychiatry 2008; 165:1383–1384
8.
Hill NTM, Robinson J, Pirkis J, et al: Association of suicidal behavior with exposure to suicide and suicide attempt: a systematic review and multilevel meta-analysis. PLoS Med 2020; 17:e1003074
9.
Nock MK, Hwang I, Sampson N, et al: Cross-national analysis of the associations among mental disorders and suicidal behavior: findings from the WHO World Mental Health Surveys. PLoS Med 2009; 6:e1000123
10.
Geschwind DH, Flint J: Genetics and genomics of psychiatric disease. Science 2015; 349:1489–1494
11.
Klonsky ED, Saffer BY, Bryan CJ: Ideation-to-action theories of suicide: a conceptual and empirical update. Curr Opin Psychol 2018; 22:38–43
12.
Turecki G: Dissecting the suicide phenotype: the role of impulsive-aggressive behaviours. J Psychiatry Neurosci 2005; 30:398–408
13.
Mok PL, Pedersen CB, Springate D, et al: Parental psychiatric disease and risks of attempted suicide and violent criminal offending in offspring: a population-based cohort study. JAMA Psychiatry 2016; 73:1015–1022
14.
Punzi G, Ursini G, Viscanti G, et al: Association of a noncoding RNA postmortem with suicide by violent means and in vivo with aggressive phenotypes. Biol Psychiatry 2019; 85:417–424
15.
Jollant F, Bellivier F, Leboyer M, et al: Impaired decision making in suicide attempters. Am J Psychiatry 2005; 162:304–310
16.
Perrain R, Dardennes R, Jollant F: Risky decision-making in suicide attempters, and the choice of a violent suicidal means: an updated meta-analysis. J Affect Disord 2021; 280(Pt A):241–249
17.
Punzi G, Ursini G, Shin JH, et al: Increased expression of MARCKS in post-mortem brain of violent suicide completers is related to transcription of a long, noncoding, antisense RNA. Mol Psychiatry 2014; 19:1057–1059
18.
Roberts AC, Robbins TW, Weiskrantz L: The Prefrontal Cortex: Executive and Cognitive Functions. Oxford, UK, Oxford University Press, 1998
19.
Achterberg M, van Duijvenvoorde ACK, van IJzendoorn MH, et al: Longitudinal changes in DLPFC activation during childhood are related to decreased aggression following social rejection. Proc Natl Acad Sci USA 2020; 117:8602–8610
20.
Shorter J, Couch C, Huang W, et al: Genetic architecture of natural variation in Drosophila melanogaster aggressive behavior. Proc Natl Acad Sci USA 2015; 112:E3555–E3563
21.
BrainSeq: A Human Brain Genomics Consortium: BrainSeq: neurogenomics to drive novel target discovery for neuropsychiatric disorders. Neuron 2015; 88:1078–1083
22.
Lipska BK, Deep-Soboslay A, Weickert CS, et al: Critical factors in gene expression in postmortem human brain: focus on studies in schizophrenia. Biol Psychiatry 2006; 60:650–658
23.
Colantuoni C, Lipska BK, Ye T, et al: Temporal dynamics and genetic control of transcription in the human prefrontal cortex. Nature 2011; 478:519–523
24.
Eagles NJ, Burke EE, Leonard J, et al: SPEAQeasy: a scalable pipeline for expression analysis and quantification for R/bioconductor-powered RNA-seq analyses. BMC Bioinformatics 2021; 22:224
25.
Jaffe AE, Straub RE, Shin JH, et al: Developmental and genetic regulation of the human cortex transcriptome illuminate schizophrenia pathogenesis. Nat Neurosci 2018; 21:1117–1125
26.
Collado-Torres L, Burke EE, Peterson A, et al: Regional heterogeneity in gene expression, regulation, and coherence in the frontal cortex and hippocampus across development and schizophrenia. Neuron 2019; 103:203–216.e8
27.
Jaffe AE, Tao R, Norris AL, et al: qSVA framework for RNA quality correction in differential expression analysis. Proc Natl Acad Sci USA 2017; 114:7130–7135
28.
Smyth GK: Linear models and empirical Bayes methods for assessing differential expression in microarray experiments. Stat Appl Genet Mol Biol 2004; 3
29.
Gene Ontology Consortium: Gene Ontology Consortium: going forward. Nucleic Acids Res 2015; 43:D1049–D1056
30.
Jew B, Alvarez M, Rahmani E, et al: Accurate estimation of cell composition in bulk expression through robust integration of single-cell information. Nat Commun 2020; 11:1971
31.
Tran MN, Maynard KR, Spangler A, et al: Single-nucleus transcriptome analysis reveals cell type-specific molecular signatures across reward circuitry in the human brain. Neuron 2021; 109:3088–3103.e5
32.
Hoffman GE, Ma Y, Montgomery KS, et al: Sex differences in the human brain transcriptome of cases with schizophrenia. Biol Psychiatry (Online ahead of print, March 25, 2021)
33.
Jaffe AE, Gao Y, Deep-Soboslay A, et al: Mapping DNA methylation across development, genotype, and schizophrenia in the human frontal cortex. Nat Neurosci 2016; 19:40–47
34.
Li M, Jaffe AE, Straub RE, et al: A human-specific AS3MT isoform and BORCS7 are molecular risk factors in the 10q24.32 schizophrenia-associated locus. Nat Med 2016; 22:649–656
35.
Purcell S, Neale B, Todd-Brown K, et al: PLINK: a tool set for whole-genome association and population-based linkage analyses. Am J Hum Genet 2007; 81:559–575
36.
Wray NR, Goddard ME, Visscher PM: Prediction of individual genetic risk to disease from genome-wide association studies. Genome Res 2007; 17:1520–1528
37.
International Schizophrenia Consortium, Purcell SM, Wray NR, et al: Common polygenic variation contributes to risk of schizophrenia and bipolar disorder. Nature 2009; 460:748–752
38.
Schizophrenia Working Group of the Psychiatric Genomics Consortium: Biological insights from 108 schizophrenia-associated genetic loci. Nature 2014; 511:421–427
39.
Hess JL, Tylee DS, Mattheisen M: A polygenic resilience score moderates the genetic risk for schizophrenia. Mol Psychiatry 2021; 26:800–815
40.
Howard DM, Adams MJ, Clarke TK, et al: Genome-wide meta-analysis of depression identifies 102 independent variants and highlights the importance of the prefrontal brain regions. Nat Neurosci 2019; 22:343–352
41.
Stahl EA, Breen G, Forstner AJ, et al: Genome-wide association study identifies 30 loci associated with bipolar disorder. Nat Genet 2019; 51:793–803
42.
Sniekers S, Stringer S, Watanabe K, et al: Genome-wide association meta-analysis of 78,308 individuals identifies new loci and genes influencing human intelligence. Nat Genet 2017; 49:1107–1112
43.
Mullins N, Bigdeli TB, Børglum AD, et al: GWAS of suicide attempt in psychiatric disorders and association with major depression polygenic risk scores. Am J Psychiatry 2019; 176:651–660
44.
Langfelder P, Horvath S: WGCNA: an R package for weighted correlation network analysis. BMC Bioinformatics 2008; 9:559
45.
Radulescu E, Jaffe AE, Straub RE, et al: Identification and prioritization of gene sets associated with schizophrenia risk by co-expression network analysis in human brain. Mol Psychiatry 2020; 25:791–804
46.
Langfelder P, Horvath S: Eigengene networks for studying the relationships between co-expression modules. BMC Syst Biol 2007; 1:54
47.
Smit DJA, Wright MJ, Meyers JL, et al: Genome-wide association analysis links multiple psychiatric liability genes to oscillatory brain activity. Hum Brain Mapp 2018; 39:4183–4195
48.
Coon H, Darlington TM, DiBlasi E, et al: Genome-wide significant regions in 43 Utah high-risk families implicate multiple genes involved in risk for completed suicide. Mol Psychiatry 2020; 25:3077–3090
49.
Cahill KM, Huo Z, Tseng GC, et al: Improved identification of concordant and discordant gene expression signatures using an updated rank-rank hypergeometric overlap approach. Sci Rep 2018; 8:9588
50.
Dumais A, Lesage AD, Lalovic A, et al: Is violent method of suicide a behavioral marker of lifetime aggression? Am J Psychiatry 2005; 162:1375–1378
51.
Ludwig B, Dwivedi Y: The concept of violent suicide, its underlying trait and neurobiology: a critical perspective. Eur Neuropsychopharmacol 2018; 28:243–251
52.
Hu Y, Flockhart I, Vinayagam A, et al: An integrative approach to ortholog prediction for disease-focused and other functional studies. BMC Bioinformatics 2011; 12:357
53.
Zapata I, Serpell JA, Alvarez CE: Genetic mapping of canine fear and aggression. BMC Genomics 2016; 17:572
54.
Schaefer J, Giangrande E, Weinberger DR, et al: The global cognitive impairment in schizophrenia: consistent over decades and around the world. Schizophr Res 2013; 150:42–50
55.
Odintsova VV, Roetman PJ, Ip HF, et al: Genomics of human aggression: current state of genome-wide studies and an automated systematic review tool. Psychiatr Genet 2019; 29:170–190
56.
Bostwick JM, Pabbati C, Geske JR, et al: Suicide attempt as a risk factor for completed suicide: even more lethal than we knew. Am J Psychiatry 2016; 173:1094–1100
57.
Le-Niculescu H, Levey DF, Ayalew M, et al: Discovery and validation of blood biomarkers for suicidality. Mol Psychiatry 2013; 18:1249–1264
58.
Pantazatos SP, Huang YY, Rosoklija GB, et al: Whole-transcriptome brain expression and exon-usage profiling in major depression and suicide: evidence for altered glial, endothelial, and ATPase activity. Mol Psychiatry 2017; 22:760–773
59.
Kim S, Choi KH, Baykiz AF, et al: Suicide candidate genes associated with bipolar disorder and schizophrenia: an exploratory gene expression profiling analysis of post-mortem prefrontal cortex. BMC Genomics 2007; 8:413
60.
Zhang L, Verwer RWH, Lucassen PJ, et al: Prefrontal cortex alterations in glia gene expression in schizophrenia with and without suicide. J Psychiatr Res 2020; 121:31–38
61.
Plans L, Barrot C, Nieto E, et al: Association between completed suicide and bipolar disorder: a systematic review of the literature. J Affect Disord 2019; 242:111–122
62.
Lopes FL, McMahon FJ: The promise and limits of suicide genetics. Am J Psychiatry 2019; 176:600–602
63.
Zhang Y, Chen K, Sloan SA, et al: An RNA-sequencing transcriptome and splicing database of glia, neurons, and vascular cells of the cerebral cortex. J Neurosci 2014; 34:11929–11947
64.
Stefani J, Tschesnokowa O, Parrilla M, et al: Disruption of the microglial ADP receptor P2Y13 enhances adult hippocampal neurogenesis. Front Cell Neurosci 2018; 12:134
65.
Zheng F, Zhou Q, Cao Y, et al: P2Y12 deficiency in mouse impairs noradrenergic system in brain, and alters anxiety-like neurobehavior and memory. Genes Brain Behav 2019; 18:e12458
66.
Zhang Y, Hansson KM, Liu T, et al: Genetic deletion of ADP-activated P2Y12 receptor ameliorates lithium-induced nephrogenic diabetes insipidus in mice. Acta Physiol (Oxf) 2019; 225:e13191
67.
Cserép C, Pósfai B, Lénárt N, et al: Microglia monitor and protect neuronal function through specialized somatic purinergic junctions. Science 2020; 367:528–537
68.
Nimmerjahn A: Monitoring neuronal health. Science 2020; 367:510–511
69.
Lesch M, Nyhan WL: A familial disorder of uric acid metabolism and central nervous system function. Am J Med 1964; 36:561–570
70.
Torres RJ, Prior C, Garcia MG, et al: A review of the implication of hypoxanthine excess in the physiopathology of Lesch-Nyhan disease. Nucleosides Nucleotides Nucleic Acids 2016; 35:507–516
71.
McGowan JC, Hill C, Mastrodonato A, et al: Prophylactic ketamine alters nucleotide and neurotransmitter metabolism in brain and plasma following stress. Neuropsychopharmacology 2018; 43:1813–1821
72.
Wilkinson ST, Ballard ED, Bloch MH, et al: The effect of a single dose of intravenous ketamine on suicidal ideation: a systematic review and individual participant data meta-analysis. Am J Psychiatry 2018; 175:150–158
73.
Aguilar-Valles A, De Gregorio D, Matta-Camacho E, et al: Antidepressant actions of ketamine engage cell-specific translation via eIF4E. Nature 2021; 590:315–319
74.
Gandal MJ, Zhang P, Hadjimichael E, et al: Transcriptome-wide isoform-level dysregulation in ASD, schizophrenia, and bipolar disorder. Science 2018; 362:362
75.
Ge H, Yan Y, Wu D, et al: Potential role of LINC00996 in colorectal cancer: a study based on data mining and bioinformatics. OncoTargets Ther 2018; 11:4845–4855
76.
Dunn HA, Zucca S, Dao M, et al: ELFN2 is a postsynaptic cell adhesion molecule with essential roles in controlling group III mGluRs in the brain and neuropsychiatric behavior. Mol Psychiatry 2019; 24:1902–1919
77.
Koyama R, Yamada MK, Fujisawa S, et al: Brain-derived neurotrophic factor induces hyperexcitable reentrant circuits in the dentate gyrus. J Neurosci 2004; 24:7215–7224
78.
Badimon A, Strasburger HJ, Ayata P, et al: Negative feedback control of neuronal activity by microglia. Nature 2020; 586:417–423
79.
Merlini M, Rafalski VA, Ma K, et al: Microglial Gi-dependent dynamics regulate brain network hyperexcitability. Nat Neurosci 2021; 24:19–23

Information & Authors

Information

Published In

Go to American Journal of Psychiatry
American Journal of Psychiatry
Pages: 226 - 241
PubMed: 35236118

History

Received: 22 March 2021
Revision received: 30 August 2021
Revision received: 28 September 2021
Accepted: 18 October 2021
Published in print: March 2022
Published online: 3 March 2022

Keywords

  1. Suicide Method
  2. Postmortem Brain
  3. RNA Sequencing
  4. Genomic Risk
  5. Purinergic Signaling
  6. Mitochondria

Authors

Details

Giovanna Punzi, M.D., Ph.D. [email protected]
Lieber Institute for Brain Development, Johns Hopkins University Medical Campus, Baltimore (Punzi, Ursini, Chen, Radulescu, Tao, Huuki, Di Carlo, Collado-Torres, Shin, Jaffe, Hyde, Kleinman, Weinberger); Department of Psychiatry and Behavioral Sciences, Johns Hopkins University School of Medicine, Baltimore (Ursini, Hyde, Kleinman, Weinberger); Section of Forensic Psychiatry and Criminology, Institute of Legal Medicine, D.I.M., University of Bari “Aldo Moro,” Bari, Italy (Catanesi); Department of Mental Health, Johns Hopkins Bloomberg School of Public Health, Baltimore (Jaffe); Department of Neurology, Johns Hopkins School of Medicine, Baltimore (Hyde, Weinberger); Department of Genetics and Biochemistry and Center for Human Genetics, Clemson University, Greenwood, S.C. (Mackay); Departments of Neuroscience and Genetic Medicine, Johns Hopkins School of Medicine, Baltimore (Weinberger).
Gianluca Ursini, M.D., Ph.D.
Lieber Institute for Brain Development, Johns Hopkins University Medical Campus, Baltimore (Punzi, Ursini, Chen, Radulescu, Tao, Huuki, Di Carlo, Collado-Torres, Shin, Jaffe, Hyde, Kleinman, Weinberger); Department of Psychiatry and Behavioral Sciences, Johns Hopkins University School of Medicine, Baltimore (Ursini, Hyde, Kleinman, Weinberger); Section of Forensic Psychiatry and Criminology, Institute of Legal Medicine, D.I.M., University of Bari “Aldo Moro,” Bari, Italy (Catanesi); Department of Mental Health, Johns Hopkins Bloomberg School of Public Health, Baltimore (Jaffe); Department of Neurology, Johns Hopkins School of Medicine, Baltimore (Hyde, Weinberger); Department of Genetics and Biochemistry and Center for Human Genetics, Clemson University, Greenwood, S.C. (Mackay); Departments of Neuroscience and Genetic Medicine, Johns Hopkins School of Medicine, Baltimore (Weinberger).
Qiang Chen, Ph.D.
Lieber Institute for Brain Development, Johns Hopkins University Medical Campus, Baltimore (Punzi, Ursini, Chen, Radulescu, Tao, Huuki, Di Carlo, Collado-Torres, Shin, Jaffe, Hyde, Kleinman, Weinberger); Department of Psychiatry and Behavioral Sciences, Johns Hopkins University School of Medicine, Baltimore (Ursini, Hyde, Kleinman, Weinberger); Section of Forensic Psychiatry and Criminology, Institute of Legal Medicine, D.I.M., University of Bari “Aldo Moro,” Bari, Italy (Catanesi); Department of Mental Health, Johns Hopkins Bloomberg School of Public Health, Baltimore (Jaffe); Department of Neurology, Johns Hopkins School of Medicine, Baltimore (Hyde, Weinberger); Department of Genetics and Biochemistry and Center for Human Genetics, Clemson University, Greenwood, S.C. (Mackay); Departments of Neuroscience and Genetic Medicine, Johns Hopkins School of Medicine, Baltimore (Weinberger).
Eugenia Radulescu, M.D., Ph.D.
Lieber Institute for Brain Development, Johns Hopkins University Medical Campus, Baltimore (Punzi, Ursini, Chen, Radulescu, Tao, Huuki, Di Carlo, Collado-Torres, Shin, Jaffe, Hyde, Kleinman, Weinberger); Department of Psychiatry and Behavioral Sciences, Johns Hopkins University School of Medicine, Baltimore (Ursini, Hyde, Kleinman, Weinberger); Section of Forensic Psychiatry and Criminology, Institute of Legal Medicine, D.I.M., University of Bari “Aldo Moro,” Bari, Italy (Catanesi); Department of Mental Health, Johns Hopkins Bloomberg School of Public Health, Baltimore (Jaffe); Department of Neurology, Johns Hopkins School of Medicine, Baltimore (Hyde, Weinberger); Department of Genetics and Biochemistry and Center for Human Genetics, Clemson University, Greenwood, S.C. (Mackay); Departments of Neuroscience and Genetic Medicine, Johns Hopkins School of Medicine, Baltimore (Weinberger).
Ran Tao, Ph.D.
Lieber Institute for Brain Development, Johns Hopkins University Medical Campus, Baltimore (Punzi, Ursini, Chen, Radulescu, Tao, Huuki, Di Carlo, Collado-Torres, Shin, Jaffe, Hyde, Kleinman, Weinberger); Department of Psychiatry and Behavioral Sciences, Johns Hopkins University School of Medicine, Baltimore (Ursini, Hyde, Kleinman, Weinberger); Section of Forensic Psychiatry and Criminology, Institute of Legal Medicine, D.I.M., University of Bari “Aldo Moro,” Bari, Italy (Catanesi); Department of Mental Health, Johns Hopkins Bloomberg School of Public Health, Baltimore (Jaffe); Department of Neurology, Johns Hopkins School of Medicine, Baltimore (Hyde, Weinberger); Department of Genetics and Biochemistry and Center for Human Genetics, Clemson University, Greenwood, S.C. (Mackay); Departments of Neuroscience and Genetic Medicine, Johns Hopkins School of Medicine, Baltimore (Weinberger).
Louise A. Huuki, P.S.M.
Lieber Institute for Brain Development, Johns Hopkins University Medical Campus, Baltimore (Punzi, Ursini, Chen, Radulescu, Tao, Huuki, Di Carlo, Collado-Torres, Shin, Jaffe, Hyde, Kleinman, Weinberger); Department of Psychiatry and Behavioral Sciences, Johns Hopkins University School of Medicine, Baltimore (Ursini, Hyde, Kleinman, Weinberger); Section of Forensic Psychiatry and Criminology, Institute of Legal Medicine, D.I.M., University of Bari “Aldo Moro,” Bari, Italy (Catanesi); Department of Mental Health, Johns Hopkins Bloomberg School of Public Health, Baltimore (Jaffe); Department of Neurology, Johns Hopkins School of Medicine, Baltimore (Hyde, Weinberger); Department of Genetics and Biochemistry and Center for Human Genetics, Clemson University, Greenwood, S.C. (Mackay); Departments of Neuroscience and Genetic Medicine, Johns Hopkins School of Medicine, Baltimore (Weinberger).
Pasquale Di Carlo, M.D., Ph.D.
Lieber Institute for Brain Development, Johns Hopkins University Medical Campus, Baltimore (Punzi, Ursini, Chen, Radulescu, Tao, Huuki, Di Carlo, Collado-Torres, Shin, Jaffe, Hyde, Kleinman, Weinberger); Department of Psychiatry and Behavioral Sciences, Johns Hopkins University School of Medicine, Baltimore (Ursini, Hyde, Kleinman, Weinberger); Section of Forensic Psychiatry and Criminology, Institute of Legal Medicine, D.I.M., University of Bari “Aldo Moro,” Bari, Italy (Catanesi); Department of Mental Health, Johns Hopkins Bloomberg School of Public Health, Baltimore (Jaffe); Department of Neurology, Johns Hopkins School of Medicine, Baltimore (Hyde, Weinberger); Department of Genetics and Biochemistry and Center for Human Genetics, Clemson University, Greenwood, S.C. (Mackay); Departments of Neuroscience and Genetic Medicine, Johns Hopkins School of Medicine, Baltimore (Weinberger).
Leonardo Collado-Torres, Ph.D.
Lieber Institute for Brain Development, Johns Hopkins University Medical Campus, Baltimore (Punzi, Ursini, Chen, Radulescu, Tao, Huuki, Di Carlo, Collado-Torres, Shin, Jaffe, Hyde, Kleinman, Weinberger); Department of Psychiatry and Behavioral Sciences, Johns Hopkins University School of Medicine, Baltimore (Ursini, Hyde, Kleinman, Weinberger); Section of Forensic Psychiatry and Criminology, Institute of Legal Medicine, D.I.M., University of Bari “Aldo Moro,” Bari, Italy (Catanesi); Department of Mental Health, Johns Hopkins Bloomberg School of Public Health, Baltimore (Jaffe); Department of Neurology, Johns Hopkins School of Medicine, Baltimore (Hyde, Weinberger); Department of Genetics and Biochemistry and Center for Human Genetics, Clemson University, Greenwood, S.C. (Mackay); Departments of Neuroscience and Genetic Medicine, Johns Hopkins School of Medicine, Baltimore (Weinberger).
Joo Heon Shin, Ph.D.
Lieber Institute for Brain Development, Johns Hopkins University Medical Campus, Baltimore (Punzi, Ursini, Chen, Radulescu, Tao, Huuki, Di Carlo, Collado-Torres, Shin, Jaffe, Hyde, Kleinman, Weinberger); Department of Psychiatry and Behavioral Sciences, Johns Hopkins University School of Medicine, Baltimore (Ursini, Hyde, Kleinman, Weinberger); Section of Forensic Psychiatry and Criminology, Institute of Legal Medicine, D.I.M., University of Bari “Aldo Moro,” Bari, Italy (Catanesi); Department of Mental Health, Johns Hopkins Bloomberg School of Public Health, Baltimore (Jaffe); Department of Neurology, Johns Hopkins School of Medicine, Baltimore (Hyde, Weinberger); Department of Genetics and Biochemistry and Center for Human Genetics, Clemson University, Greenwood, S.C. (Mackay); Departments of Neuroscience and Genetic Medicine, Johns Hopkins School of Medicine, Baltimore (Weinberger).
Roberto Catanesi, M.D.
Lieber Institute for Brain Development, Johns Hopkins University Medical Campus, Baltimore (Punzi, Ursini, Chen, Radulescu, Tao, Huuki, Di Carlo, Collado-Torres, Shin, Jaffe, Hyde, Kleinman, Weinberger); Department of Psychiatry and Behavioral Sciences, Johns Hopkins University School of Medicine, Baltimore (Ursini, Hyde, Kleinman, Weinberger); Section of Forensic Psychiatry and Criminology, Institute of Legal Medicine, D.I.M., University of Bari “Aldo Moro,” Bari, Italy (Catanesi); Department of Mental Health, Johns Hopkins Bloomberg School of Public Health, Baltimore (Jaffe); Department of Neurology, Johns Hopkins School of Medicine, Baltimore (Hyde, Weinberger); Department of Genetics and Biochemistry and Center for Human Genetics, Clemson University, Greenwood, S.C. (Mackay); Departments of Neuroscience and Genetic Medicine, Johns Hopkins School of Medicine, Baltimore (Weinberger).
Andrew E. Jaffe, Ph.D.
Lieber Institute for Brain Development, Johns Hopkins University Medical Campus, Baltimore (Punzi, Ursini, Chen, Radulescu, Tao, Huuki, Di Carlo, Collado-Torres, Shin, Jaffe, Hyde, Kleinman, Weinberger); Department of Psychiatry and Behavioral Sciences, Johns Hopkins University School of Medicine, Baltimore (Ursini, Hyde, Kleinman, Weinberger); Section of Forensic Psychiatry and Criminology, Institute of Legal Medicine, D.I.M., University of Bari “Aldo Moro,” Bari, Italy (Catanesi); Department of Mental Health, Johns Hopkins Bloomberg School of Public Health, Baltimore (Jaffe); Department of Neurology, Johns Hopkins School of Medicine, Baltimore (Hyde, Weinberger); Department of Genetics and Biochemistry and Center for Human Genetics, Clemson University, Greenwood, S.C. (Mackay); Departments of Neuroscience and Genetic Medicine, Johns Hopkins School of Medicine, Baltimore (Weinberger).
Thomas M. Hyde, M.D., Ph.D.
Lieber Institute for Brain Development, Johns Hopkins University Medical Campus, Baltimore (Punzi, Ursini, Chen, Radulescu, Tao, Huuki, Di Carlo, Collado-Torres, Shin, Jaffe, Hyde, Kleinman, Weinberger); Department of Psychiatry and Behavioral Sciences, Johns Hopkins University School of Medicine, Baltimore (Ursini, Hyde, Kleinman, Weinberger); Section of Forensic Psychiatry and Criminology, Institute of Legal Medicine, D.I.M., University of Bari “Aldo Moro,” Bari, Italy (Catanesi); Department of Mental Health, Johns Hopkins Bloomberg School of Public Health, Baltimore (Jaffe); Department of Neurology, Johns Hopkins School of Medicine, Baltimore (Hyde, Weinberger); Department of Genetics and Biochemistry and Center for Human Genetics, Clemson University, Greenwood, S.C. (Mackay); Departments of Neuroscience and Genetic Medicine, Johns Hopkins School of Medicine, Baltimore (Weinberger).
Joel E. Kleinman, M.D., Ph.D.
Lieber Institute for Brain Development, Johns Hopkins University Medical Campus, Baltimore (Punzi, Ursini, Chen, Radulescu, Tao, Huuki, Di Carlo, Collado-Torres, Shin, Jaffe, Hyde, Kleinman, Weinberger); Department of Psychiatry and Behavioral Sciences, Johns Hopkins University School of Medicine, Baltimore (Ursini, Hyde, Kleinman, Weinberger); Section of Forensic Psychiatry and Criminology, Institute of Legal Medicine, D.I.M., University of Bari “Aldo Moro,” Bari, Italy (Catanesi); Department of Mental Health, Johns Hopkins Bloomberg School of Public Health, Baltimore (Jaffe); Department of Neurology, Johns Hopkins School of Medicine, Baltimore (Hyde, Weinberger); Department of Genetics and Biochemistry and Center for Human Genetics, Clemson University, Greenwood, S.C. (Mackay); Departments of Neuroscience and Genetic Medicine, Johns Hopkins School of Medicine, Baltimore (Weinberger).
Trudy F.C. Mackay, Ph.D.
Lieber Institute for Brain Development, Johns Hopkins University Medical Campus, Baltimore (Punzi, Ursini, Chen, Radulescu, Tao, Huuki, Di Carlo, Collado-Torres, Shin, Jaffe, Hyde, Kleinman, Weinberger); Department of Psychiatry and Behavioral Sciences, Johns Hopkins University School of Medicine, Baltimore (Ursini, Hyde, Kleinman, Weinberger); Section of Forensic Psychiatry and Criminology, Institute of Legal Medicine, D.I.M., University of Bari “Aldo Moro,” Bari, Italy (Catanesi); Department of Mental Health, Johns Hopkins Bloomberg School of Public Health, Baltimore (Jaffe); Department of Neurology, Johns Hopkins School of Medicine, Baltimore (Hyde, Weinberger); Department of Genetics and Biochemistry and Center for Human Genetics, Clemson University, Greenwood, S.C. (Mackay); Departments of Neuroscience and Genetic Medicine, Johns Hopkins School of Medicine, Baltimore (Weinberger).
Daniel R. Weinberger, M.D. [email protected]
Lieber Institute for Brain Development, Johns Hopkins University Medical Campus, Baltimore (Punzi, Ursini, Chen, Radulescu, Tao, Huuki, Di Carlo, Collado-Torres, Shin, Jaffe, Hyde, Kleinman, Weinberger); Department of Psychiatry and Behavioral Sciences, Johns Hopkins University School of Medicine, Baltimore (Ursini, Hyde, Kleinman, Weinberger); Section of Forensic Psychiatry and Criminology, Institute of Legal Medicine, D.I.M., University of Bari “Aldo Moro,” Bari, Italy (Catanesi); Department of Mental Health, Johns Hopkins Bloomberg School of Public Health, Baltimore (Jaffe); Department of Neurology, Johns Hopkins School of Medicine, Baltimore (Hyde, Weinberger); Department of Genetics and Biochemistry and Center for Human Genetics, Clemson University, Greenwood, S.C. (Mackay); Departments of Neuroscience and Genetic Medicine, Johns Hopkins School of Medicine, Baltimore (Weinberger).

Notes

Send correspondence to Dr. Weinberger ([email protected]) and Dr. Punzi ([email protected]).

Funding Information

Dr. Jaffe is employed by and holds stock in Neumora Therapeutics. The other authors report no financial relationships with commercial interests.

Metrics & Citations

Metrics

Citations

Export Citations

If you have the appropriate software installed, you can download article citation data to the citation manager of your choice. Simply select your manager software from the list below and click Download.

For more information or tips please see 'Downloading to a citation manager' in the Help menu.

Format
Citation style
Style
Copy to clipboard

View Options

View options

PDF/EPUB

View PDF/EPUB

Login options

Already a subscriber? Access your subscription through your login credentials or your institution for full access to this article.

Personal login Institutional Login Open Athens login
Purchase Options

Purchase this article to access the full text.

PPV Articles - American Journal of Psychiatry

PPV Articles - American Journal of Psychiatry

Not a subscriber?

Subscribe Now / Learn More

PsychiatryOnline subscription options offer access to the DSM-5-TR® library, books, journals, CME, and patient resources. This all-in-one virtual library provides psychiatrists and mental health professionals with key resources for diagnosis, treatment, research, and professional development.

Need more help? PsychiatryOnline Customer Service may be reached by emailing [email protected] or by calling 800-368-5777 (in the U.S.) or 703-907-7322 (outside the U.S.).

Media

Figures

Other

Tables

Share

Share

Share article link

Share