Full access
Articles
Published Online: 16 August 2023

Networks of Neurodevelopmental Traits, Socioenvironmental Factors, Emotional Dysregulation in Childhood, and Depressive Symptoms Across Development in Two U.K. Cohorts

Publication: American Journal of Psychiatry

Abstract

Objective:

Previous population-based studies have identified associations between childhood neurodevelopmental traits and depression in childhood, adolescence, and young adulthood. However, neurodevelopmental traits are highly correlated with each other, which could confound associations when traits are examined in isolation. The authors sought to identify unique associations between multiple neurodevelopmental traits in childhood and depressive symptoms across development, while taking into account co-occurring difficulties, in multivariate analyses.

Methods:

Data from two U.K. population-based cohorts, the Twins Early Development Study (TEDS) (N=4,407 independent twins) and the Avon Longitudinal Study of Parents and Children (ALSPAC) (N=10,351), were independently analyzed. Bayesian Gaussian graphical models were estimated to investigate pairwise conditional associations between neurodevelopmental traits (autism and ADHD symptoms and general cognitive, learning, and communication abilities), socioenvironmental stressors (academic performance and peer relations), and emotional dysregulation in childhood (ages 7–11) and depressive symptoms across development (ages 12, 16, and 21).

Results:

In both cohorts, bivariate correlations indicated several associations between neurodevelopmental traits and depressive symptoms across development. However, based on replicated findings across cohorts, these pairs of variables were mostly conditionally independent, and none were conditionally associated, after accounting for socioenvironmental stressors and emotional dysregulation. In turn, socioenvironmental stressors and emotional dysregulation were conditionally associated with both neurodevelopmental traits and depressive symptoms. Based on replicated findings across cohorts, neurodevelopmental traits in childhood could be associated only indirectly with depressive symptoms across development.

Conclusions:

This study indicates that associations between childhood neurodevelopmental traits and depressive symptoms across development could be explained by socioenvironmental stressors and emotional dysregulation. The present findings could inform future research aimed at the prevention of depression in youths with neurodevelopmental disorders.
Neurodevelopmental disorders are a group of psychiatric diagnoses with onset early in development, functional impairments across the lifespan, and male predominance (1). Children with neurodevelopmental disorders often do not outgrow their difficulties and are at increased risk of developing other psychiatric conditions, such as depressive disorders (henceforth, depression) (2). For example, children with attention deficit hyperactivity disorder (ADHD) have approximately double the risk for depression across development in comparison to typically developing peers (36). Importantly, depression in the context of ADHD may have an earlier onset (7, 8), may recur more often (9), and possibly may have worse severity (10, 11). Given the impact of depression in the context of neurodevelopmental disorders, prevention is a priority (2). To optimally inform research and interventions aimed at the prevention of depression in youths with neurodevelopmental disorders, the factors that are uniquely associated with depression in this population must be identified.
Neurodevelopmental disorders may be understood as extreme ends of continuous dimensions (1), and thus, examining neurodevelopmental traits in samples from the general population may contribute to our understanding of neurodevelopmental disorders and the development of depression in their context. Previous population-based studies have corroborated associations between neurodevelopmental traits and the emergence of depression, but most of these studies have concentrated on specific traits in isolation, such as symptoms of ADHD (12, 13) or of autism spectrum disorder (henceforth, autism) (14, 15). Yet, evidence suggests that such traits are highly correlated with each other (1) and with other co-occurring difficulties, including emotional dysregulation, relationship problems, and poor academic competence, which could explain the associations between neurodevelopmental traits and depression (2). Hence, the exclusive focus on individual traits, without accounting for the simultaneous effects of other traits or highly correlated co-occurring difficulties and stressors, has limited capacity to clarify their unique associations over the course of development. Consequently, whether previous research findings represent specific associations between certain neurodevelopmental traits in childhood and depression later in life, or whether such findings are confounded by highly correlated factors, is unclear.
The present study aimed at filling this gap. We used data from two U.K. population-based cohorts and estimated Gaussian graphical models (GGMs) to identify unique associations between neurodevelopmental traits (autism and ADHD symptoms and general cognitive, learning, and communication abilities), socioenvironmental stressors (peer relationships and academic competence), and emotional dysregulation in childhood (ages 7–11 years) and depressive symptoms across development (ages 12, 16, and 21 years). GGMs are probabilistic network models that allow all variables to covary, resulting in partial correlations between any two given variables that represent conditionally dependent relationships after the effects of all other variables in the model have been controlled for (16). There is a close relationship between partial correlations and coefficients from multiple regression models, and GGMs may be understood as linking separate multiple regression models, where each variable is regressed against the other variables in the network (17). Hence, GGMs are powerful data-driven tools to map out multicollinearity and predictive mediation (17) and may provide a clearer perspective on complex patterns of associations, such as those that exist between neurodevelopmental traits, socioenvironmental stressors, and emotional dysregulation in childhood and depressive symptoms across development.
We hypothesized that neurodevelopmental traits would be associated with each other; that ADHD symptoms would be associated with depressive symptoms after accounting for other neurodevelopmental traits, socioenvironmental stressors, and emotional dysregulation; and that any association between other neurodevelopmental traits and depressive symptoms would be explained by ADHD symptoms, socioenvironmental stressors, or emotional dysregulation. We hypothesized that ADHD symptoms would be uniquely associated with depressive symptoms because of their shared etiological factors (e.g., high genetic correlation) (18).

Methods

We preregistered our study in Open Science Framework (https://doi.org/10.17605/OSF.IO/QP7ZM). For a copy of the preregistration file and post hoc changes, with reasons, see supplement A in the online supplement.

Participants and Setting

We analyzed data from the Twins Early Development Study (TEDS) and the Avon Longitudinal Study of Parents and Children (ALSPAC), two well-established longitudinal studies across development. For details about both cohorts, see supplement B in the online supplement. For TEDS, as many as 5,554 families (11,108 individuals) were invited to participate in all waves of data collection relevant to the present analyses. For ALSPAC, the total sample size comprises 14,901 children who were alive at 1 year of age.

Variables, Data Sources, and Measurements

We included measures of multiple neurodevelopmental traits, two socioenvironmental stressors, and emotional dysregulation in childhood (ages 7–11 years) and depressive symptoms across development (ages 12, 16, and 21 years) (Table 1). A complete description of variables, measures, and scoring rules is provided in supplement C in the online supplement.
TABLE 1. Domain, subdomain, and scoring information for instruments included in this study, stratified by cohorta
Domain or SubdomainInstrumentRating ScaleItemsScore RangeInformantAge (years)
Twins Early Development Study
Neurodevelopmental traits
 ADHD symptoms
  Hyperactivity-impulsivityCPRS-R4-point Likert90, 27Parents8
  InattentionCPRS-R4-point Likert90, 27Parents8
 Autism symptomsCASTBinary310, 31Parents8
 General cognitive abilityWISC-III, CAT385−3, 3Self9
 Communication ability
  Speech and syntaxCCC3-point Likert80, 16Parents9
  PragmaticCCC3-point Likert40, 8Parents9
 Learning abilityPIAT820, 82Self10
Co-occurring emotional dysregulation and socioenvironmental stressors
 Emotional dysregulationSDQ-DP3-point Likert50, 10Parent9
 Peer relationshipsSDQ-PP3-point Likert50, 10Parent9
 Academic competenceKS2 assessment5-point Likert99, 45Teacher10
Depressive symptoms
 Depressive symptomsSMFQ3-point Likert130, 26Self12, 16
 Depressive symptomsSMFQ3-point Likert80, 16Self21
Avon Longitudinal Study of Parents and Children
Neurodevelopmental traits
 ADHD symptoms
  Hyperactivity-impulsivityDAWBA3-point Likert90, 18Parents7.58
  InattentionDAWBA3-point Likert90, 18Parents7.58
 Autism symptomsSCDC3-point Likert120, 24Parents7.58
 General cognitive abilityWISC-III45, 151Self8.5
 Communication ability
  Speech and syntaxCCC3-point Likert1545, 70Parents9.58
  PragmaticCCC3-point Likert3896, 162Parents9.58
 Learning abilityWORD0, 50Self7.5
Co-occurring emotional dysregulation and socioenvironmental stressors
 Emotional dysregulationSDQ-DP3-point Likert50, 10Parents9.58
 Peer relationshipsSDQ-PP3-point Likert50, 10Parents9.58
 Academic competenceKS2 point score0, 9911
Depressive symptoms
 Depressive symptomsSMFQ3-point Likert130, 26Self12, 16, 21
a
CAST=Childhood Autism Spectrum Test; CAT3=Cognitive Abilities Test, 3rd ed.; CCC=Children’s Communication Checklist; CPRS-R=Conners’ Parent Rating Scale–Revised, attention deficit hyperactivity disorder sections; DAWBA=Development and Well-Being Assessment, attention deficit hyperactivity disorder section; KS2=Key Stage 2; PIAT=Peabody Individual Achievement Test; SCDC=Social and Communication Disorders Checklist; SDQ-DP=Strengths and Difficulties Questionnaire, dysregulation profile; SDQ-PP=Strengths and Difficulties Questionnaire, peer problems; SMFQ=Short Mood and Feelings Questionnaire; WISC-III=Wechsler Intelligence Scale for Children, 3rd ed. (U.K. version); WORD=Wechsler Objective Reading Dimensions.
We selected variables based on the theoretical and operational aspects of neurodevelopmental disorders and their association with depression, previous research, and the availability of measurements in the cohorts. We selected variables only if data for that domain were available to us from both TEDS and ALSPAC. Our choice of domains for neurodevelopmental traits was informed by the approach of DSM-5, which groups ADHD, autism, intellectual disability, communication disorders, and specific learning disorders as neurodevelopmental disorders. The selected measures and instruments were similar to those used in previous studies (19, 20). Our choice of domains for socioenvironmental stressors was informed by the fact that children with neurodevelopmental disorders often experience greater difficulty in peer relationships and schoolwork than typically developing children, which may contribute to the development of depression (2, 21). Additionally, previous research has suggested that peer relationships and academic competence may mediate the association between specific neurodevelopmental traits and depression (13, 22), although conflicting findings have also been found (23). Our choice of instrument for the assessment of emotional dysregulation included items from the emotional, hyperactivity, and conduct scales of the Strengths and Difficulties Questionnaire (SDQ) (24), and therefore it may have some overlap with the measures of depression and ADHD.
For each variable, we adopted prorated continuous scores. Although individual items have been more widely used in GGMs, other studies (25) have employed scores given some of their advantages, such as decreased estimation problems (26) and increased interpretability.

Statistical Analysis

We conducted analyses for each cohort separately. We excluded individuals for whom all neurodevelopmental trait data were missing. We also excluded additional individuals from TEDS, adhering to the cohort’s standard exclusion routines (see supplement D in the online supplement). Our TEDS and ALSPAC analyses included 4,407 and 10,351 individuals, respectively.
We adopted multiple imputation of 50 data sets with the R package mice (27) for individuals who provided data on at least one neurodevelopmental trait (for the proportion of missing data for each variable, see supplement E in the online supplement). We also applied the shrunken empirical cumulative distribution function to conduct nonparanormal transformation of variables with the R package huge (function “huge.npn”) (28) because the distributions of our variables were skewed.
We calculated Pearson correlation coefficients (r) to estimate zero-order correlations (i.e., unadjusted associations) between neurodevelopmental traits in childhood and depressive symptoms across development. To adjust for multiple testing, we derived a p threshold of 2.38x10⁻³ by applying a Bonferroni correction to the nominal alpha of 0.05 (adjusted for the 21 pairings tested).
To estimate GGMs, we adopted the Bayesian approach (29) with the R package BGGM (30). We fitted a model for each imputed data set and pooled their estimates for the primary analysis (function “bggm_missing”). We set the prior scale to 0.2 and drew 10,000 samples from the posterior distribution. Initially, we estimated GGMs with neurodevelopmental traits alone, and then, we estimated GGMs with all variables. Visual inspection of trace plots demonstrated acceptable mixing of chains, and these plots are available in Open Science Framework (https://doi.org/10.17605/OSF.IO/P7WMK).
We quantified the support in the data for two competing, complementary hypotheses for each partial correlation (ρ) (H1: ρ≠0, H0: ρ=0) with the Bayes factor (BF) (31). To determine whether two variables were conditionally independent given the other variables (i.e., ρ=0), we calculated BF01 and used BF01≥3 as the threshold to determine that there was sufficient evidence to accept H0 (ρ=0). To determine whether two variables were associated with each other after accounting for the remaining variables (i.e., ρ≠0), we calculated the reciprocal BF10 and used BF10≥3 as the threshold to determine that there was sufficient evidence to accept H1 (ρ≠0). When both BF10<3 and BF01<3, we classified the partial correlations as “ambiguous.” An equivalent approach would be to calculate BF10 only and consider BF10≥3 as sufficient evidence for H1, BF10≤0.33 as sufficient evidence for H0, and 0.33<BF10<3 as insufficient evidence (ambiguous). We opted for a BF threshold of 3 because this threshold has been demonstrated to return desirable asymptotic properties in a simulation study (32). However, because the BF is a continuous metric and higher values indicate stronger evidence (33), we also report BF values to indicate the strength of evidence in favor of H1 or H0 for each pair of variables (see supplement F in the online supplement).
We drew inferences only on findings that were replicated in TEDS and ALSPAC. We calculated the network density (the number of estimated conditional associations relative to the total number of possible conditional associations) to provide an indication of how well connected the variables were. For the conditional associations for which we accepted H1 (ρ≠0), we estimated the magnitude of ρ by extracting the posterior mean with a 95% credible interval (CrI). We compared the relative magnitude of the replicated ρ by computing the r of the weighted adjacency matrices of the two cohorts. To provide a graphical illustration of the GGMs, we plotted networks based on the Fruchterman-Reingold algorithm with the R package qgraph (34) and fixed the average layout to facilitate interpretation. To evaluate whether symptoms would form clusters, we estimated the nature and number of groups of symptoms across 5,000 iterations with the spinglass algorithm (35). The spinglass algorithm provides both node-level information (which nodes are grouped together) and community-level information (the frequency of community structures across iterations). We converted partial correlations to standardized regression coefficients (β) (29). In an attempt to provide effect sizes for the indirect associations, we extrapolated from mediation analyses and calculated a version of the index of mediation, abcsMX×βYM (36), with the converted β despite the fact that βMX is also adjusted for Y in our GGM analyses. To quantify how well depressive symptoms were predicted by all remaining nodes, we calculated the Bayesian R2 (29).
The robustness of our findings was examined in sensitivity analyses performed by increasing (SD=0.4) and decreasing (SD=0.1) the prior scale, by only including individuals with neurodevelopmental trait data that were ≥70% complete (N=3,106 for TEDS; N=7,756 for ALSPAC), and by adjusting for differences in age at data collection and sex by using the residuals from linear regression models to estimate GGMs.

Results

Neurodevelopmental Traits

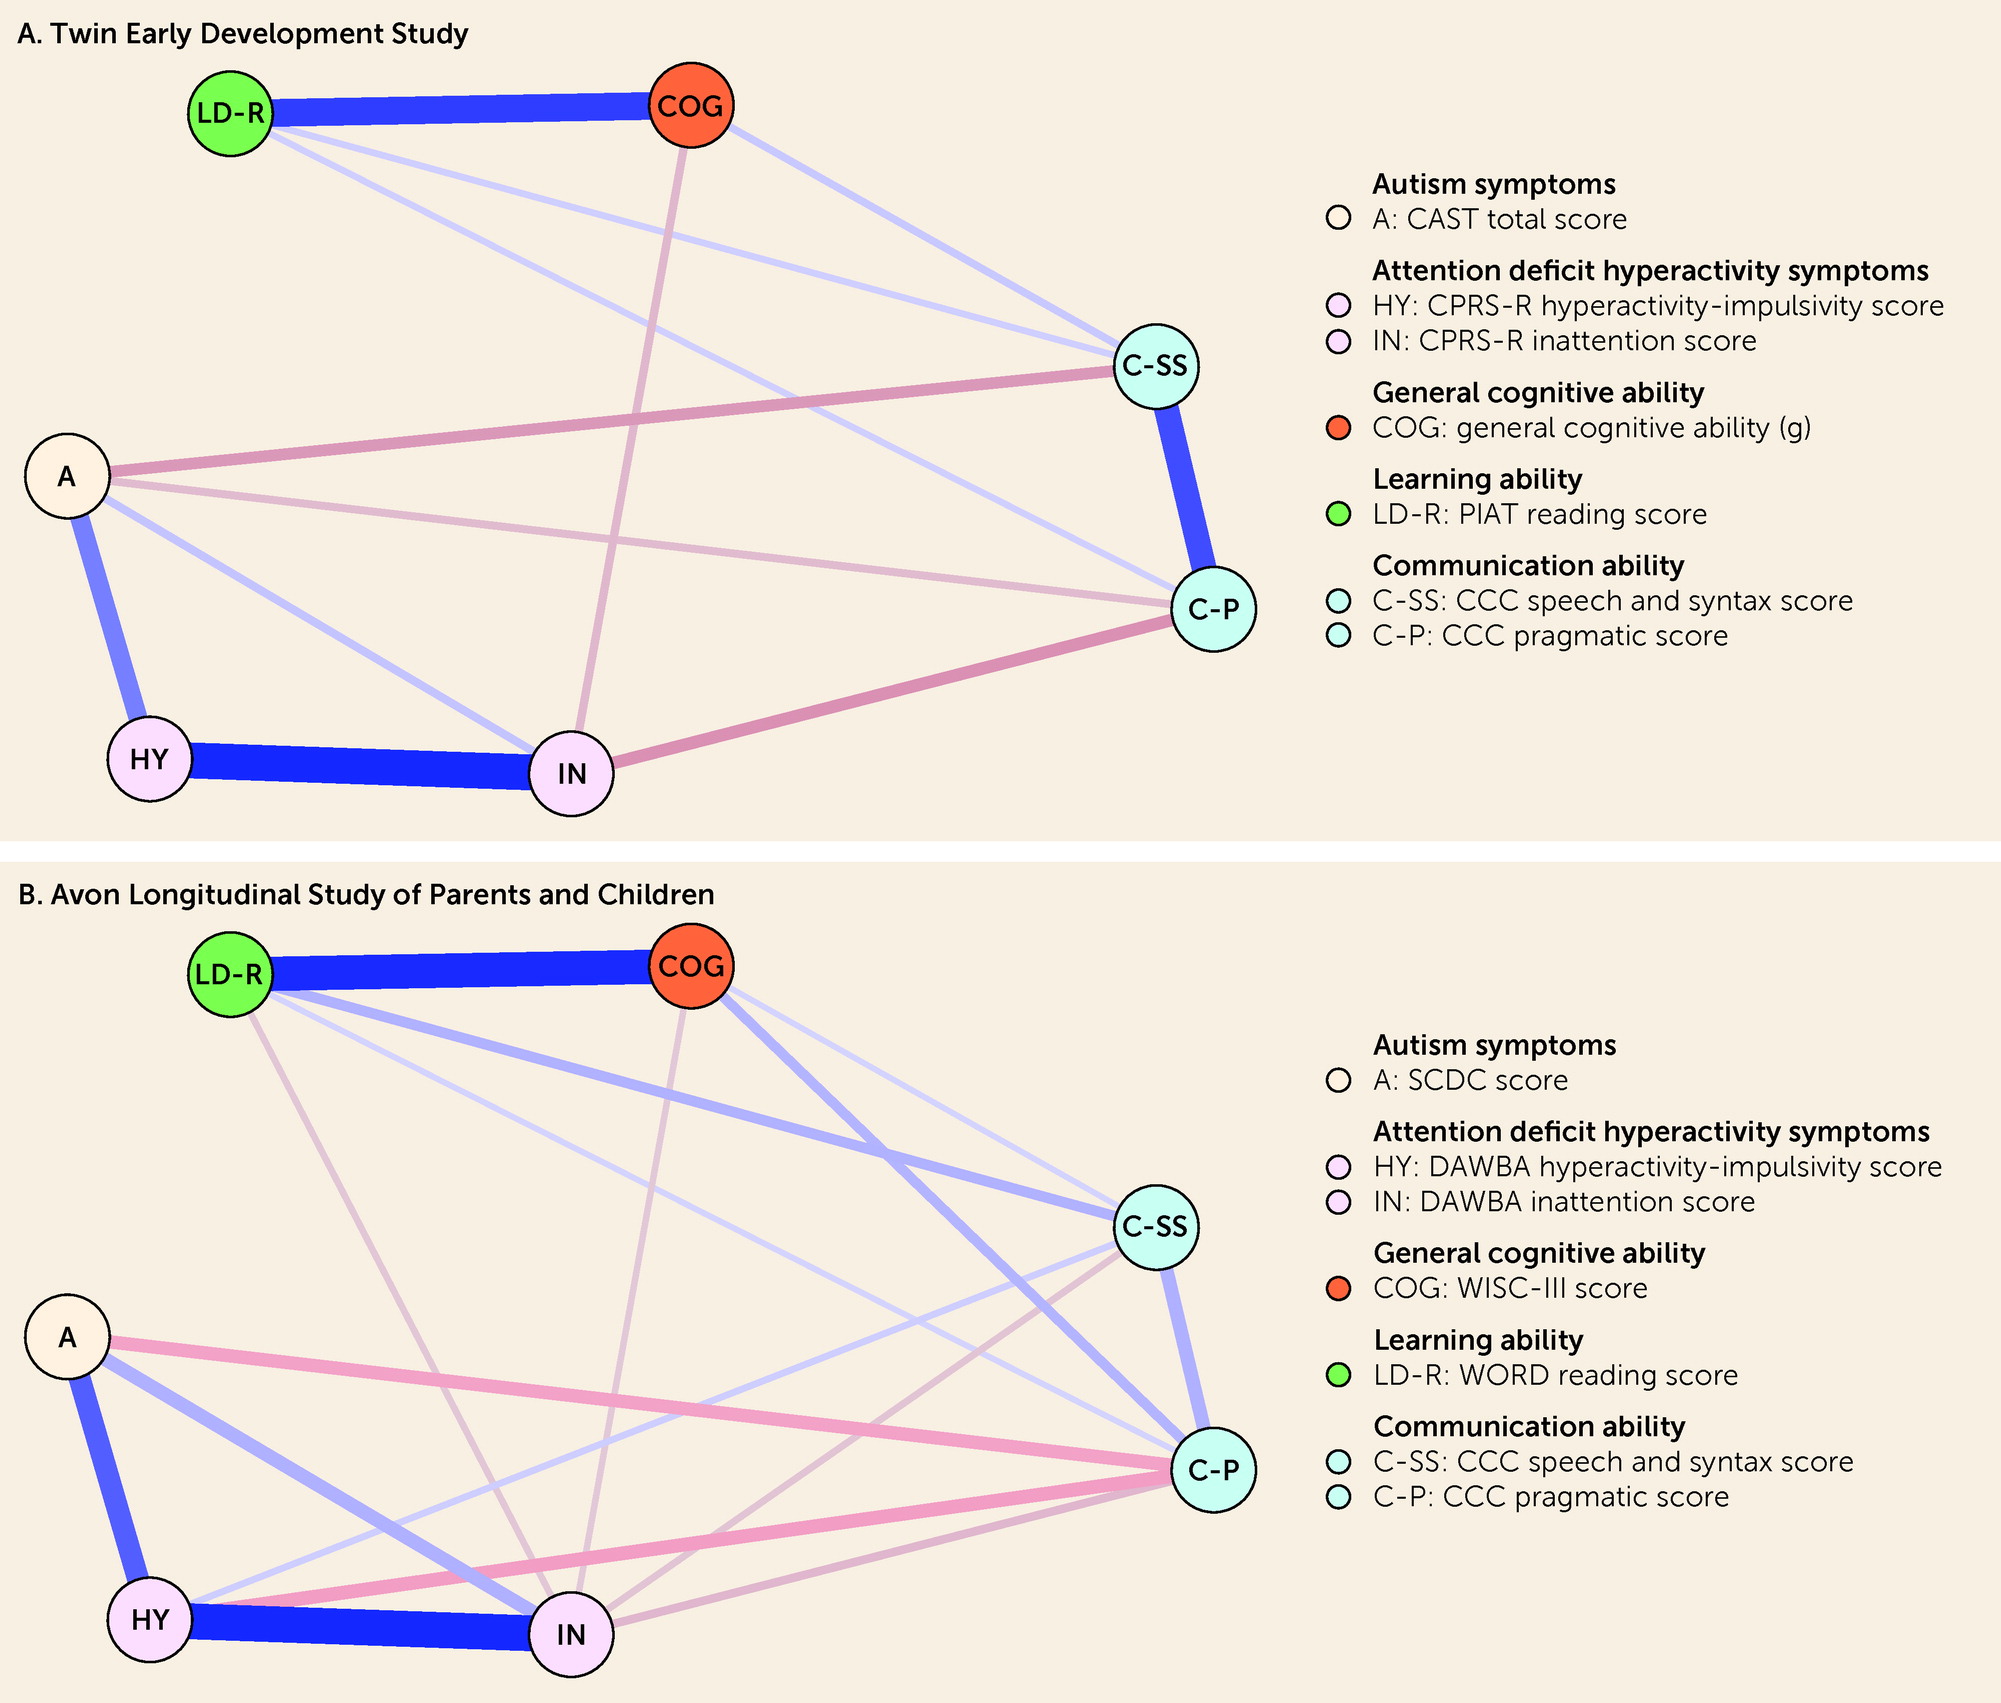
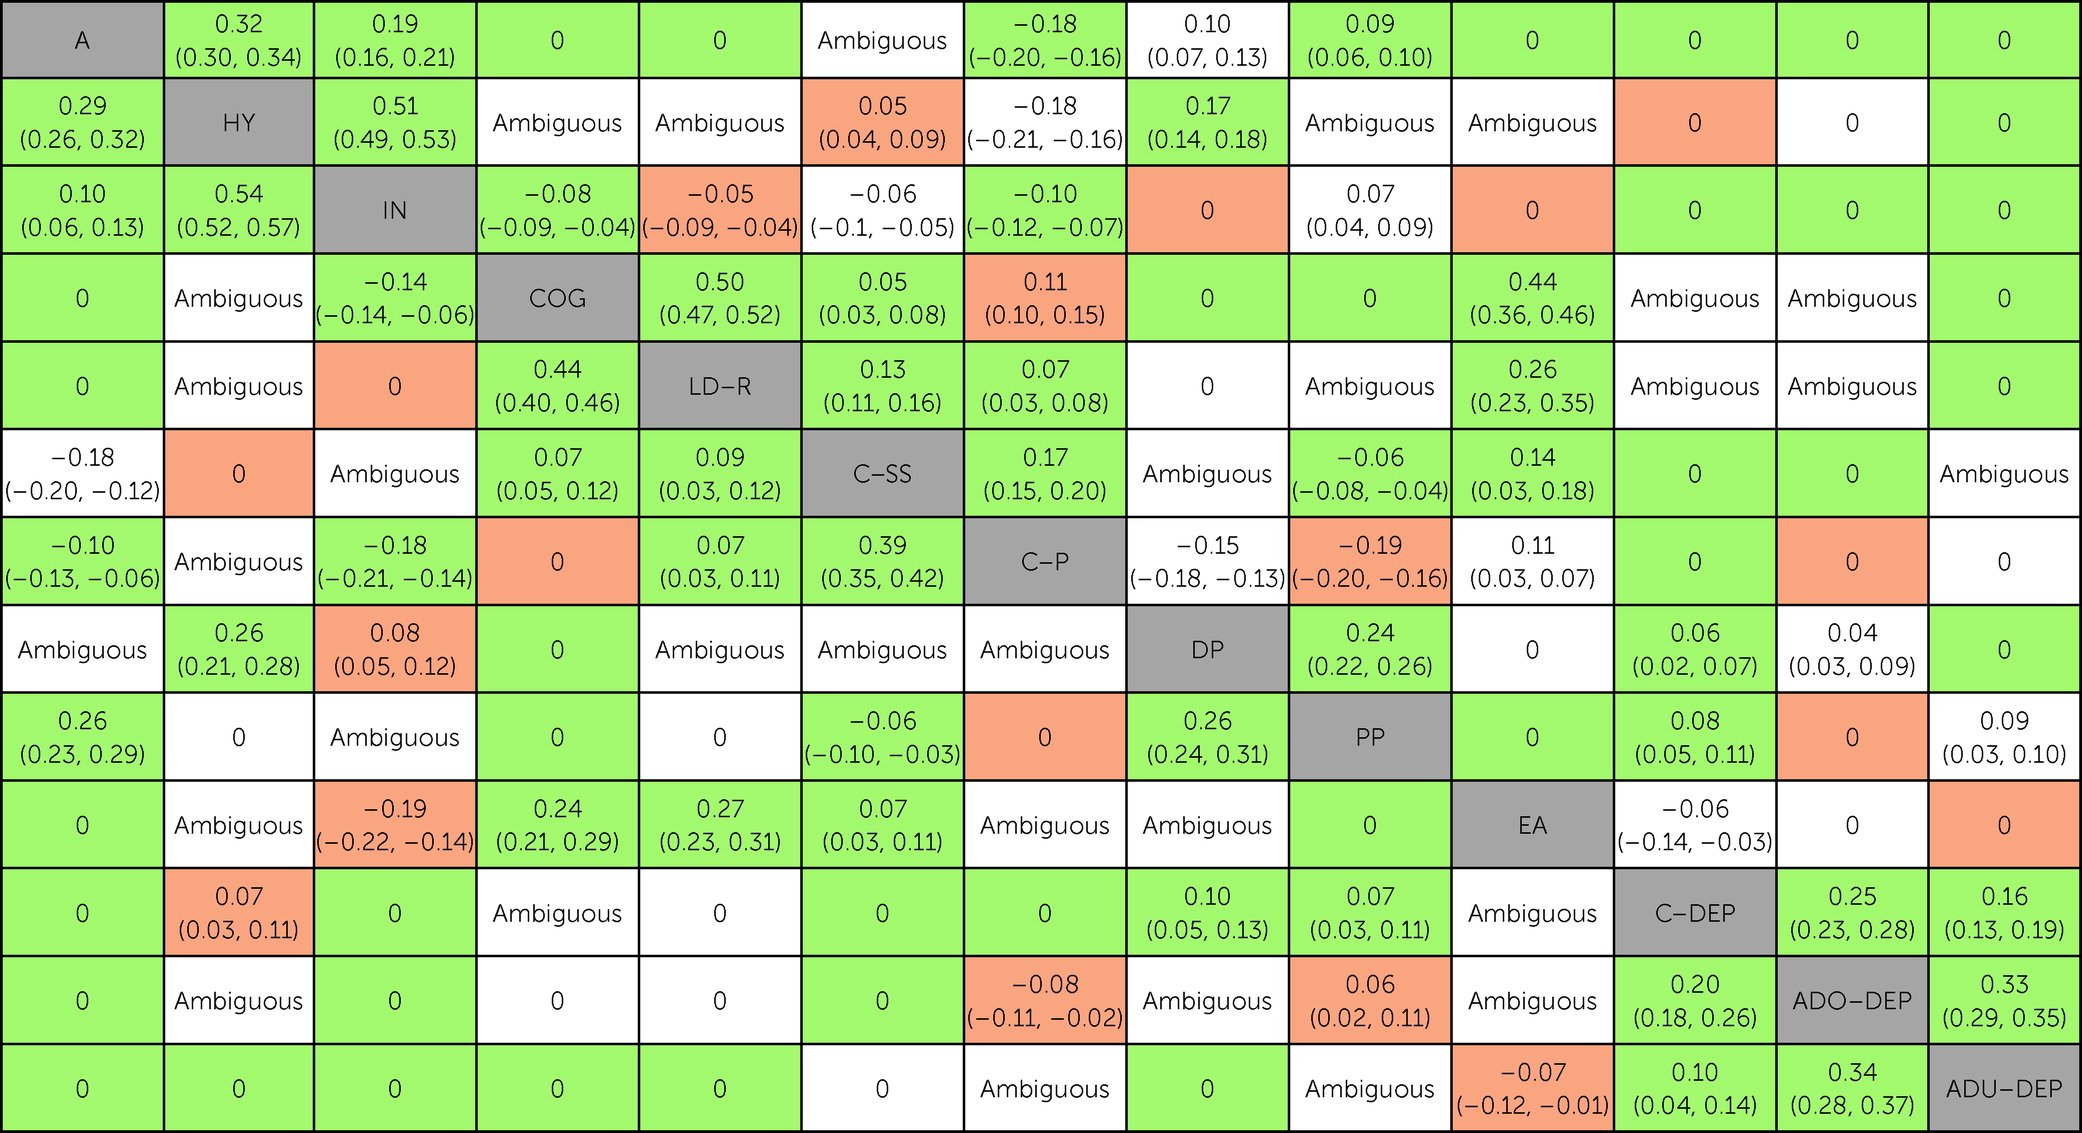
Findings from the two cohorts supported the presence of 11 (52%) of the 21 possible conditional associations between pairs of neurodevelopmental traits (Figure 1). The relative magnitude of ρ for these associations was similar across cohorts (r=0.93), as was the order of the strongest associations: hyperactive-impulsive symptoms and inattentive symptoms; general cognitive ability and learning ability; autism symptoms and hyperactive-impulsive symptoms (Figure 2). Additionally, analyses of data from the two cohorts indicated that only two (9.5%) of the 21 pairs of variables were conditionally independent given the other neurodevelopmental traits: autism symptoms and both general cognitive and learning abilities (Figure 2).
FIGURE 1. Network plots for neurodevelopmental traits in childhooda
aVariables are represented as nodes (circles) and are colored according to their domain. Edges between two nodes represent partial correlations between two variables. The width of an edge is proportional to the strength of the partial correlation. Positive and negative partial correlations are blue and red, respectively. CAST=Childhood Autism Spectrum Test; CCC=Children’s Communication Checklist; CPRS-R=Conners’ Parent Rating Scale–Revised; DAWBA=Development and Well-Being Assessment; PIAT=Peabody Individual Achievement Test; SCDC=Social and Communication Disorders Checklist; WISC-III=Wechsler Intelligence Scale for Children, 3rd ed. (U.K. version); WORD=Wechsler Objective Reading Dimensions.
FIGURE 2. Relative magnitude of conditional associations between neurodevelopmental traits, socioenvironmental stressors, and emotional dysregulation in childhood and depressive symptoms across developmenta
aThe values for the Twins Early Development Study are presented below the diagonal, and the values for the Avon Longitudinal Study of Parents and Children are presented above the diagonal. Values are the posterior means with 95% credible intervals. Values for the neurodevelopmental traits are from the model including only neurodevelopmental traits. Green indicates results that were replicated in the two cohorts, orange indicates results that are discordant between the two cohorts, and white indicates results that were ambiguous in at least one of the cohorts. A=autism symptoms; ADO-DEP=adolescent depressive symptoms; ADU-DEP=adult depressive symptoms; C-DEP=childhood depressive symptoms; COG=general cognitive ability; C-P=communication ability–pragmatic; C-SS=communication ability–speech and syntax; DP=emotional dysregulation; EA=educational achievement; HY=hyperactivity or impulsivity symptoms; IN=inattentive symptoms; LD-R=learning ability; PP=peer problems.

Neurodevelopmental Traits, Socioenvironmental Stressors, and Emotional Dysregulation

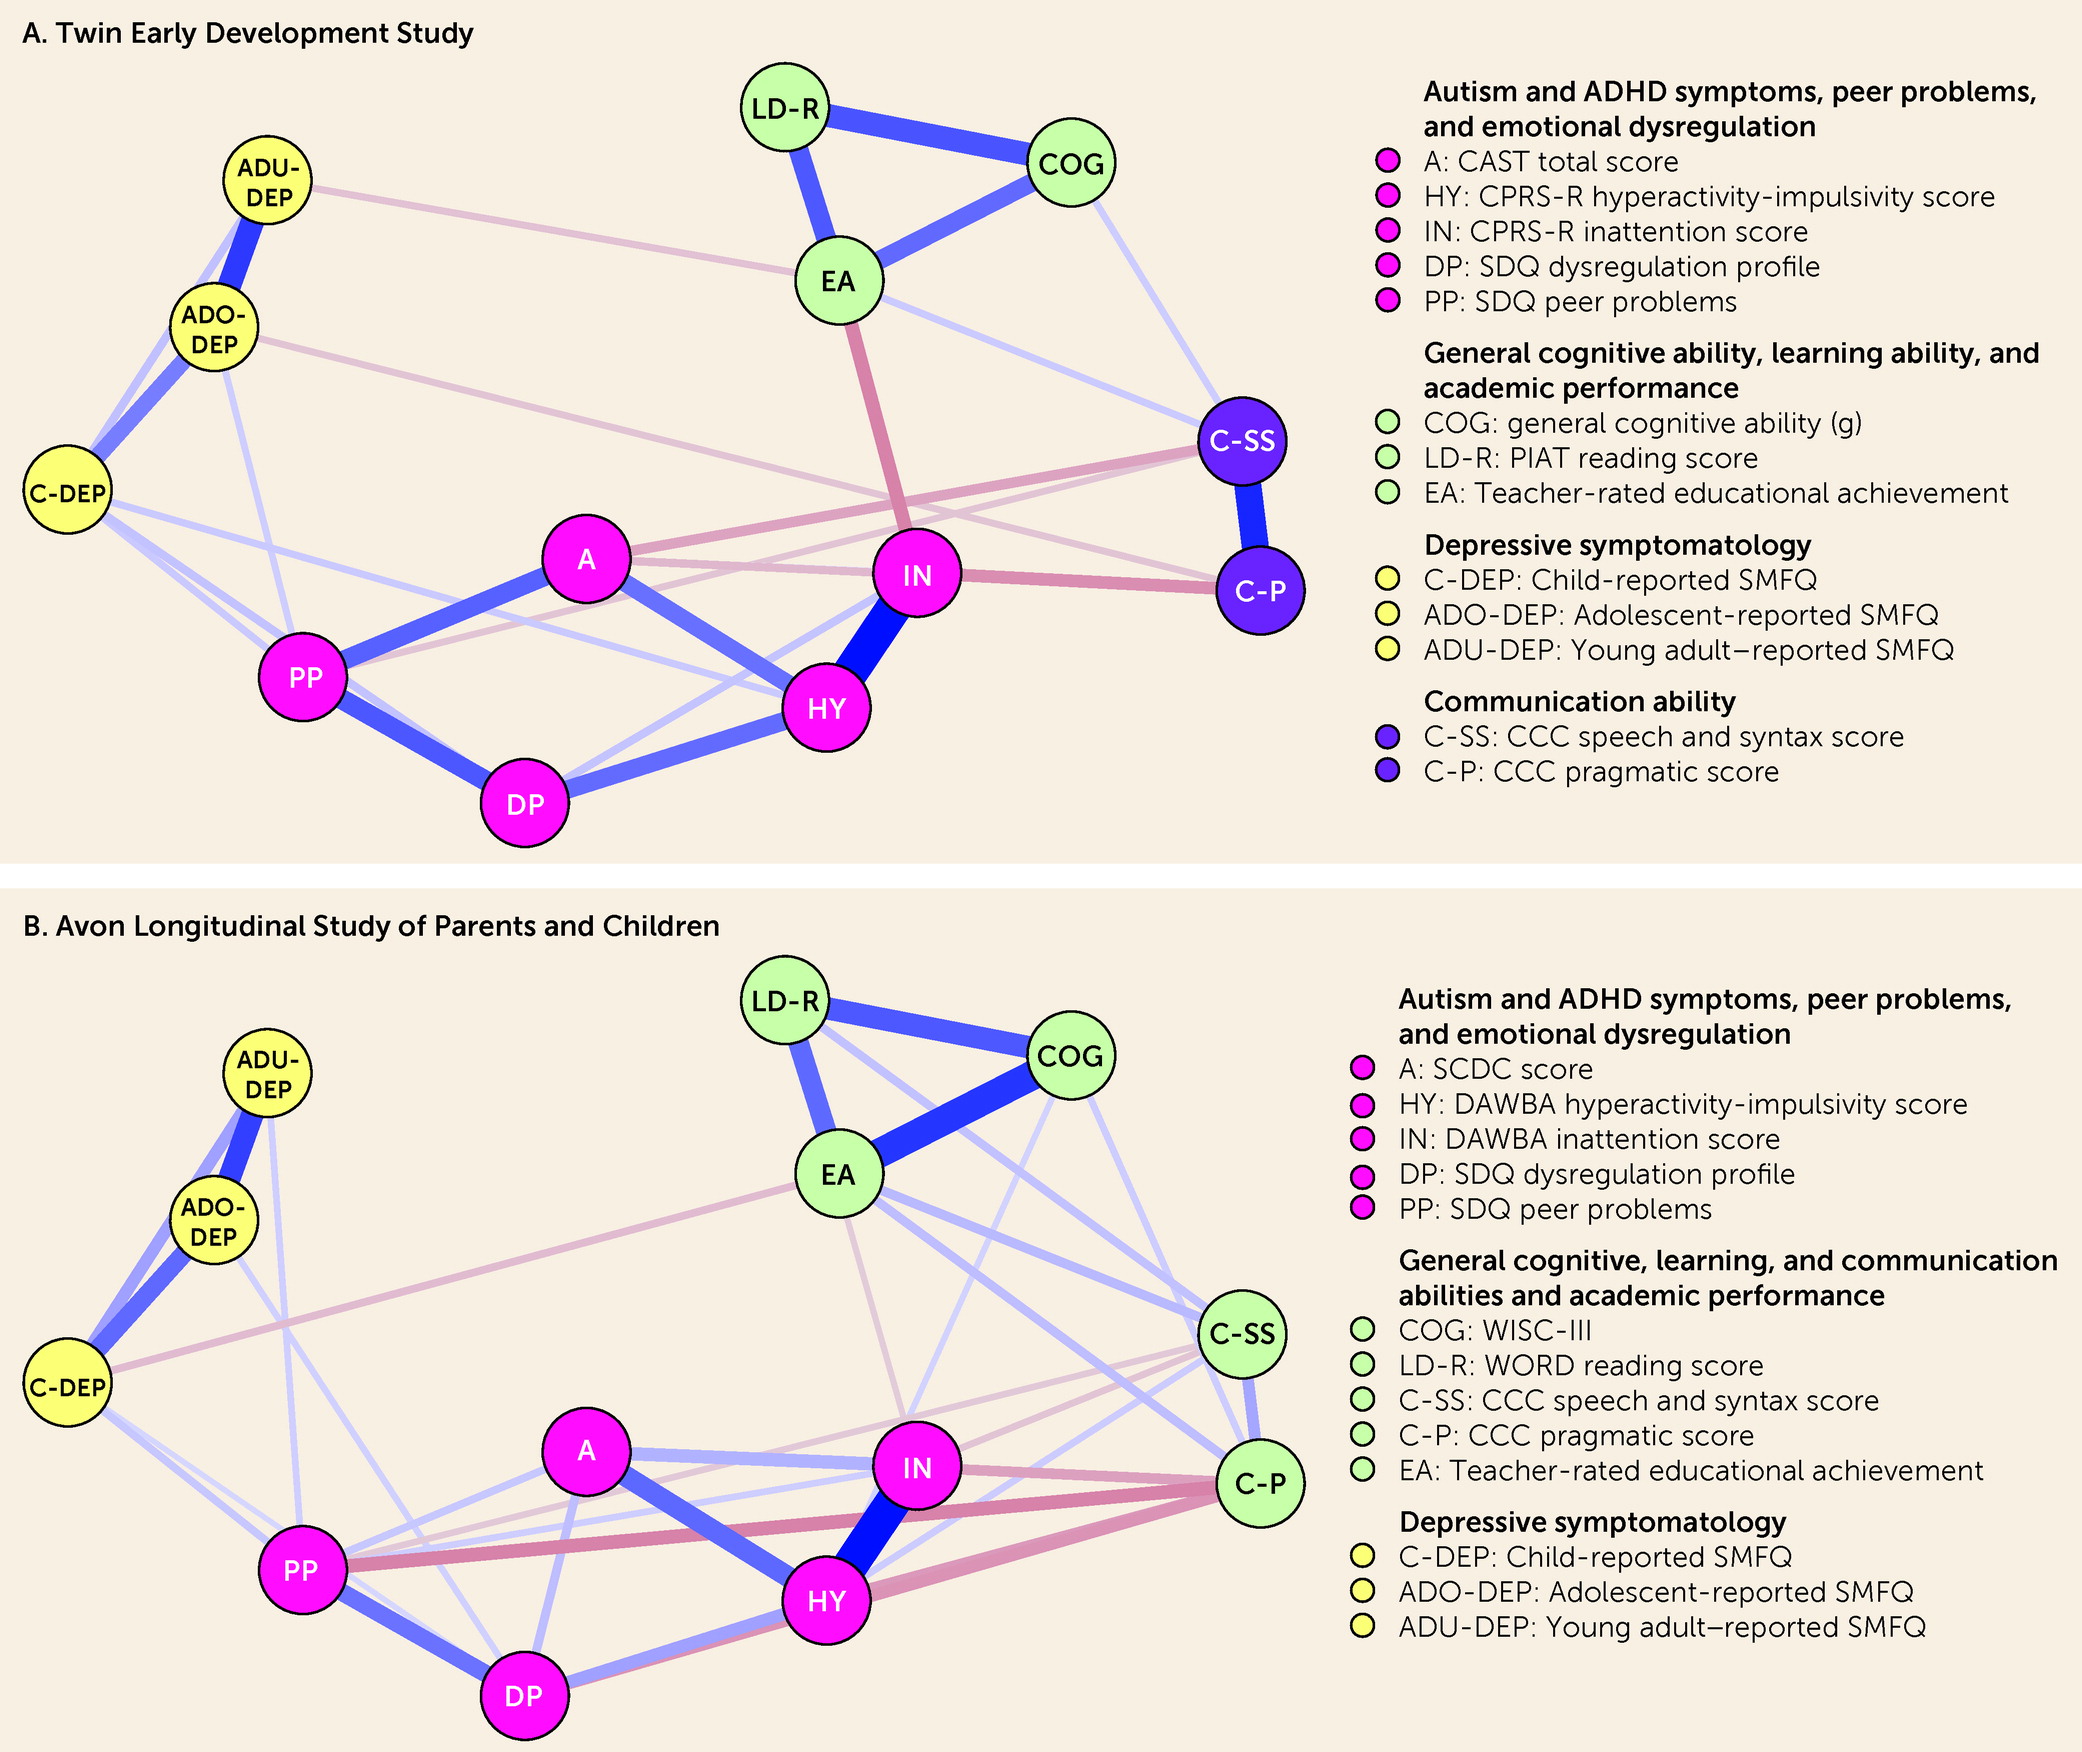
Findings from the two cohorts supported the presence of six (29%) of the 21 possible conditional associations between neurodevelopmental traits, socioenvironmental stressors, and emotional dysregulation (Figure 3). The relative magnitude of ρ for these associations was similar across cohorts (r=0.66), as was the order of the strongest associations: general cognitive, learning abilities, and academic competence; hyperactive-impulsive symptoms and emotional dysregulation (Figure 2). Additionally, analyses of data from the two cohorts indicated that three (14.5%) of the 21 pairs of variables were conditionally independent given the other variables: general cognitive ability and both emotional dysregulation and peer problems, and autism symptoms and academic competence (Figure 2).
FIGURE 3. Network plots for neurodevelopmental traits, socioenvironmental stressors, and emotional dysregulation in childhood and depressive symptoms across developmenta
aVariables are represented as nodes (circles) and are colored according to their community as identified by the spinglass algorithm. These exact cluster solutions were retrieved in 93% and 88% of the 5,000 iterations for the Twins Early Development Study and the Avon Longitudinal Study of Parents and Children, respectively. Edges between two nodes represent partial correlations between two variables. The width of an edge is proportional to the strength of the partial correlation. Positive and negative partial correlations are blue and red, respectively. CAST=Childhood Autism Spectrum Test; CCC=Children’s Communication Checklist; CPRS-R=Conners’ Parent Rating Scale–Revised; DAWBA=Development and Well-Being Assessment; PIAT=Peabody Individual Achievement Test; SCDC=Social and Communication Disorders Checklist; SDQ=Strengths and Difficulties Questionnaire; SMFQ=Short Mood and Feelings Questionnaire; WISC-III=Wechsler Intelligence Scale for Children, 3rd ed. (U.K. version); WORD=Wechsler Objective Reading Dimensions.

Neurodevelopmental Traits and Depressive Symptoms

There were 12 significant unadjusted associations between neurodevelopmental traits and depressive symptoms across development (for zero-order correlations, see supplement G in the online supplement). However, findings from the two cohorts did not support the presence of any conditional associations between neurodevelopmental traits and depressive symptoms across development (Figure 3).
Instead, analyses of data from both cohorts indicated that 12 (57%) of these 21 pairs of variables were conditionally independent given the other variables: childhood depressive symptoms and autism symptoms, inattentive symptoms, and communication abilities; adolescent depressive symptoms and autism symptoms, inattentive symptoms, and speech and syntax communication ability; and early adulthood depressive symptoms and autism symptoms, ADHD symptoms, general cognitive ability, and learning ability (Figure 2). Notably, nine of the 12 pairs of variables with significant unadjusted associations were found conditionally independent in GGMs.
The community detection algorithm corroborated that depressive symptoms were segregated from neurodevelopmental traits in the network through the identification of unique clusters for depressive symptoms in both cohorts (Figure 3). Additionally, small proportions of the variance of depressive symptoms in childhood, adolescence, and early adulthood were explained by the remaining variables in the model as indexed by Bayesian R2 (see supplement H in the online supplement).

Socioenvironmental Stressors, Emotional Dysregulation, and Depressive Symptoms

Findings from both cohorts supported the presence of two (22%) of nine possible conditional associations between socioenvironmental stressors, emotional dysregulation, and depressive symptoms: childhood depressive symptoms and both emotional dysregulation and peer problems. Additionally, depressive symptoms (during childhood, adolescence, or early adulthood) were also conditionally associated with academic competence in the two cohorts (Figure 3).
Based on the index of mediation (see supplement I in the online supplement), childhood depressive symptoms increased by 0.028 (95% CrI=0.014, 0.045) and 0.011 (95% CrI=0.004, 0.019) standard deviations for every one-standard-deviation increase in hyperactivity-impulsivity symptoms in an indirect manner via emotional dysregulation in TEDS and ALSPAC, respectively. Similarly, childhood depressive symptoms increased by 0.022 (95% CrI=0.010, 0.037) and 0.007 (95% CrI=0.003, 0.014) standard deviations for every one-standard-deviation increase in autism symptoms in an indirect manner via peer problems in TEDS and ALSPAC, respectively.

Sensitivity Analyses

The findings did not change considerably in the sensitivity analyses. We did not find conditional associations between neurodevelopmental traits and depressive symptoms but continued to find conditional associations between socioenvironmental stressors, emotional dysregulation, and neurodevelopmental traits and depressive symptoms. For a summary of changes in the sensitivity analyses, network plots, and tables with the magnitude of ρ for all sensitivity analyses, see supplement J in the online supplement.

Discussion

In this study, we evaluated the unique associations between neurodevelopmental traits, socioenvironmental stressors, and emotional dysregulation in childhood and depressive symptoms across development using data from two well-established U.K. longitudinal studies. By adopting a Bayesian approach, we were able to classify whether there was sufficient evidence in favor of a conditional association (i.e., non-zero partial correlation), conditional independence (i.e., partial correlation of zero), or insufficient evidence (i.e., “ambiguous”) for each pair of variables. Findings from the two cohorts supported the presence of numerous conditional associations between pairs of neurodevelopmental traits. There were several significant unadjusted associations (based on zero-order correlations) between neurodevelopmental traits and depressive symptoms across development; however, based on replicated data across cohorts, most of these pairs of variables with significant unadjusted associations were found conditionally independent, and none were conditionally associated, after accounting for socioenvironmental stressors and emotional dysregulation. In turn, socioenvironmental stressors and emotional dysregulation were conditionally associated with both neurodevelopmental traits and depressive symptoms, particularly during childhood. Based on replicated data across cohorts, neurodevelopmental traits in childhood could only be indirectly connected to depressive symptoms across development. Taken together, the present findings indicate that associations between neurodevelopmental traits in childhood and depressive symptoms across development could be explained by socioenvironmental stressors and emotional dysregulation.
We found numerous conditional associations between pairs of neurodevelopmental traits in childhood, which reinforces the importance of considering multiple neurodevelopmental traits simultaneously, rather than examining them individually, in future studies conducted with samples from the general population. Whether our findings will generalize to clinical samples is unclear, particularly for some of our unexpected findings (for example, autism symptoms were independent from general cognitive and learning abilities given the other traits). Because children with neurodevelopmental disorders often present with symptoms from multiple neurodevelopmental disorders simultaneously (1), it is possible that similar associations would be found in a clinical sample, and future research should examine this question directly. It would be of particular interest to evaluate how neurodevelopmental traits are related to each other in a transdiagnostic sample of individuals diagnosed with neurodevelopmental disorders. Despite some consensus over the need to move beyond discrete diagnostic classification (37), there has been relatively little clinical transdiagnostic research in the field.
We found several significant unadjusted associations between neurodevelopmental traits in childhood and depressive symptoms across development, which is in line with previous findings from population-based studies (1215, 19). However, we expanded on this literature by demonstrating that, based on replicated findings across cohorts, most of these pairs of variables with significant unadjusted associations were found conditionally independent after accounting for the effects of socioenvironmental stressors and emotional dysregulation in multivariate analyses. Notably, based on replicated findings across cohorts, because neurodevelopmental traits in childhood could only be indirectly connected to depressive symptoms across development, any predictive effect from the former to the latter would be mediated by socioenvironmental stressors and emotional dysregulation in childhood. These findings suggest that intervening on socioenvironmental stressors and emotional dysregulation could contribute to the prevention of depression in children and young people with neurodevelopmental disorders. Overall, these indirect associations had small effects, but effective prevention efforts for depression will likely need to manage numerous risk factors with small effects (38), including prevention efforts in the context of neurodevelopmental disorders. Consistent with this notion, in the context of ADHD, there is some preliminary evidence that programs focused on emotional dysregulation and family support may be efficacious in reducing depressive symptoms (39). Additional research should continue to examine this important approach in ADHD and other neurodevelopmental disorders.
Our findings provide strong evidence that associations between childhood neurodevelopmental traits and depressive symptoms across development could be explained by socioenvironmental stressors and emotional dysregulation, which is in line with theories about adult disorders with childhood antecedents (40). However, we cannot definitively rule out the possibility of an association between neurodevelopmental traits in childhood and depressive symptoms across development because the absence of evidence does not equate to evidence of absence. Specifically, there were significant associations in unadjusted analyses but inconclusive evidence in GGMs for three pairs of variables involving neurodevelopmental traits and depressive symptoms for at least one time point. We found insufficient evidence (“ambiguous”) for associations between hyperactivity-impulsivity symptoms and adolescent depressive symptoms in TEDS, and we found discordant findings across TEDS and ALSPAC for associations between hyperactivity-impulsivity symptoms and childhood depressive symptoms and between pragmatic communication ability and adolescent depressive symptoms. GGMs require large samples to identify multiple small effects simultaneously, and even though our analyses included thousands of individuals, it is expected that some associations would be classified as “ambiguous” or fail to replicate (41, 42). Additional studies are required to clarify these questions definitively.
The greatest strength of our study was the rigorous methodology that was adopted to increase confidence in our findings. Specifically, we formally tested the null hypothesis of conditional independence, we independently analyzed data from two cohorts, and we conservatively drew inferences for replicated associations only. Although the models were not identical, we were able to identify similar patterns of associations across the two cohorts that corroborated our hypotheses. GGMs are explorative in nature, and they are an ideal tool for hypothesis generation (43). Our findings generated several hypotheses that should be tested—for example, using causal models such as directed acyclic graphs in clinical samples, which could contribute to advancing our understanding of the association between neurodevelopmental disorders and depression, as well as informing research aimed at the prevention of depression in youths with neurodevelopmental disorders.
Our study also has limitations. First, we were unable to include other important socioenvironmental stressors, such as home chaos and parent-child relationships. Variable selection in GGMs is driven by substantive considerations (43), and some have argued that researchers should select the minimally complete set of variables to model the phenomena of interest considering the clinical hypothesis (44). In GGMs, the associations between variables are dependent on the variables that are included in the model. We expect that including additional socioenvironmental stressors would strengthen the direction of the findings presented in this study since the inclusion of only a few variables explained most of the unadjusted associations between neurodevelopmental traits and depressive symptoms. Additional research could investigate this question directly if more measurements are available.
Second, there may be content overlap across some of the domains included in our analyses, which may have influenced our findings. Most notably, the measure of emotional dysregulation is partially composed of items belonging to the emotional and hyperactivity components of the SDQ scales, which may have some overlap with the measures for depressive and ADHD symptoms, respectively. However, empirical data have shown that the Child Behavior Checklist–dysregulation profile (CBCL-DP), a related measure of emotional dysregulation that is composed of three similar syndrome scales (anxious or depressed, attention problems, and aggressive behavior), is distinct from each of its components either alone or in tandem (45). Additionally, the issue of content overlap has been discussed across other domains—for example, ADHD and autism symptoms (46)—and may underscore a broader limitation of the current conceptualization of psychiatric phenomena; this issue might be applicable to other transdiagnostic studies.
Third, it is possible that the associations between depressive symptoms and neurodevelopmental traits would have been more robust if a strict phenotype of depression (e.g., major depressive disorder) had been considered rather than relying on depressive symptoms alone (12). However, we opted to use dimensional scores rather than dichotomizing based on rating scale cutoffs because the latter approach has been shown to negatively impact the recovery performance of networks (47).
Fourth, the neurodevelopmental trait data were collected at different time points spanning 2-year intervals from ages 8–10 (in TEDS) and ages 7–9 (in ALSPAC). Although this is not ideal because neurodevelopmental traits undergo maturational changes, children at these ages are at relatively similar developmental stages.
Lastly, both cohorts are susceptible to nonrandom attrition. For instance, in ALSPAC, it has been demonstrated that individuals at elevated risk of psychopathology are more likely to drop out of the study (48). Detailed cohort-level attrition rates have been reported in previous publications (49, 50). However, we used different statistical methods (multiple imputation and completer analyses) to assess the impact of missingness and found similar patterns of results.
In summary, our study adopted rigorous methodology and provided relevant findings for future research in the field of neurodevelopmental disorders and depression. Our findings indicate that associations between neurodevelopmental traits in childhood and depressive symptoms across development could be explained by socioenvironmental stressors and emotional dysregulation. These findings could both improve our understanding of the association between neurodevelopmental disorders and depression and inform research aimed at the prevention of depression in youths with neurodevelopmental disorders.
Acknowledgments

The authors gratefully acknowledge the participants in the Twins Early Development Study and their families. TEDS is supported by a program grant from the U.K. Medical Research Council (grants MR/V012878/1 and MR/M021475/1), with additional support from NIH (grant AG-046938). The authors are also grateful to the families who took part in the Avon Longitudinal Study of Parents and Children (ALSPAC), the midwives for their help in recruiting them, and the whole ALSPAC team, which includes interviewers, computer and laboratory technicians, clerical workers, research scientists, volunteers, managers, receptionists, and nurses. The U.K. Medical Research Council and Wellcome Trust (grant 217065/Z/19/Z) and the University of Bristol provide core support for ALSPAC. A comprehensive list of grant funding is available on the ALSPAC website (http://www.bristol.ac.uk/alspac/external/documents/grant-acknowledgements.pdf). The authors thank Prof. Angelica Ronald, Ph.D., at Birkbeck University of London, for her support and comments with the proposed plan with TEDS.

Supplementary Material

File (appi.ajp.20220868.ds001.pdf)

References

1.
Thapar A, Cooper M, Rutter M: Neurodevelopmental disorders. Lancet Psychiatry 2017; 4:339–346
2.
Thapar A, Livingston LA, Eyre O, et al: Attention-deficit hyperactivity disorder and autism spectrum disorder-the importance of depression. J Child Psychol Psychiatry 2023; 64:4–15
3.
Biederman J, Ball SW, Monuteaux MC, et al: New insights into the comorbidity between ADHD and major depression in adolescent and young adult females. J Am Acad Child Adolesc Psychiatry 2008; 47:426–434
4.
Biederman J, Faraone S, Milberger S, et al: A prospective 4-year follow-up study of attention-deficit hyperactivity and related disorders. Arch Gen Psychiatry 1996; 53:437–446
5.
Chronis-Tuscano A, Molina BSG, Pelham WE, et al: Very early predictors of adolescent depression and suicide attempts in children with attention-deficit/hyperactivity disorder. Arch Gen Psychiatry 2010; 67:1044–1051
6.
Meinzer MC, Lewinsohn PM, Pettit JW, et al: Attention-deficit/hyperactivity disorder in adolescence predicts onset of major depressive disorder through early adulthood. Depress Anxiety 2013; 30:546–553
7.
Jaffee SR, Moffitt TE, Caspi A, et al: Differences in early childhood risk factors for juvenile-onset and adult-onset depression. Arch Gen Psychiatry 2002; 59:215–222
8.
Rice F, Riglin L, Thapar AK, et al: Characterizing developmental trajectories and the role of neuropsychiatric genetic risk variants in early-onset depression. JAMA Psychiatry 2019; 76:306–313
9.
Hammen C, Brennan PA, Keenan-Miller D, et al: Early onset recurrent subtype of adolescent depression: clinical and psychosocial correlates. J Child Psychol Psychiatry 2008; 49:433–440
10.
Purper-Ouakil D, Porfirio MC, Le Strat Y, et al: What do childhood attention deficit/hyperactivity symptoms in depressed adults tell us about the bipolar spectrum? Psychiatry Res 2017; 249:244–251
11.
Powell V, Agha SS, Jones RB, et al: ADHD in adults with recurrent depression. J Affect Disord 2021; 295:1153–1160
12.
Riglin L, Leppert B, Dardani C, et al: ADHD and depression: investigating a causal explanation. Psychol Med 2021; 51:1890–1897
13.
Powell V, Riglin L, Hammerton G, et al: What explains the link between childhood ADHD and adolescent depression? Investigating the role of peer relationships and academic attainment. Eur Child Adolesc Psychiatry 2020; 29:1581–1591
14.
Mori H, Hirota T, Monden R, et al: School social capital mediates associations between ASD traits and depression among adolescents in general population. J Autism Dev Disord. (Online ahead of print, August 2, 2021)
15.
Rai D, Culpin I, Heuvelman H, et al: Association of autistic traits with depression from childhood to age 18 years. JAMA Psychiatry 2018; 75:835–843
16.
Epskamp S, Waldorp LJ, Mõttus R, et al: The Gaussian graphical model in cross-sectional and time-series data. Multivariate Behav Res 2018; 53:453–480
17.
Epskamp S, Fried EI: A tutorial on regularized partial correlation networks. Psychol Methods 2018; 23:617–634
18.
Demontis D, Walters GB, Athanasiadis G, et al: Genome-wide analyses of ADHD identify 27 risk loci, refine the genetic architecture and implicate several cognitive domains. Nat Genet 2023; 55:198–208
19.
Addicoat A, Thapar AK, Riglin L, et al: Adult mood problems in children with neurodevelopmental problems: evidence from a prospective birth cohort followed to age 50. Soc Psychiatry Psychiatr Epidemiol 2020; 55:351–358
20.
Eyre O, Hughes RA, Thapar AK, et al: Childhood neurodevelopmental difficulties and risk of adolescent depression: the role of irritability. J Child Psychol Psychiatry 2019; 60:866–874
21.
Magnuson KM, Constantino JN: Characterization of depression in children with autism spectrum disorders. J Dev Behav Pediatr 2011; 32:332–340
22.
Herman KC, Lambert SF, Ialongo NS, et al: Academic pathways between attention problems and depressive symptoms among urban African American children. J Abnorm Child Psychol 2007; 35:265–274
23.
Humphreys KL, Katz SJ, Lee SS, et al: The association of ADHD and depression: mediation by peer problems and parent-child difficulties in two complementary samples. J Abnorm Psychol 2013; 122:854–867
24.
Holtmann M, Becker A, Banaschewski T, et al: Psychometric validity of the Strengths and Difficulties Questionnaire-dysregulation profile. Psychopathology 2011; 44:53–59
25.
Abend R, Bajaj MA, Coppersmith DDL, et al: A computational network perspective on pediatric anxiety symptoms. Psychol Med 2021; 51:1752–1762
26.
Fried EI, Cramer AOJ: Moving forward: challenges and directions for psychopathological network theory and methodology. Perspect Psychol Sci 2017; 12:999–1020
27.
van Buuren S, Groothuis-Oudshoorn K: mice: multivariate imputation by chained equations in R. J Stat Softw 2011; 45:1–67
28.
Jiang H, Fei X, Liu H, et al: Huge: High-Dimensional Undirected Graph Estimation. R package version 1.3.5., 2021. http://cran-r.c3sl.ufpr.br/web/packages/huge/huge.pdf
29.
Williams DR: Bayesian estimation for Gaussian graphical models: structure learning, predictability, and network comparisons. Multivariate Behav Res 2021; 56:336–352
30.
Williams DR: BGGM: Bayesian Gaussian graphical models in R. J Open Source Softw 2020; 5:2111
31.
Williams DR, Mulder J: Bayesian hypothesis testing for Gaussian graphical models: conditional independence and order constraints. J Math Psychol 2020; 99;102441
32.
Isvoranu AM, Epskamp S: Which estimation method to choose in network psychometrics? Deriving guidelines for applied researchers. Psychol Methods. (Online ahead of print, November 29, 2021)
33.
Heck DW, Boehm U, Böing-Messing F, et al: A review of applications of the Bayes factor in psychological research. Psychol Methods 2023; 28:558–579
34.
Epskamp S, Cramer AOJ, Waldorp LJ, et al: qgraph: network visualizations of relationships in psychometric data. J Stat Softw 2012; 48:1–18
35.
Kendler KS, Ohlsson H, Sundquist J, et al: Facilitating versus inhibiting the transmission of drug abuse from high-risk parents to their children: a Swedish national study. Twin Res Hum Genet. 23, 2020:1–7
36.
Preacher KJ, Kelley K: Effect size measures for mediation models: quantitative strategies for communicating indirect effects. Psychol Methods 2011; 16:93–115
37.
Cuthbert BN: The RDoC framework: facilitating transition from ICD/DSM to dimensional approaches that integrate neuroscience and psychopathology. World Psychiatry 2014; 13:28–35
38.
Hoare E, Callaly E, Berk M: Can depression be prevented? If so, how? JAMA Psychiatry 2020; 77:1095–1096
39.
Meinzer MC, Hartley CM, Hoogesteyn K, et al: Development and open trial of a depression preventive intervention for adolescents with attention-deficit/hyperactivity disorder. Cogn Behav Pract 2018; 25:225–239
40.
Pine DS, Fox NA: Childhood antecedents and risk for adult mental disorders. Annu Rev Psychol 2015; 66:459–485
41.
Williams DR, Briganti G, Linkowski P, et al: On accepting the null hypothesis of conditional independence in partial correlation networks: a Bayesian analysis. PsyArXiv 2021, DOI: psyarxiv.com/7uhx8
42.
Williams DR: Learning to live with sampling variability: expected replicability in partial correlation networks. Psychol Methods 2022; 27:606–621
43.
Borsboom D, Deserno MK, Rhemtulla M, et al: Network analysis of multivariate data in psychological science. Nat Rev Methods Primers 2021; 1:58
44.
Bringmann LF, Albers C, Bockting C, et al: Psychopathological networks: theory, methods and practice. Behav Res Ther 2022; 149:104011
45.
Althoff RR, Rettew DC, Faraone SV, et al: Latent class analysis shows strong heritability of the Child Behavior Checklist–juvenile bipolar phenotype. Biol Psychiatry 2006; 60:903–911
46.
Taylor MJ, Charman T, Ronald A: Where are the strongest associations between autistic traits and traits of ADHD? Evidence from a community-based twin study. Eur Child Adolesc Psychiatry 2015; 24:1129–1138
47.
de Ron J, Fried EI, Epskamp S: Psychological networks in clinical populations: investigating the consequences of Berkson’s bias. Psychol Med 2021; 51:168–176
48.
Taylor AE, Jones HJ, Sallis H, et al: Exploring the association of genetic factors with participation in the Avon Longitudinal Study of Parents and Children. Int J Epidemiol 2018; 47:1207–1216
49.
Rimfeld K, Malanchini M, Spargo T, et al: Twins Early Development Study: a genetically sensitive investigation into behavioral and cognitive development from infancy to emerging adulthood. Twin Res Hum Genet 2019; 22:508–513
50.
Boyd A, Golding J, Macleod J, et al: The “Children of the 90s”—the index offspring of the Avon Longitudinal Study of Parents and Children. Int J Epidemiol 2013; 42:111–127

Information & Authors

Information

Published In

Go to American Journal of Psychiatry
American Journal of Psychiatry
Pages: 755 - 765
PubMed: 37583326

History

Received: 17 October 2022
Revision received: 24 January 2023
Revision received: 21 March 2023
Revision received: 10 May 2023
Revision received: 26 May 2023
Accepted: 31 May 2023
Published online: 16 August 2023
Published in print: October 1, 2023

Keywords

  1. Autism Spectrum Disorder (ASD)
  2. Attention Deficit Hyperactivity Disorder (ADHD)
  3. Child/Adolescent Psychiatry
  4. Depressive Disorders
  5. Network Analysis
  6. Neurodevelopmental Traits

Authors

Details

Luis C. Farhat, M.D.
Department of Psychiatry, Faculdade de Medicina FMUSP (Farhat, Shephard, Polanczyk), and Department of Computer Science, Instituto de Matemática e Estatística (Fujita), Universidade de São Paulo, São Paulo, Brazil; MRC Integrative Epidemiology Unit and Department of Population Health Sciences, Bristol Medical School, University of Bristol, Bristol, U.K. (Blakey, Davey Smith, Stergiakouli); Department of Child and Adolescent Psychiatry (Shephard) and Social, Genetic, and Developmental Psychiatry Centre (Eley), Institute of Psychiatry, Psychology, and Neuroscience, King’s College London; Wolfson Centre for Young People’s Mental Health and Child and Adolescent Psychiatry Section, Division of Psychological Medicine, Cardiff University School of Medicine, Cardiff, U.K. (Thapar).
Rachel Blakey, Ph.D.
Department of Psychiatry, Faculdade de Medicina FMUSP (Farhat, Shephard, Polanczyk), and Department of Computer Science, Instituto de Matemática e Estatística (Fujita), Universidade de São Paulo, São Paulo, Brazil; MRC Integrative Epidemiology Unit and Department of Population Health Sciences, Bristol Medical School, University of Bristol, Bristol, U.K. (Blakey, Davey Smith, Stergiakouli); Department of Child and Adolescent Psychiatry (Shephard) and Social, Genetic, and Developmental Psychiatry Centre (Eley), Institute of Psychiatry, Psychology, and Neuroscience, King’s College London; Wolfson Centre for Young People’s Mental Health and Child and Adolescent Psychiatry Section, Division of Psychological Medicine, Cardiff University School of Medicine, Cardiff, U.K. (Thapar).
George Davey Smith, F.R.S.
Department of Psychiatry, Faculdade de Medicina FMUSP (Farhat, Shephard, Polanczyk), and Department of Computer Science, Instituto de Matemática e Estatística (Fujita), Universidade de São Paulo, São Paulo, Brazil; MRC Integrative Epidemiology Unit and Department of Population Health Sciences, Bristol Medical School, University of Bristol, Bristol, U.K. (Blakey, Davey Smith, Stergiakouli); Department of Child and Adolescent Psychiatry (Shephard) and Social, Genetic, and Developmental Psychiatry Centre (Eley), Institute of Psychiatry, Psychology, and Neuroscience, King’s College London; Wolfson Centre for Young People’s Mental Health and Child and Adolescent Psychiatry Section, Division of Psychological Medicine, Cardiff University School of Medicine, Cardiff, U.K. (Thapar).
André Fujita, Ph.D.
Department of Psychiatry, Faculdade de Medicina FMUSP (Farhat, Shephard, Polanczyk), and Department of Computer Science, Instituto de Matemática e Estatística (Fujita), Universidade de São Paulo, São Paulo, Brazil; MRC Integrative Epidemiology Unit and Department of Population Health Sciences, Bristol Medical School, University of Bristol, Bristol, U.K. (Blakey, Davey Smith, Stergiakouli); Department of Child and Adolescent Psychiatry (Shephard) and Social, Genetic, and Developmental Psychiatry Centre (Eley), Institute of Psychiatry, Psychology, and Neuroscience, King’s College London; Wolfson Centre for Young People’s Mental Health and Child and Adolescent Psychiatry Section, Division of Psychological Medicine, Cardiff University School of Medicine, Cardiff, U.K. (Thapar).
Elizabeth Shephard, Ph.D.
Department of Psychiatry, Faculdade de Medicina FMUSP (Farhat, Shephard, Polanczyk), and Department of Computer Science, Instituto de Matemática e Estatística (Fujita), Universidade de São Paulo, São Paulo, Brazil; MRC Integrative Epidemiology Unit and Department of Population Health Sciences, Bristol Medical School, University of Bristol, Bristol, U.K. (Blakey, Davey Smith, Stergiakouli); Department of Child and Adolescent Psychiatry (Shephard) and Social, Genetic, and Developmental Psychiatry Centre (Eley), Institute of Psychiatry, Psychology, and Neuroscience, King’s College London; Wolfson Centre for Young People’s Mental Health and Child and Adolescent Psychiatry Section, Division of Psychological Medicine, Cardiff University School of Medicine, Cardiff, U.K. (Thapar).
Evie Stergiakouli, Ph.D.
Department of Psychiatry, Faculdade de Medicina FMUSP (Farhat, Shephard, Polanczyk), and Department of Computer Science, Instituto de Matemática e Estatística (Fujita), Universidade de São Paulo, São Paulo, Brazil; MRC Integrative Epidemiology Unit and Department of Population Health Sciences, Bristol Medical School, University of Bristol, Bristol, U.K. (Blakey, Davey Smith, Stergiakouli); Department of Child and Adolescent Psychiatry (Shephard) and Social, Genetic, and Developmental Psychiatry Centre (Eley), Institute of Psychiatry, Psychology, and Neuroscience, King’s College London; Wolfson Centre for Young People’s Mental Health and Child and Adolescent Psychiatry Section, Division of Psychological Medicine, Cardiff University School of Medicine, Cardiff, U.K. (Thapar).
Thalia C. Eley, Ph.D.
Department of Psychiatry, Faculdade de Medicina FMUSP (Farhat, Shephard, Polanczyk), and Department of Computer Science, Instituto de Matemática e Estatística (Fujita), Universidade de São Paulo, São Paulo, Brazil; MRC Integrative Epidemiology Unit and Department of Population Health Sciences, Bristol Medical School, University of Bristol, Bristol, U.K. (Blakey, Davey Smith, Stergiakouli); Department of Child and Adolescent Psychiatry (Shephard) and Social, Genetic, and Developmental Psychiatry Centre (Eley), Institute of Psychiatry, Psychology, and Neuroscience, King’s College London; Wolfson Centre for Young People’s Mental Health and Child and Adolescent Psychiatry Section, Division of Psychological Medicine, Cardiff University School of Medicine, Cardiff, U.K. (Thapar).
Anita Thapar, M.D., Ph.D.
Department of Psychiatry, Faculdade de Medicina FMUSP (Farhat, Shephard, Polanczyk), and Department of Computer Science, Instituto de Matemática e Estatística (Fujita), Universidade de São Paulo, São Paulo, Brazil; MRC Integrative Epidemiology Unit and Department of Population Health Sciences, Bristol Medical School, University of Bristol, Bristol, U.K. (Blakey, Davey Smith, Stergiakouli); Department of Child and Adolescent Psychiatry (Shephard) and Social, Genetic, and Developmental Psychiatry Centre (Eley), Institute of Psychiatry, Psychology, and Neuroscience, King’s College London; Wolfson Centre for Young People’s Mental Health and Child and Adolescent Psychiatry Section, Division of Psychological Medicine, Cardiff University School of Medicine, Cardiff, U.K. (Thapar).
Guilherme V. Polanczyk, M.D., Ph.D. [email protected]
Department of Psychiatry, Faculdade de Medicina FMUSP (Farhat, Shephard, Polanczyk), and Department of Computer Science, Instituto de Matemática e Estatística (Fujita), Universidade de São Paulo, São Paulo, Brazil; MRC Integrative Epidemiology Unit and Department of Population Health Sciences, Bristol Medical School, University of Bristol, Bristol, U.K. (Blakey, Davey Smith, Stergiakouli); Department of Child and Adolescent Psychiatry (Shephard) and Social, Genetic, and Developmental Psychiatry Centre (Eley), Institute of Psychiatry, Psychology, and Neuroscience, King’s College London; Wolfson Centre for Young People’s Mental Health and Child and Adolescent Psychiatry Section, Division of Psychological Medicine, Cardiff University School of Medicine, Cardiff, U.K. (Thapar).

Notes

Send correspondence to Prof. Polanczyk ([email protected]).

Author Contributions

Drs. Farhat and Blakey contributed equally to this work.

Funding Information

Dr. Farhat was supported by São Paulo Research Foundation grant 2021/08540-0, which was supported by São Paulo Research Foundation grant 2016/22455-8 awarded to Prof. Polanczyk. Dr. Blakey was supported by Wellcome Trust grant 204895/Z/16/Z, which was awarded to Dr. Stergiakouli and Profs. Thapar and Davey Smith. Dr. Blakey, Dr. Stergiakouli, and Prof. Davey Smith work in a unit that receives funding from the University of Bristol and the U.K. Medical Research Council (grant MC_UU_00011/1). Dr. Shephard was supported by a Young Investigator award from the São Paulo Research Foundation (grant 2020/05964-1).Prof. Davey Smith is a scientific advisory board member for Insitro and Relation Therapeutics. Prof. Polanczyk has served as a consultant, an advisory board member, and/or a speaker for Abbott, Aché, Apsen, Medice, Novo Nordisk, and Takeda and has received royalties from Editora Manole. The other authors report no financial relationships with commercial interests.

Metrics & Citations

Metrics

Citations

Export Citations

If you have the appropriate software installed, you can download article citation data to the citation manager of your choice. Simply select your manager software from the list below and click Download.

For more information or tips please see 'Downloading to a citation manager' in the Help menu.

Format
Citation style
Style
Copy to clipboard

View Options

View options

PDF/EPUB

View PDF/EPUB

Login options

Already a subscriber? Access your subscription through your login credentials or your institution for full access to this article.

Personal login Institutional Login Open Athens login
Purchase Options

Purchase this article to access the full text.

PPV Articles - American Journal of Psychiatry

PPV Articles - American Journal of Psychiatry

Not a subscriber?

Subscribe Now / Learn More

PsychiatryOnline subscription options offer access to the DSM-5-TR® library, books, journals, CME, and patient resources. This all-in-one virtual library provides psychiatrists and mental health professionals with key resources for diagnosis, treatment, research, and professional development.

Need more help? PsychiatryOnline Customer Service may be reached by emailing [email protected] or by calling 800-368-5777 (in the U.S.) or 703-907-7322 (outside the U.S.).

Media

Figures

Other

Tables

Share

Share

Share article link

Share