Adjunctive Atypical Antipsychotic Treatment for Major Depressive Disorder: A Meta-Analysis of Depression, Quality of Life, and Safety Outcomes
Abstract
Background:
Methods and Findings:
Conclusions:
Introduction
Methods
Ethical Review.
Search Strategy.
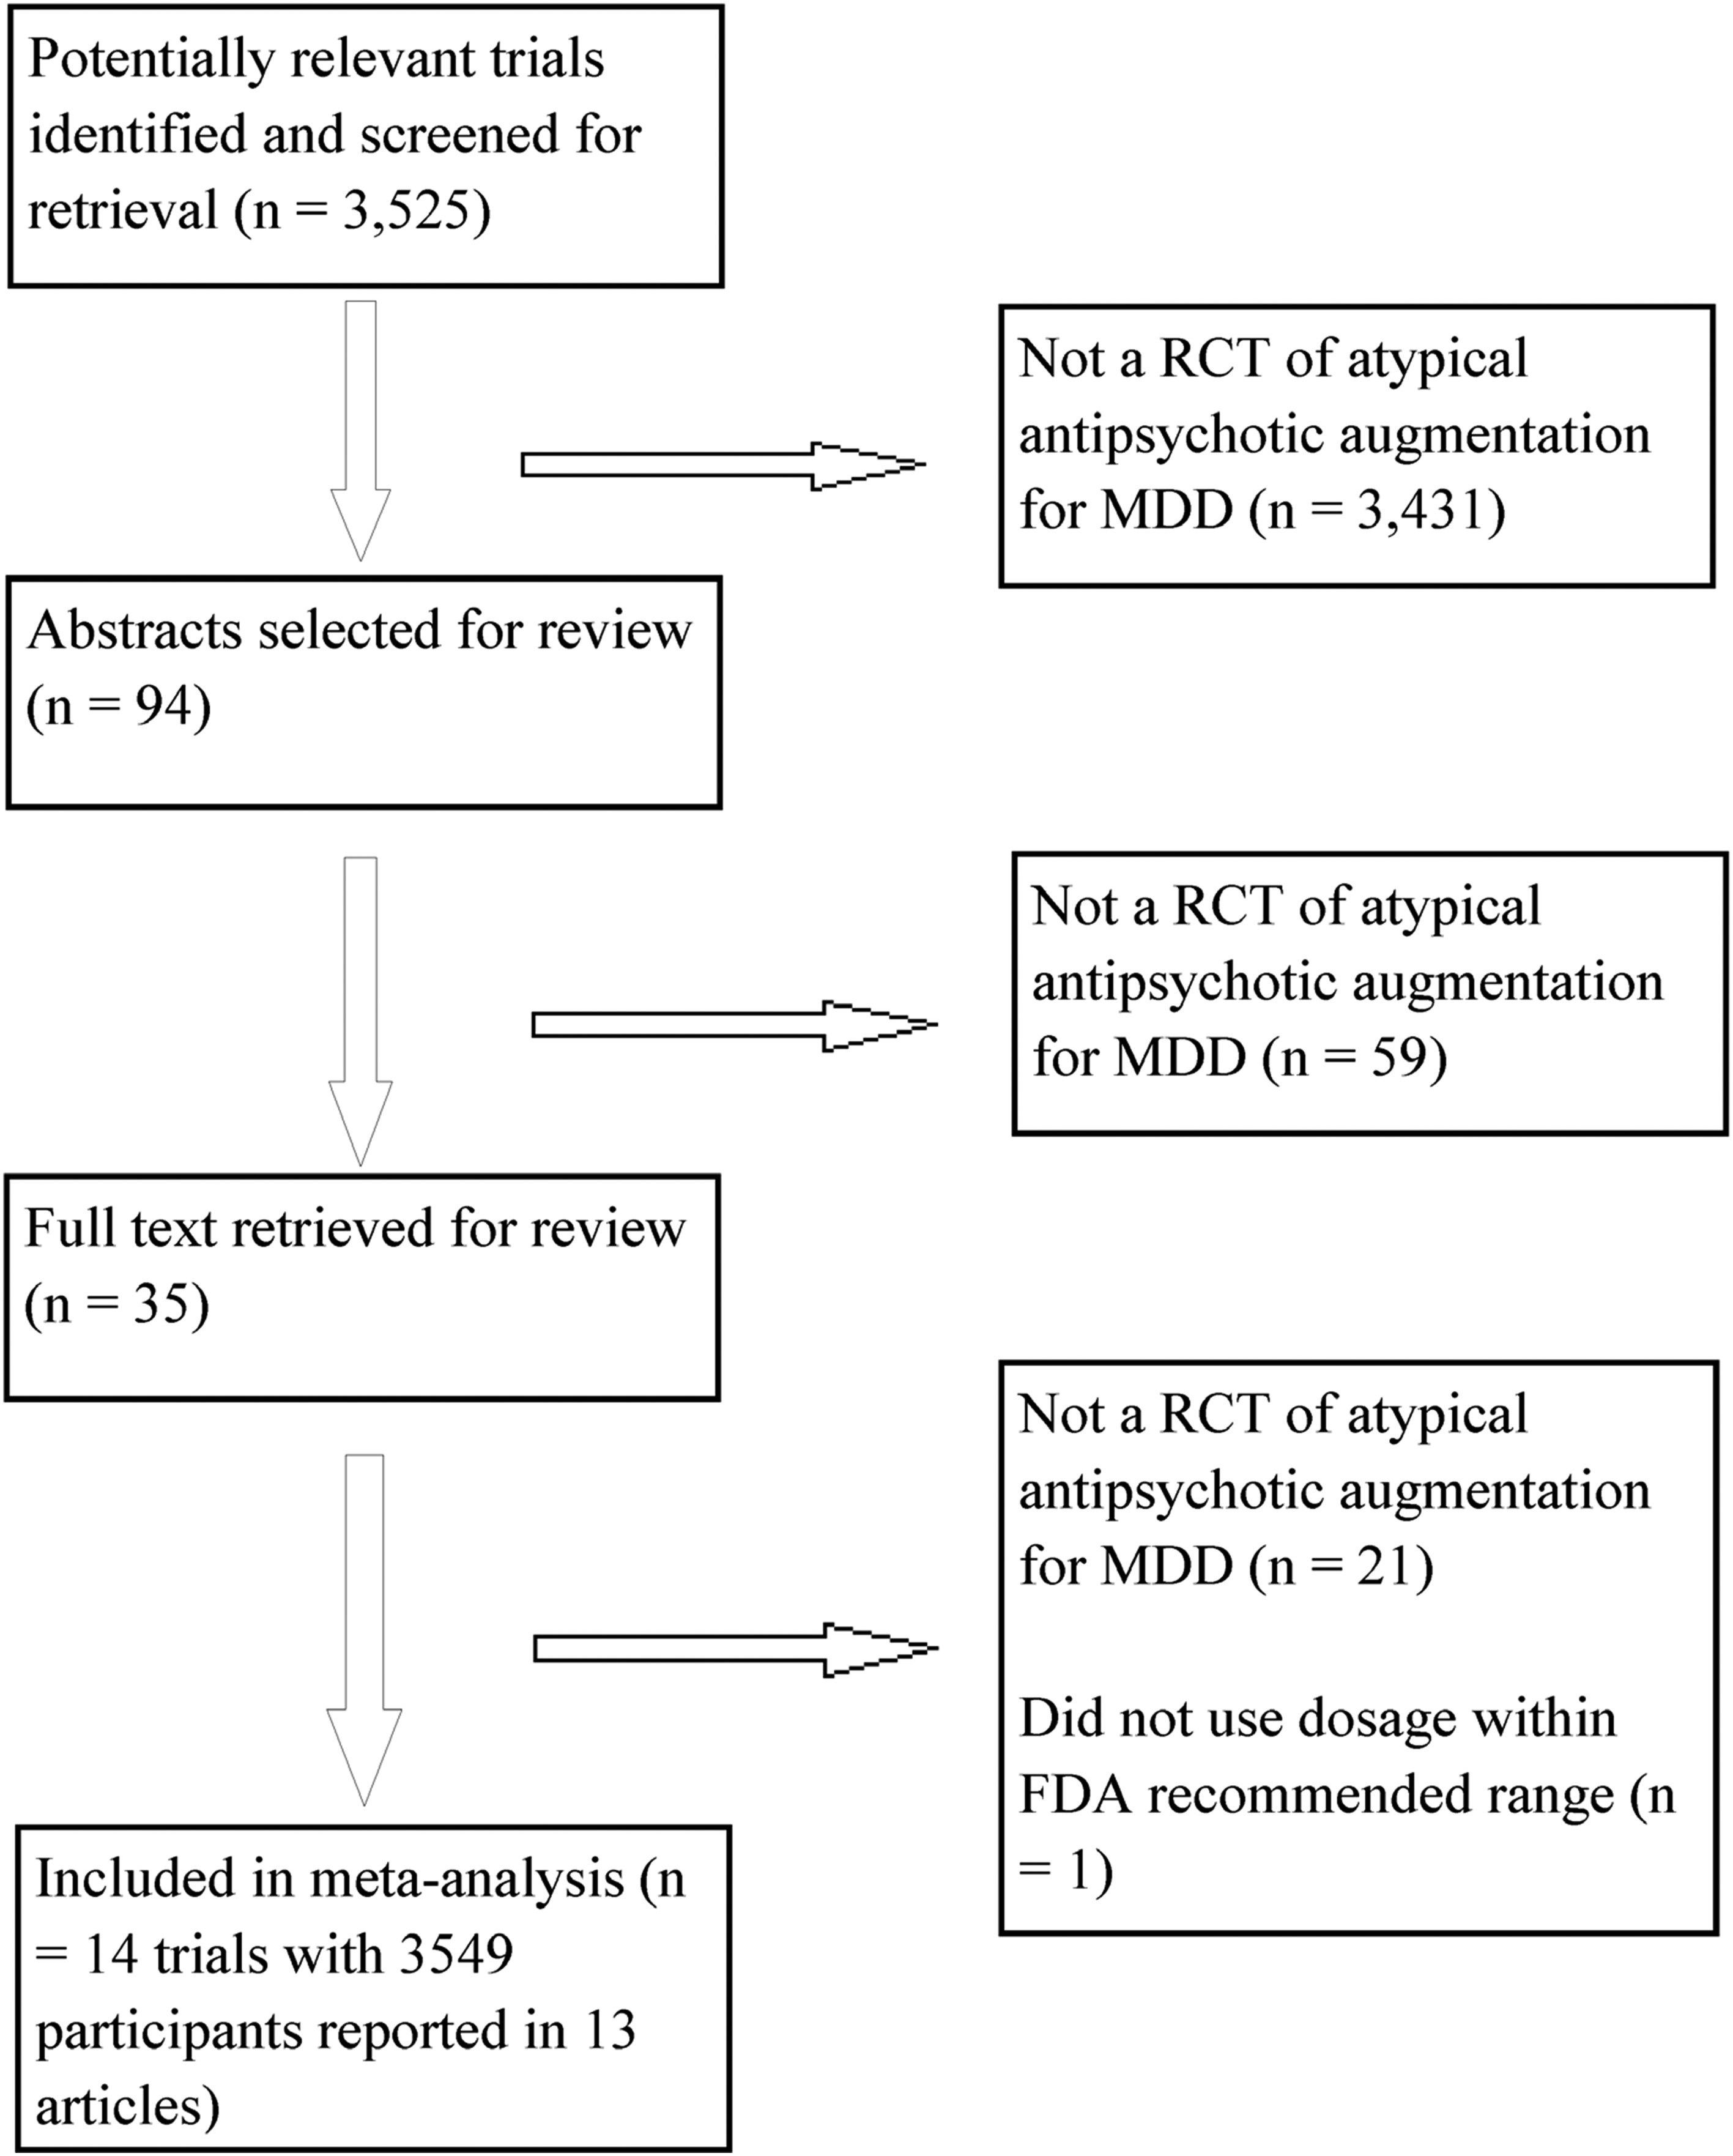
Study Selection.
Data Extraction.
Outcome Measures.
Statistical Analysis.
Results
Study Characteristics.
| Study First Author (Year) [Reference] | Antipsychotic | Antide-pressant | Daily Dosage at End Point | Na | Mean Age (Years) | Percent Female | Duration (Weeks) | Prior Failed Trials | Interview to Establish Diagnosisb | Categorical Depression Measuresc | Supplemental Data Sourcesd | Adverse Events Assessed Systematically | Adverse Events Reporting Threshold | Adequate Sequence Generation? | Established Placebo Resistance? | Prior Drug Nonresponders Excluded? | Placebo Similarity? | Blinded Raters? |
|---|---|---|---|---|---|---|---|---|---|---|---|---|---|---|---|---|---|---|
| Bauer (2009) [81] | Quetiapine | Various | Fixed, 150 or 300 mg | 487 | 45.4 | 67.6 | 6 | 1 historical | MINI | Remission: MADRS ≤8; response: MADRS | CTR, FDA | Akathisia, EPS, sexual functioning | >5% in any group | ? | No | Yes | ? | ? |
| Berman (2007) [75] | Aripiprazole | Various | Flexible, M = 11.8 mg | 353 | 45.4 | 62.8 | 6 | 1–3 historical, 1 prospective | ? | Remission: MADRS ≤10; response: MADRS | CTR, FDA | Akathisia, EPS, sexual functioning | ≥5% in any group | Yes | Yes | Yes | ? | ? |
| Berman (2009) [82] | Aripiprazole | Various | Flexible, M = 10.7 mg | 343 | 45.3 | 73.1 | 6 | 1–3 historical, 1 prospective | ? | Remission: MADRS ≤8; response: MADRS | CTR | Akathisia, EPS, sexual functioning | ≥5% in any group | ? | Yes | Yes | ? | ? |
| Corya (2006) [25] | OFC | Fluoxetine or venlafaxine | Fixed; olanzapine 6 mg/fluoxetine 25 mg, olanzapine 6 mg/fluoxetine 50 mg, olanzapine 12 mg/fluoxetine 25 mg, or olanzapine 12 mg/fluoxetine 50 mg | 344 | 45.7 | 72.5 | 12 | 1 historical, 1 prospective | ? | Remission: MADRS ≤8 at two consecutive visits excluding patients who relapsed; response: MADRS | CTR | Akathisia, EPS | ≥10% in OFC group | ? | No | No | ? | ? |
| El-Khalili (2010) [83] | Quetiapine | Various | Fixed, 150 or 300 mg | 432 | 45.5 | 72.5 | 6 | 1 historical | MINI | Remission: MADRS ≤8; response: MADRS | CTR, FDA | Akathisia, EPS, sexual functioning | >5% in any group | Yes | No | No | Yes | ? |
| Keitner (2009) [73] | Risperidone | Various | Flexible, M = 1.6 mg | 95 | 45.2 | 56.7 | 4 | 1 prospective | SCID | Remission: HAM-D ≤7; response: MADRS | None | None | ? | ? | No | No | ? | Mostlye |
| Mahmoud (2007) [44] | Risperidone | Various | Flexible, M = ?, 1 or 2 mg permitted | 268 | 46.1 | 73.5 | 6 | 1 prospective | ? | Remission: HAM-D ≤7; response: HAM-D | None | None | ≥2% in any group | Yes | No | No | ? | ? |
| Marcus (2008) [76] | Aripiprazole | Various | Flexible, M = 11.0 mg | 369 | 44.5 | 66.7 | 6 | 1–3 historical, 1 prospective | ? | Remission: MADRS ≤10; response: MADRS | CTR, FDA | Akathisia, EPS, sexual functioning | ≥5% in any group | ? | Yes | Yes | ? | ? |
| McIntyre (2007) [84] | Quetiapine | Various | Flexible, M = 182 mg | 58 | 44.5 | 62.0 | 8 | 1 trial | ? | Remission: HAM-D ≤7; response: HAM-D | None | None | ?f | ? | No | No | ? | ? |
| Reeves (2008) [77] | Risperidone | Various | Flexible, M = 1.17 mg | 23 | 44.0 | 69.6 | 8 | 1 prospective | ? | Remission: N/A; response: N/A | None | Akathisia (one item from EPS scale), EPS | ≥13% of total participants | ? | No | No | ? | ? |
| Shelton (2001) [27] | OFC | Fluoxetine | Flexible, mean modal dose = olanzapine 13.5 mg/fluoxetine 52 mg | 20 | 42.0 | 75 | 8 | 2 historical and 1 prospective | ? | Remission: MADRS ≤8 at two consecutive visits excluding patients who relapsed; response: MADRS | CTR | Akathisia, EPS | Number of adverse events not reported | ? | No | No | ? | ? |
| Shelton (2005) [26] | OFC | Fluoxetine or nortriptyline | Flexible, mean modal dose = olanzapine 8.5 mg/fluoxetine 35.6mg | 356 | 42.0 | 69.4 | 8 | 1 historical, 1 prospective | SCID | Remission: MADRS ≤8 at two consecutive visits excluding patients who relapsed; response: MADRS | CTR | Akathisia, EPS | ≥10% of OFC group | ? | No | No | ? | ? |
| Thase 1 (2007) [85]g | OFC | Fluoxetine | Fixed; olanzapine 6 mg/fluoxetine 50 mg, olanzapine 12 mg/fluoxetine 50 mg, or olanzapine 18 mg/fluoxetine 50 mg | 203 | 44.1 | 60.2 | 8 | 1 historical, 1 prospective | SCID | Remission: MADRS ≤10; response: MADRS | CTR | Akathisia, EPS | ≥10% of OFC group | ? | No | No | ? | ? |
| Thase 2 (2007) [85]g | OFC | Fluoxetine | Fixed; olanzapine 6 mg/fluoxetine 50 mg, olanzapine 12 mg/fluoxetine 50 mg, or olanzapine 18 mg/fluoxetine 50 mg | 198 | 44.9 | 68.0 | 8 | 1 historical, 1 prospective | SCID | Remission: MADRS ≤10; response: MADRS | CTR | Akathisia, EPS | ≥10% of OFC group | ? | No | No | ? | ? |
Efficacy.
| Comparison | Outcome | k | OR (95% CI)a | Q | I2 (95% CI) | p(Q) | NNT/NNH (95% CI) |
|---|---|---|---|---|---|---|---|
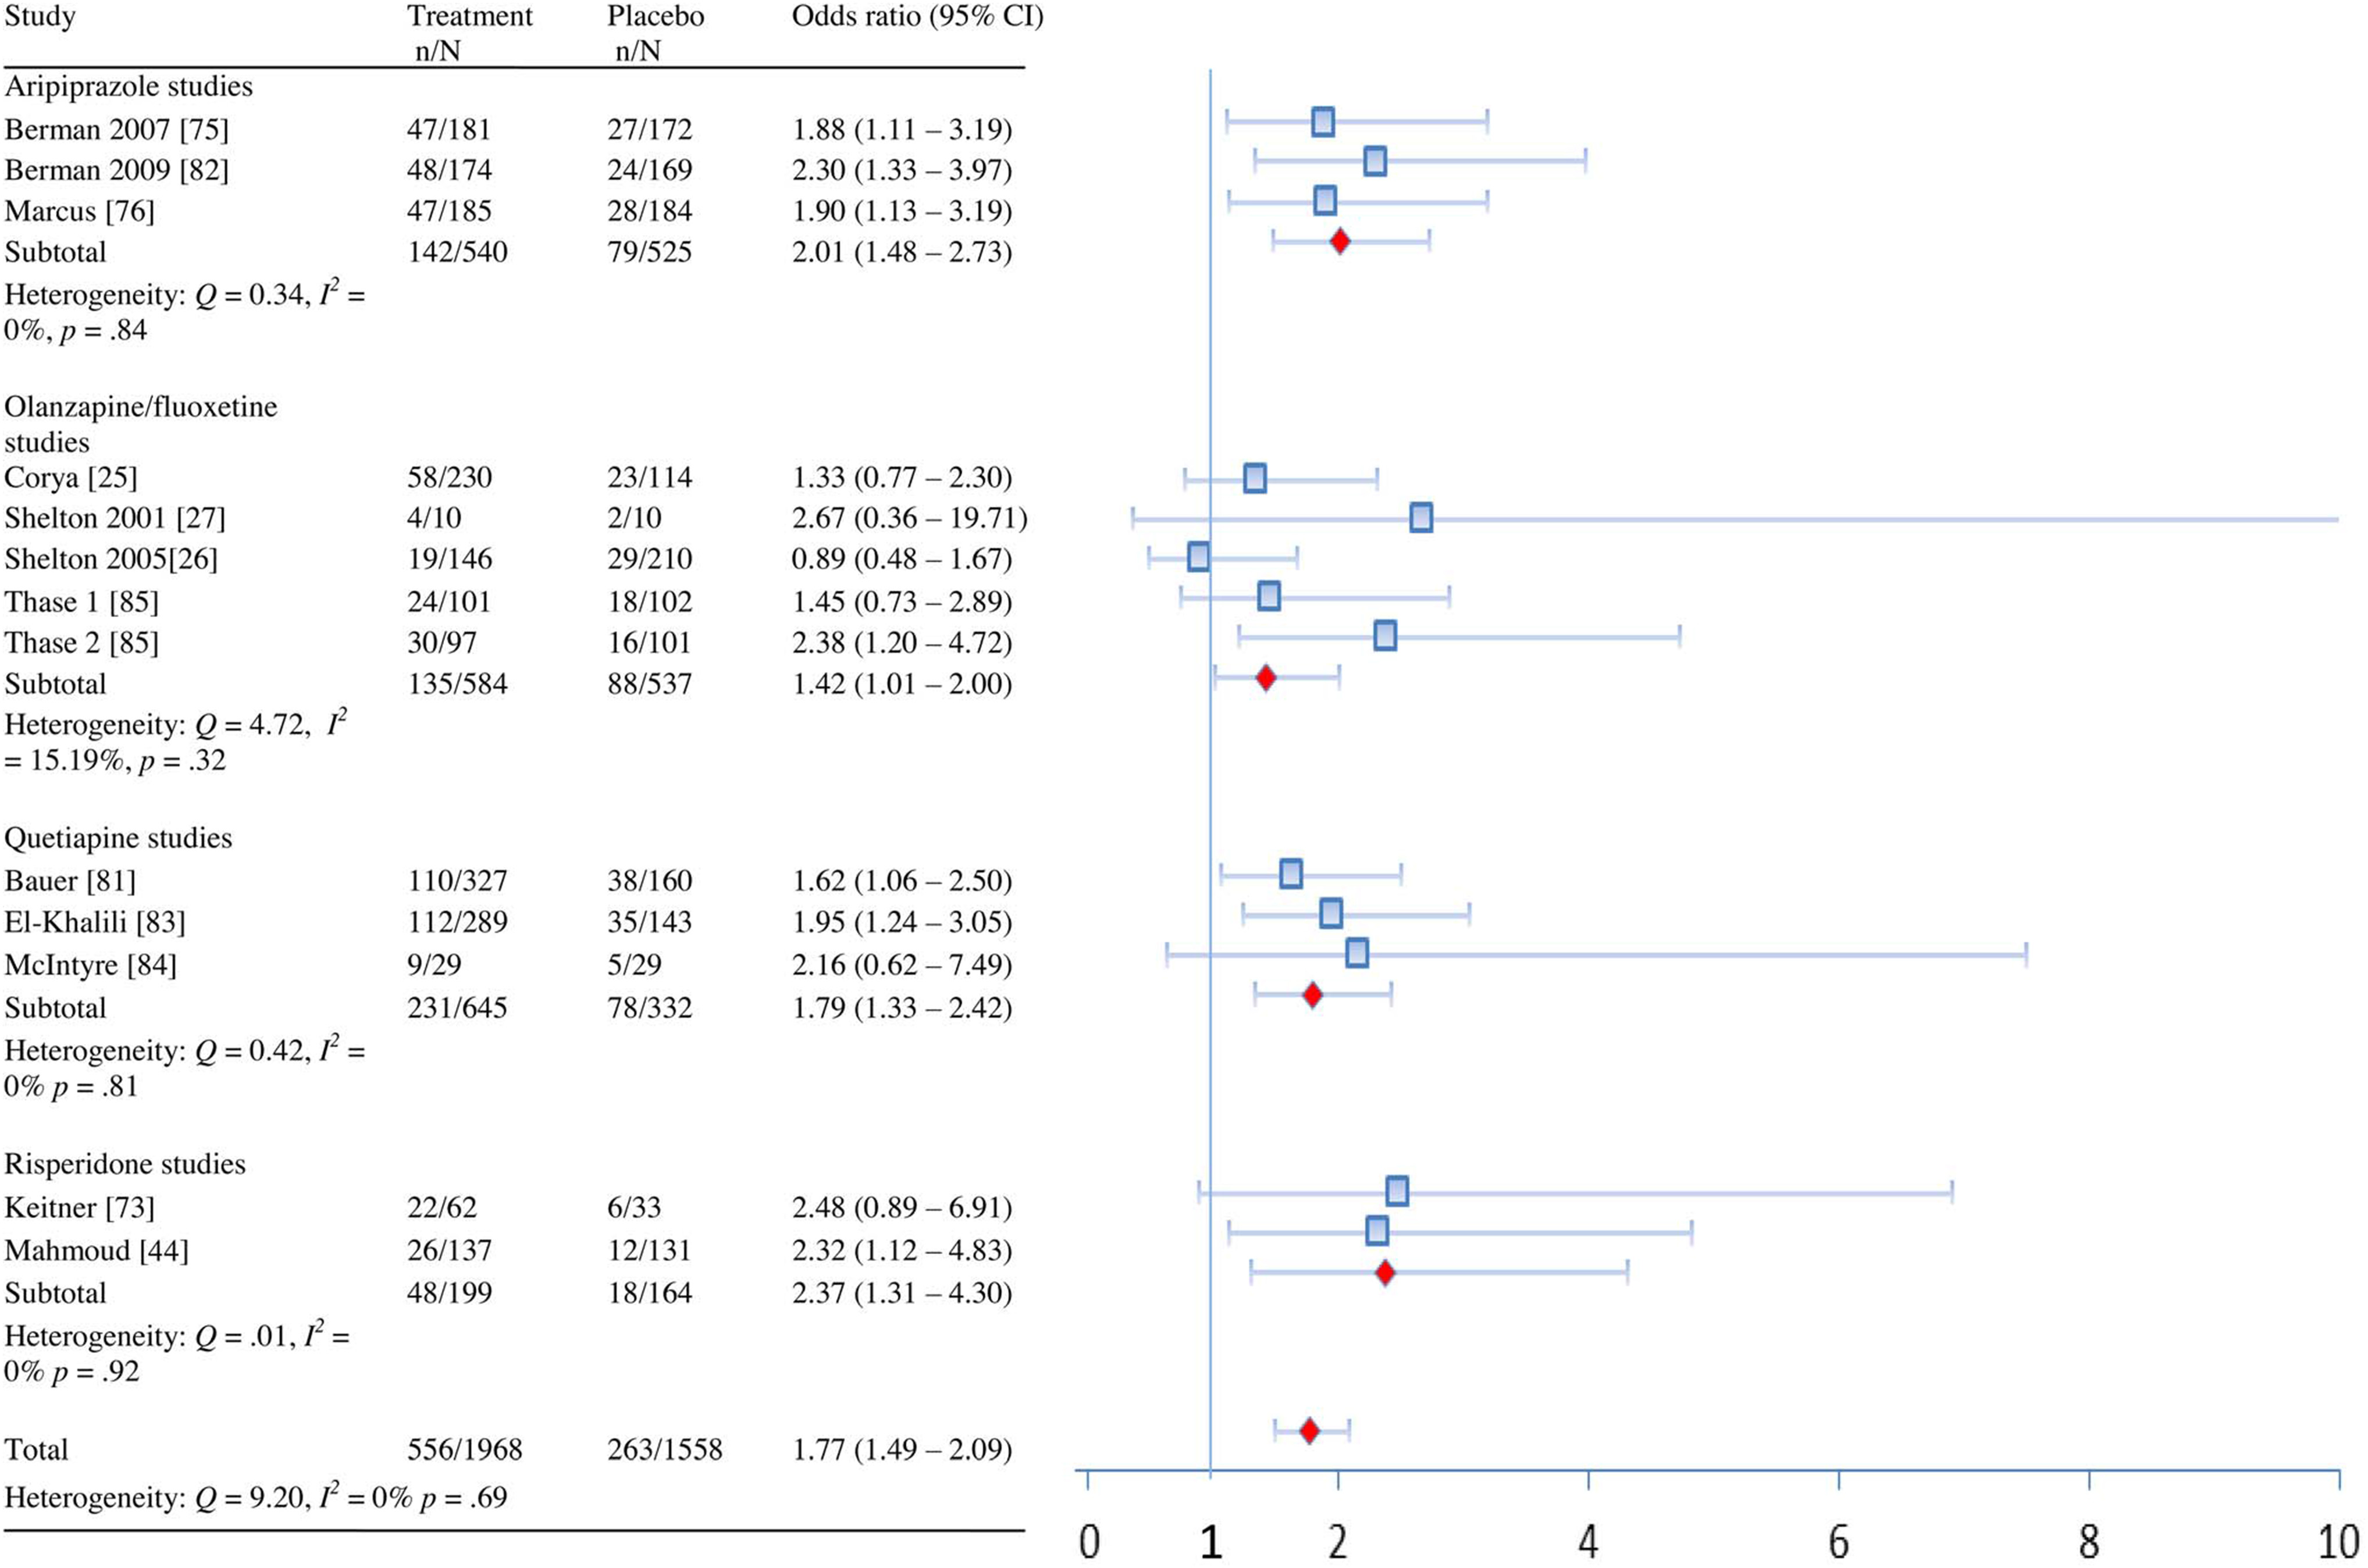
| All combined | Remission | 13 | 1.77 (1.49–2.09) | 9.20 | 0% (0%–43.38%) | 0.69 | 10 (8–15) |
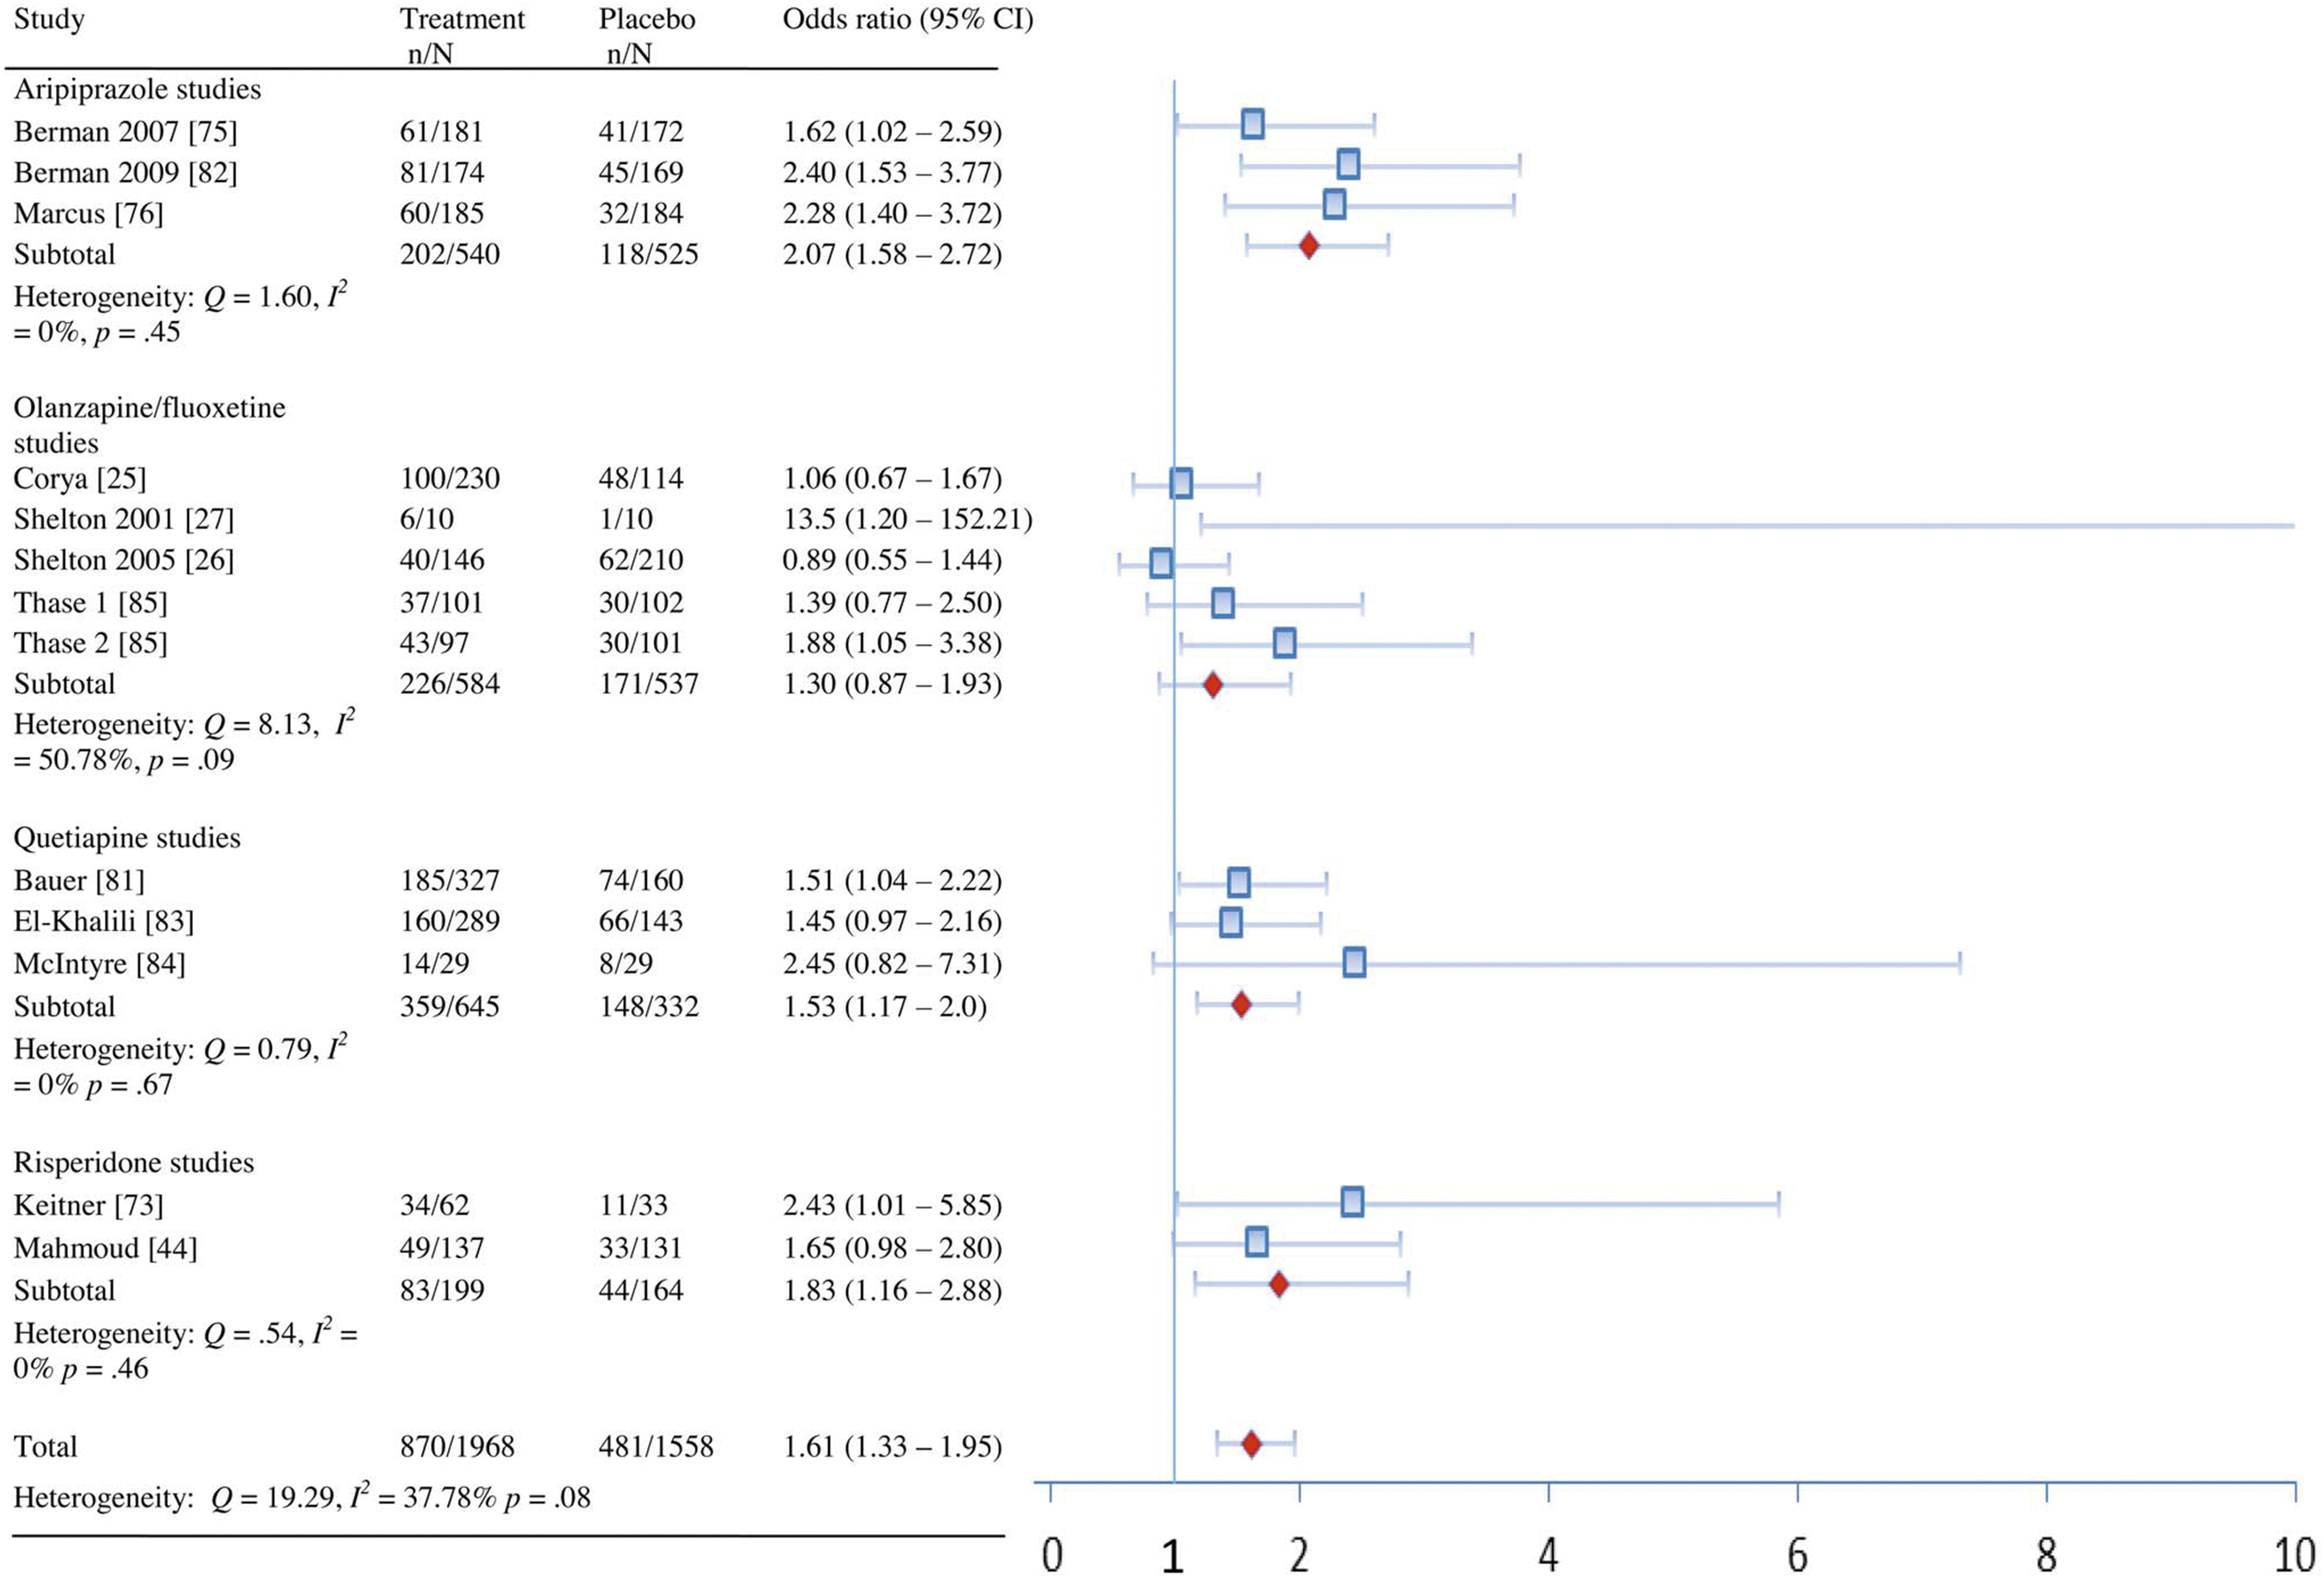
| Response | 13 | 1.61 (1.33–1.95) | 19.29 | 37.78% (0%–67.76%) | 0.08 | 9 (7–16) | |
| Aripiprazole | Remission | 3 | 2.01 (1.48–2.73) | 0.34 | 0% (0%–38.81%) | 0.84 | 9 (6–18) |
| Response | 3 | 2.07 (1.58–2.72) | 1.60 | 0% (0%–87.0%) | 0.45 | 7 (5–12) | |
| Akathisia | 3 | 7.47 (5.07–11.0) | 1.63 | 0% (0%–87.24%) | 0.44 | 4 (3–6) | |
| Sedation | 3 | 2.56 (1.63–4.03) | 0.68 | 0% (0%–69.41%) | 0.71 | 14 (8–33) | |
| Weight gain ≥7% | 3 | 5.91 (2.14–16.29) | 0.57 | 0% (0%–63.50%) | 0.75 | 29 (10–119) | |
| OFC | Remission | 5 | 1.42 (1.01–2.0) | 4.72 | 15.19% (0%–82.38%) | 0.32 | 19 (9–713) |
| Response | 5 | 1.30 (0.87–1.93) | 8.13 | 50.78% (0%–81.95%) | 0.09 | 17 (NNH 34; NNT 7)b | |
| Weight gain ≥10% | 4 | 16.28 (7.02–37.76) | 0.88 | 0% (0%–47.80%) | 0.83 | 9 (5–20) | |
| Elevated metabolic lab results | 4 | 4.46 (2.07–9.58) | 4.50 | 33.38% (0%–76.44%) | 0.21 | 10 (5–29) | |
| Sedationc | 3 | 2.87 (1.64–5.03) | 7.83 | 74.45% (0%–92.32%) | 0.02 | 5 (3–12) | |
| Edemad | 3 | 13.19 (5.46–31.89) | 0.24 | 0% (0%–13.32%) | 0.89 | 7 (4–16) | |
| Elevated prolactin | 4 | 4.30 (2.36–7.83) | 4.91 | 38.84% (0%–79.16%) | 0.18 | 6 (4–11) | |
| Akathisia | 4 | 1.48 (0.96–2.30) | 3.17 | 5.36% (0%–85.51%) | 0.37 | 28 (NNH 11; NNT 321)b | |
| Quetiapine | Remission | 3 | 1.79 (1.33–2.42) | 0.42 | 0% (0%–50.47%) | 0.81 | 9 (6–19) |
| Response | 3 | 1.53 (1.17–2.0) | 0.79 | 0% (0%–73.67%) | 0.67 | 10 (6–26) | |
| Sedation | 3 | 8.36 (5.83–11.98) | 1.73 | 0% (0%–87.98%) | 0.42 | 3 (2–3) | |
| Elevated metabolic lab results | 2 | 2.45 (1.80–3.34) | 0.40 | 0% (0%–85.14%) | 0.53 | 6 (4–9) | |
| Weight gain ≥7% | 3 | 2.86 (1.11–7.37) | 0.97 | 0% (0%–78.55%) | 0.62 | 37 (12–594) | |
| Risperidone | Remission | 2 | 2.37 (1.31–4.30) | 0.01 | 0% (0%–79.40%) | 0.92 | 9 (5–35) |
| Response | 2 | 1.83 (1.16–2.88) | 0.54 | 0% (0%–86.49%) | 0.46 | 8 (5–33) |
| Drug | Outcome Type | Outcome | Study First Author (Year) [Reference] | g+ (95% CI for Totals) | Raw Units (95% CI for Totals) | p(g+) | Q | I2 (95% CI) | p(Q) |
|---|---|---|---|---|---|---|---|---|---|
| Aripiprazole | Depression | MADRS | Berman (2007) [75] | 0.35 (0.33)a | 3.01 (3.01) | ||||
| Berman (2009) [82] | 0.38 | 3.73 | |||||||
| Marcus (2008) [76] | 0.32 (0.26)a | 2.84 (2.52) | |||||||
| Total | 0.35 (0.23, 0.48) (0.33 [0.20, 0.47])a | 3.15 (2.07, 4.23) (3.14 [1.87, 4.41 ])a | <0.001 (<0.001 )a | 0.18 (0.53)a | 0% (0%–0%) (0% [0%–60.75%])a | 0.92 (0.77)a | |||
| IDS-SR | Berman (2007) [75] | 0.17 | |||||||
| Berman (2009) [82] | 0.13 | ||||||||
| Marcus (2008) [76] | 0.14 | ||||||||
| Total | 0.15 (0.03, 0.27) | 0.02 | 0.08 | 0% (0%–0%) | 0.96 | ||||
| QoL/functioning | SDS | Berman (2007) [75] | 0.19 (0.10)a | ||||||
| Berman (2009) [82] | 0.16 | ||||||||
| Marcus (2008) [76] | 0.25 (0.10)a | ||||||||
| Total | 0.20 (0.08, 0.33) (0.12 [–0.02, 0.26])a | 0.001 (0.08)a | 0.37 (0.1 7)a | 0% (0%–43.78%) (0% [0%–0%])a | 0.83 (0.92)a | ||||
| Q-LES-Q | Berman (2007) [75] | 0.16 | |||||||
| Berman (2009) [82] | 0.26 | ||||||||
| Marcus (2008) [76] | 0.28 | ||||||||
| Total | 0.23 (0.11, 0.36) | <0.001 | 0.64 | 0% (0%–67.50%) | 0.73 | ||||
| Total QoL/functioning | 0.22 (0.09, 0.34) | 0.001 | 0.33 | 0% (0% –36.96%) | 0.85 | ||||
| Global improvement | CGI-S | Berman (2007) [75] | 0.37 | ||||||
| Berman (2009) [82] | 0.31 | ||||||||
| Marcus (2008) [76] | 0.46 | ||||||||
| Total | 0.38 (0.26, 0.50) | <0.001 | 1.05 | 0% (0%–80.19%) | 0.59 | ||||
| Metabolic parameters | Weight gain (kg) | Berman (2007) [75] | 1.67 | ||||||
| Berman (2009) [82] | 0.4 | ||||||||
| Marcus (2008) [76] | 1.05 | ||||||||
| Total | 1.05 (0.35, 1.74) | 0.003 | 12.03 | 83.38% (49.64%– 94.51%) | 0.002 | ||||
| Sexual functioning | SFI overall satisfaction | Berman (2007) [75] | ? | ||||||
| Berman (2009) [82] | 0.25 | ||||||||
| Marcus (2008) [76] | ? | ||||||||
| Total | ?b | ||||||||
| OFC | Depression | MADRS | Corya (2006) [25] | 0.15 | 1.35 | ||||
| Shelton (2001) [27] | 1.04 | 12.40 | |||||||
| Shelton (2005) [26] | 0.08 | 0.65 | |||||||
| Thase 1 (2007) [85] | 0.14 | 1.40 | |||||||
| Thase 2 (2007) [85] | 0.57 | 5.60 | |||||||
| Total | 0.26 (0.04, 0.45) | 2.57 (0.33, 4.81) | 0.02 | 11.37 | 64.83% (7.70%– 86.59%) | 0.02 | |||
| QoL | SF-36 MCS | Corya (2006) [25] | nsc | ||||||
| Shelton (2001) [27] | 0.50 | ||||||||
| Shelton (2005) [26] | –0.10 | ||||||||
| Thase (2007) [85] | 0.13 | ||||||||
| Total | 0.04 (–0.17, 0.25) | 0.72 | 3.13 | 36.18% (0%– 79.57%) | 0.21 | ||||
| SF-36 PCS | Corya (2006) [25] | nsc | |||||||
| Shelton (2001) [27] | –0.06 | ||||||||
| Shelton (2005) [26] | –0.13 | ||||||||
| Thase (2007) [85] | 0.19 | ||||||||
| Total | 0.03 (–0.23, 0.30) | 0.82 | 4.57 | 56.25% (0%– 87.52%) | 0.10 | ||||
| Total QoL | 0.04 (–0.19, 0.26) | 0.74 | 3.46 | 42.20% (0%– 82.51%) | 0.18 | ||||
| Global improvement | CGI-S | Corya (2006) [25] | 0.12 | ||||||
| Shelton (2001) [27] | 0.31 | ||||||||
| Shelton (2005) [26] | 0.27 | ||||||||
| Thase 1 (2007) [85] | 0.08 | ||||||||
| Thase 2 (2007) [85] | 0.32 | ||||||||
| Total | 0.20 (0.08, 0.32) | 0.001 | 2.35 | 0% (0%–64.60%) | 0.67 | ||||
| Prolactin | Prolactin (ng/ml) | Shelton (2005) [26] | ?d | ||||||
| Thase (2007) [85] | 0.27 | 2.50 | |||||||
| Metabolie parameters | Weight gain (kg) | Corya (2006) [25] | 3.98 | ||||||
| Shelton (2001) [27] | 5.79 | ||||||||
| Shelton (2005) [26] | 3.88 | ||||||||
| Thase (2007) [85] | 4.5 | ||||||||
| Total | 4.20 (3.79, 4.61) | <0.001 | 3.33 | 9.80% (0%–86.21 %) | 0.34 | ||||
| Cholesterol (total nonfasting, mg/dl) | Corya (2006) [25] | 0.28 | 7.59 | ||||||
| Shelton (2005) [26] | ?e | ?e | |||||||
| Thase (2007) [85] | 0.43 | 14.3 | |||||||
| Total | 0.37 (0.21, 0.54) | 10.85 (4.28, 17.43) | <0.001 | 1.25 | 19.88% (0%– 90.75%) | 0.26 | |||
| Triglycerides (mg/dl) | Thase (2007) [85] | 0.22 | 23.90 | ||||||
| Total | 0.22 (0.02, 0.41) | 23.90 (2.39, 45.41) | 0.03 | N/A | N/A | N/A | |||
| Quetiapine | Depression | MADRS | Bauer (2009) [81] | 0.41 | 2.89 | ||||
| El-Khalili (2010) [83] | 0.34 | 2.45 | |||||||
| HAM-D | McIntyre (2007) [84] | 0.71 | 5.70 | ||||||
| Total | 0.40 (0.26, 0.53)f | 2.68f | <0.001 | 1.69 | 0% (0%–87.69%) | 0.43 | |||
| QoL | Q-LES-Q | Bauer (2009) [81] | 0.10 | ||||||
| El-Khalili (2010) [83] | –0.02 | ||||||||
| Total | 0.04 (–0.09, 0.18) | 0.53 | 0.68 | 0% (0%–87.62%) | 0.41 | ||||
| Global Improvement | CGI-S | Bauer (2009) [81] | 0.41 | ||||||
| El-Khalili (2010) [83] | ?g | ||||||||
| McIntyre (2007) [84] | 0.69 | ||||||||
| Total | 0.44 (0.26, 0.62) | <0.001 | 0.99 | 0% (0%–89.55%) | 0.32 | ||||
| Prolactin | Prolactin (ng/ml) | Bauer (2009) [81] | 0.03 | 0.44 | |||||
| Prolactin (mlU/L) | El-Khalili (2010) [83] | –0.08 | –12.12 | ||||||
| Total | –0.02 (–0.16, 0.12) | 0.77 | 0.61 | 0% (0%–87.08%) | 0.43 | ||||
| Metabolie parameters | HDL Cholesterol (mg/dl) | Bauer (2009) [81] | –0.11 | –1.0 | |||||
| El-Khalili (2010) [83] | –0.21 | –1.82 | 0.02 | 0.43 | 0% (0%–85.45%) | 0.43 | |||
| Total | –0.16 (–0.29, –0.02) | –1.38 (–2.58, –0.18) | |||||||
| LDL cholesterol (mg/dl) | Bauer (2009) [81] | 0.17 | 4.75 | ||||||
| El-Khalili (2010) [83] | 0.04 | 0.77 | |||||||
| Total | 0.11 (–0.03, 0.24) | 2.86 (–1.03, 6.76) | 0.12 | 0.91 | 0% (0%–89.11%) | 0.34 | |||
| Total cholesterol (mg/dl) | Bauer (2009) [81] | 0.21 | 6.51 | ||||||
| El-Khalili (2010) [83] | 0.18 | 4.83 | |||||||
| Total | 0.19 (0.06, 0.33) | 5.68 (1.57, 9.79) | 0.01 | 0.07 | 0% (0–80.47%) | 0.80 | |||
| Triglycerides (mg/dl) | Bauer (2009) [81] | 0.27 | 19.65 | ||||||
| El-Khalili (2010) [83] | 0.36 | 38.09 | |||||||
| Total | 0.31 (0.17, 0.45) | 26.90 (9.24–44.57) | <0.001 | 0.38 | 0% (0%–84.93%) | 0.54 | |||
| Weight gain (kg) | Bauer (2009) [81] | 0.95 | |||||||
| El-Khalili (2010) [83] | 0.89 | ||||||||
| McIntyre (2007) [84] | 2.65 | ||||||||
| Total | 0.94 (0.62, 1.26) | <0.001 | 1.03 | 0% (0%–79.80%) | 0.60 | ||||
| Sexual functioning | CSFQ | Bauer (2009) [81] | 0.01 | ||||||
| El-Khalili (2010) [83] | ?h | ||||||||
| Total | ? | ||||||||
| Risperidone | Depression | MADRS | Keitner (2009) [73] | nsi | ? | ||||
| HAM-D | Mahmoud (2007) [44] | 0.46 (0.32)j | 2.80 (1,90)j | ||||||
| MADRS | Reeves | 0.60 | 7.11 | ||||||
| Total | 0.48 (0.22, 0.73) (0.34 [0.11, 0.58])j,k | <0.001 (0.004) | 0.09 (0.42) | 0% (0%–80.91%) (0% [0%–85.35%]) | 0.76 (0.52) | ||||
| QoL/functioning | Q-LES-Q | Keitner (2009) [73] | 0.54 | ||||||
| Mahmoud (2007) [44] | 0.39l | ||||||||
| Total | 0.43 (0.20, 0.66)l | <0.001 | 0.33 | 0% (0%–84.36%) | 0.56 | ||||
| SDS | Mahmoud (2007) [44] | 0.57l | |||||||
| Total | 0.57 (0.28, 0.85)l | <0.001 | N/A | N/A | N/A | ||||
| Total QoL/functioning | 0.49 (0.26, 0.73)l | <0.001 | 0.05 | 0% (0%–80.19%) | 0.82 | ||||
| Global improvement | CGI-S | Keitner (2009) [73] | 0.44 | ||||||
| Mahmoud (2007) [44] | 0.72 | ||||||||
| Reeves (2008) [77] | 0.78 | ||||||||
| Total | 0.64 (0.42, 0.87) | <0.001 | 1.29 | 0% (0%–83.87%) | 0.53 | ||||
| Prolactin | Prolactin (ng/ml) | Keitner (2009) [73]m | |||||||
| Mahmoud (2007) [44]m | |||||||||
| Reeves (2008) [77] | 0.80 | 38.85 | |||||||
| Total | 0.80 (–0.19, 1.80) | 38.85 (–5.67, 83.37) | 0.11 | N/A | N/A | N/A | |||
| Weight gain | Weight gain (kg) | Keitner (2009) [73] | 1.81 | ||||||
| Mahmoud (2007) [44] | 1.13 | ||||||||
| Reeves (2008) [77] | –0.45 | ||||||||
| Total | 1.26 | <0.001 | 3.51 | 42.95% (0%–82.87%) | 0.17 | ||||
| Summary | MADRS/HAM-D | 0.34 (0.25, 0.43) | 2.69 (1.82, 3.54)n | <0.001 | 19.44 | 38.26% (0%–67.99%) | 0.08 | ||
| QoL/functioningo | 0.17 (0.06, 0.28) | 0.003 | 18.25 | 50.68% (0%–76.05%) | 0.03 |
Adverse Events.
| Drug | Study First Author (Year) [Reference] | Event | Events/N on Drug | Events/N on Placebo | OR (95% CI)a |
|---|---|---|---|---|---|
| Aripiprazole | Berman (2007) [75] | Fatigue | 11/182 | 6/176 | |
| Berman (2009) [82] | Fatigue | 16/176 | 8/172 | ||
| Sedation | 10/176 | 1/172 | |||
| Marcus (2008) [76] | Fatigue | 19/189 | 7/190 | ||
| Somnolence | 13/189 | 7/190 | |||
| Total | Sedation-related | 69/547 | 29/538 | 2.56 (1.63–4.03) | |
| Berman (2007) [75] | Tremor | 6/182 | 8/176 | ||
| Other EPS-related events | 2/182 | 1/176 | |||
| Berman (2009) [82] | Dyskinesia | 2/176 | 0/172 | ||
| Extrapyramidal disorder | 2/176 | 0/172 | |||
| Muscle spasms | 4/176 | 1/172 | |||
| Muscle twitching | 3/176 | 3/172 | |||
| Psychomotor activity | 1/176 | 0/172 | |||
| Tremor | 5/176 | 6/172 | |||
| Marcus (2008) [76] | Tremor | 12/189 | 5/190 | ||
| Total | EPS-related | 37/547 | 24/538 | 1.54 (0.86–2.74) | |
| Berman (2007) [75] | Metabolic labsb | ? | ? | ||
| Berman (2009) [82] | Metabolic labsc | ? | ? | ||
| Marcus (2008) [76] | Metabolic labsd | ? | ? | ||
| Total | Metabolic labs | ? | ? | ||
| Berman (2007) [75] | Akathisia | 42/182 | 8/176 | ||
| Restlessness | 26/182 | 6/176 | |||
| Berman (2009) [82] | Akathisia | 32/176 | 6/172 | ||
| Restlessness | 22/176 | 6/172 | |||
| Marcus (2008) [76] | Akathisia | 49/189 | 8/190 | ||
| Restlessness | 18/189 | 1/190 | |||
| Total | Akathisia-related | 189/547 | 35/538 | 7.47 (5.07–11.0) | |
| Berman (2007) [75] | Weight gain ≥7% | 13/182 | 2/176 | ||
| Berman (2009) [82] | Weight gain ≥7% | 8/176 | 2/172 | ||
| Marcus (2008) [76] | Weight gain ≥7% | 6/189 | 0/190 | ||
| Total | Weight gain ≥7% | 27/547 | 4/538 | 5.91 (2.14–16.29) | |
| OFC | Corya (2006) [25] | Asthenia | 29/243 | 10/119 | |
| Somnolence | 53/243 | 8/119 | |||
| Shelton (2001) [27] | Asthenia | 5/10 | 4/10 | ||
| Somnolencee | 6/10 | 5/10 | |||
| Shelton (2005) [26] | Asthenia | 30/146 | 25/210 | ||
| Somnolence | 25/146 | 27/210 | |||
| Thase (2007) [85] | Fatigue | 28/200 | 16/206 | ||
| Hypersomnia | 21/200 | 5/206 | |||
| Sedation | 19/200 | 7/206 | |||
| Somnolence | 35/200 | 11/206 | |||
| Total | Sedation | 240/589 | 109/535 | 2.87 (1.64–5.03) | |
| Corya (2006) [25] | Dyskinesia any time (AIMS) | 1/227 | 3/113 | ||
| Dyskinesia at last two visits (AIMS) | 0/227 | 1/113 | |||
| Dyskinesia at end point (AIMS) | 1/227 | 1/113 | |||
| Parkinsonism (SAS) | 6/226 | 7/113 | |||
| Shelton (2001) [27] | Parkinsonism (SAS) | 0/10 | 3/9 | ||
| Shelton (2005) [26] | Dyskinesia any time (AIMS) | 2/140 | 0/197 | ||
| Dyskinesia at last two visits (AIMS) | 0/140 | 0/197 | |||
| Dyskinesia at end point (AIMS) | 0/140 | 0/197 | |||
| Parkinsonism (SAS) | 7/140 | 1/199 | |||
| Tremor | 17/146 | 8/210 | |||
| Thase (2007) [85] | Dyskinesia any time (AIMS) | 1/196 | 3/201 | ||
| Dyskinesia at last two visits (AIMS) | 0/195 | 0/201 | |||
| Dyskinesia at end point (AIMS) | 0/194 | 1/199 | |||
| Parkinsonism (SAS) | 5/192 | 2/195 | |||
| Tremor | 21/200 | 18/206 | |||
| Total | EPS-related | 61/574 | 48/522 | 0.88 (0.25–3.04) | |
| Corya (2006) [25] | Cholesterol high | 12/213 | 0/103 | ||
| Nonfasting glucose high | 6/209 | 0/103 | |||
| HbA1c high | 10/153 | 1/77 | |||
| Shelton (2001) [27] | Cholesterol high | 1/10 | 0/10 | ||
| Nonfasting glucose high | 0/10 | 0/10 | |||
| Shelton (2005) [26] | Cholesterol high | 3/133 | 7/193 | ||
| Nonfasting glucose high | 8/131 | 3/192 | |||
| Hyperglycemia | 3/146 | 0/200 | |||
| Thase (2007) [85] | Cholesterol high | 9/189 | 3/194 | ||
| Fasting glucose high | 2/28 | 0/36 | |||
| Nonfasting glucose high | 6/168 | 1/170 | |||
| HbA1c high | 8/144 | 0/165 | |||
| Triglycerides high | 10/189 | 3/196 | |||
| Total | Metabolic labsf | 78/482 | 18/455 | 4.46 (2.07–9.58) | |
| Corya (2006) [25] | Agitation | 14/243 | 4/119 | ||
| Akathisia any time (Barnes) | 23/227 | 5/109 | |||
| Shelton (2001) [27] | Akathisia | 2/10 | 0/10 | ||
| Akathisia (Barnes) | 3/10 | 2/9 | |||
| Shelton (2005) [26] | Akathisia (Barnes) | 14/138 | 20/196 | ||
| Thase (2007) [85] | Akathisia (Barnes) | 18/188 | 13/188 | ||
| Total | Akathisia | 74/571 | 44/508 | 1.48 (0.96–2.30) | |
| Corya (2006) [25] | Prolactin high | 43/186 | 7/89 | ||
| Shelton (2001) [27] | Prolactin high | 4/9 | 0/7 | ||
| Shelton (2005) [26] | Prolactin high | 34/119 | 6/178 | ||
| Thase (2007) [85] | Prolactin high | 49/159 | 23/172 | ||
| Total | Prolactin highg | 130/473 | 36/446 | 4.30 (2.36–7.83) | |
| Corya (2006) [25] | Peripheral edema | 27/243 | 1/119 | ||
| Edema | 19/243 | 1/119 | |||
| Shelton (2001) [27] | Peripheral edema | 2/10 | 0/10 | ||
| Thase (2007) [85] | Peripheral edema | 24/200 | 2/206 | ||
| Edema | 11/200 | 1/206 | |||
| Total | Edema | 83/453 | 5/335 | 13.19 (5.46–31.89) | |
| Corya (2006) [25] | Weight gain ≥10% | 53/230 | 2/114 | ||
| Shelton (2001) [27] | Weight gain ≥10% | 3/10 | 0/10 | ||
| Shelton (2005) [26] | Weight gain >10% | 11/146 | 0/210 | ||
| Thase (2007) [85] | Weight gain ≥10% | 42/198 | 2/203 | ||
| Total | Weight gain >10% or weight gain ≥10% | 109/584 | 4/537 | 16.28 (7.02–37.76) | |
| Quetiapine | Bauer (2009) [81] | Fatigue | 46/330 | 5/161 | |
| Lethargy | 7/330 | 2/161 | |||
| Sedation | 37/330 | 7/161 | |||
| Somnolence | 66/330 | 5/161 | |||
| El-Khalili (2010) [83] | Fatigue | 33/297 | 7/148 | ||
| Hypersomnia | 6/297 | 0/148 | |||
| Sedation | 58/297 | 6/148 | |||
| Somnolence | 86/297 | 6/148 | |||
| McIntyre (2007) [84] | Sedation/somnolence/lethargy | 25/29 | 14/29 | ||
| Total | Sedation-related | 364/656 | 52/338 | 8.36 (5.83–11.98) | |
| Bauer (2009) [81] | EPS-related | None | None | ||
| El-Khalili (2010) [83] | EPS-related | 17/297 | 5/148 | ||
| McIntyre (2007) [84] | EPS-related | None | None | ||
| Total | EPS-related | 17/297 | 5/148 | 1.66 (0.59–4.67) | |
| Bauer (2009) [81] | Fasting glucose high | 15/330 | 4/161 | ||
| LDL cholesterol high | 47/330 | 18/161 | |||
| HDL cholesterol low | 13/330 | 7/161 | |||
| Total cholesterol high | 60/330 | 14/161 | |||
| Triglycerides high | 40/330 | 5/161 | |||
| El-Khalili (2010) [83] | Fasting glucose high | 11/297 | 5/148 | ||
| HbA1c high | 2/297 | 1/148 | |||
| HDL cholesterol low | 18/297 | 7/148 | |||
| LDL cholesterol high | 12/297 | 5/148 | |||
| Total cholesterol high | 22/297 | 2/148 | |||
| Triglycerides high | 29/297 | 6/148 | |||
| McIntyre (2007) [84] | Metabolic labsh | ? | ? | ||
| Total | Metabolic labsi | 269/627 | 74/309 | 2.45 (1.80–3.34) | |
| Bauer (2009) [81] | Shift from <3 to ≥3 metabolic risk factors | 27/330 | 16/161 | ||
| El-Khalili (2010) [83] | Shift from <3 to ≥3 metabolic risk factorsj | 50/297 | 9/148 | ||
| Total | Shift from <3 to ≥3 metabolic risk factors | 77/627 | 25/309 | 1.57 (0.42–5.92) | |
| El-Khalili (2010) [83] | Akathisia | 6/297 | 1/148 | ||
| Restlessness | 5/297 | 2/148 | |||
| Total | Akathisia-related | 11/297 | 3/148 | 1.75 (0.47–6.55) | |
| Bauer (2009) [81] | Elevated prolactink | 6/330 | 3/161 | ||
| Total | Elevated prolactin | 6/330 | 3/161 | 0.96 (0.23–3.96) | |
| Bauer (2009) [81] | Weight gain ≥7% | 14/330 | 2/161 | ||
| El-Khalili (2010) [83] | Weight gain ≥7% | 13/297 | 3/148 | ||
| McIntyre (2007) [84] | Weight gain ≥7% | 4/18 | 0/14 | ||
| Total | Weight gain ≥7% | 31/645 | 5/323 | 2.86 (1.11–7.37) | |
| Risperidone | Keitner (2009) [73] | Fatigue | 0/62 | 2/33 | |
| Tired | 0/62 | 2/33 | |||
| Mahmoud (2007) [44] | Fatigue | 5/137 | 0/131 | ||
| Lethargy | 1/137 | 3/131 | |||
| Somnolence | 7/137 | 2/131 | |||
| Reeves (2008) [77] | Somnolence | 2/12 | 1/11 | ||
| Total | Sedation-related | 15/211 | 10/175 | 0.88 (0.11–7.55) | |
| Mahmoud (2007) [44] | Dystonia | 0/137 | 1/131 | ||
| Tremor | 1/137 | 1/131 | |||
| Total | EPS-related | 1/137 | 2/131 | 0.47 (0.04–5.29) | |
| Keitner (2009) [73] | Metabolic labsl | ? | ? | ||
| Mahmoud (2007) [44] | Metabolic labsl | ? | ? | ||
| Reeves (2008) [77] | Metabolic labsl | ? | ? | ||
| Total | Metabolic labs | ? | ? | ||
| Mahmoud (2007) [44] | Akathisia | 1/137 | 0/131 | ||
| Total | Akathisia-related | 1/137 | 0/131 | 2.89 (0.12–71.58) | |
| Keitner (2009) [73] | Edema | 0/62 | 0/33 | ||
| Mahmoud (2007) [44] | Peripheral edema | 4/137 | 1/131 | ||
| Reeves (2008) [77] | Edema | 0/12 | 0/11 | ||
| Total | Edema | 4/211 | 1/175 | 3.91 (0.43–35.45) | |
| Keitner (2009) [73] | Weight gain ≥7% | 2/62 | 0/33 | ||
| Mahmoud (2007) [44] | Weight gain ≥7%m | ? | ? | ||
| Reeves (2008) [77] | Weight gain ≥7%m | ? | ? | ||
| Total | Weight gain ≥7% | 2/62 | 0/33 | 2.77 (0.13–59.38) |
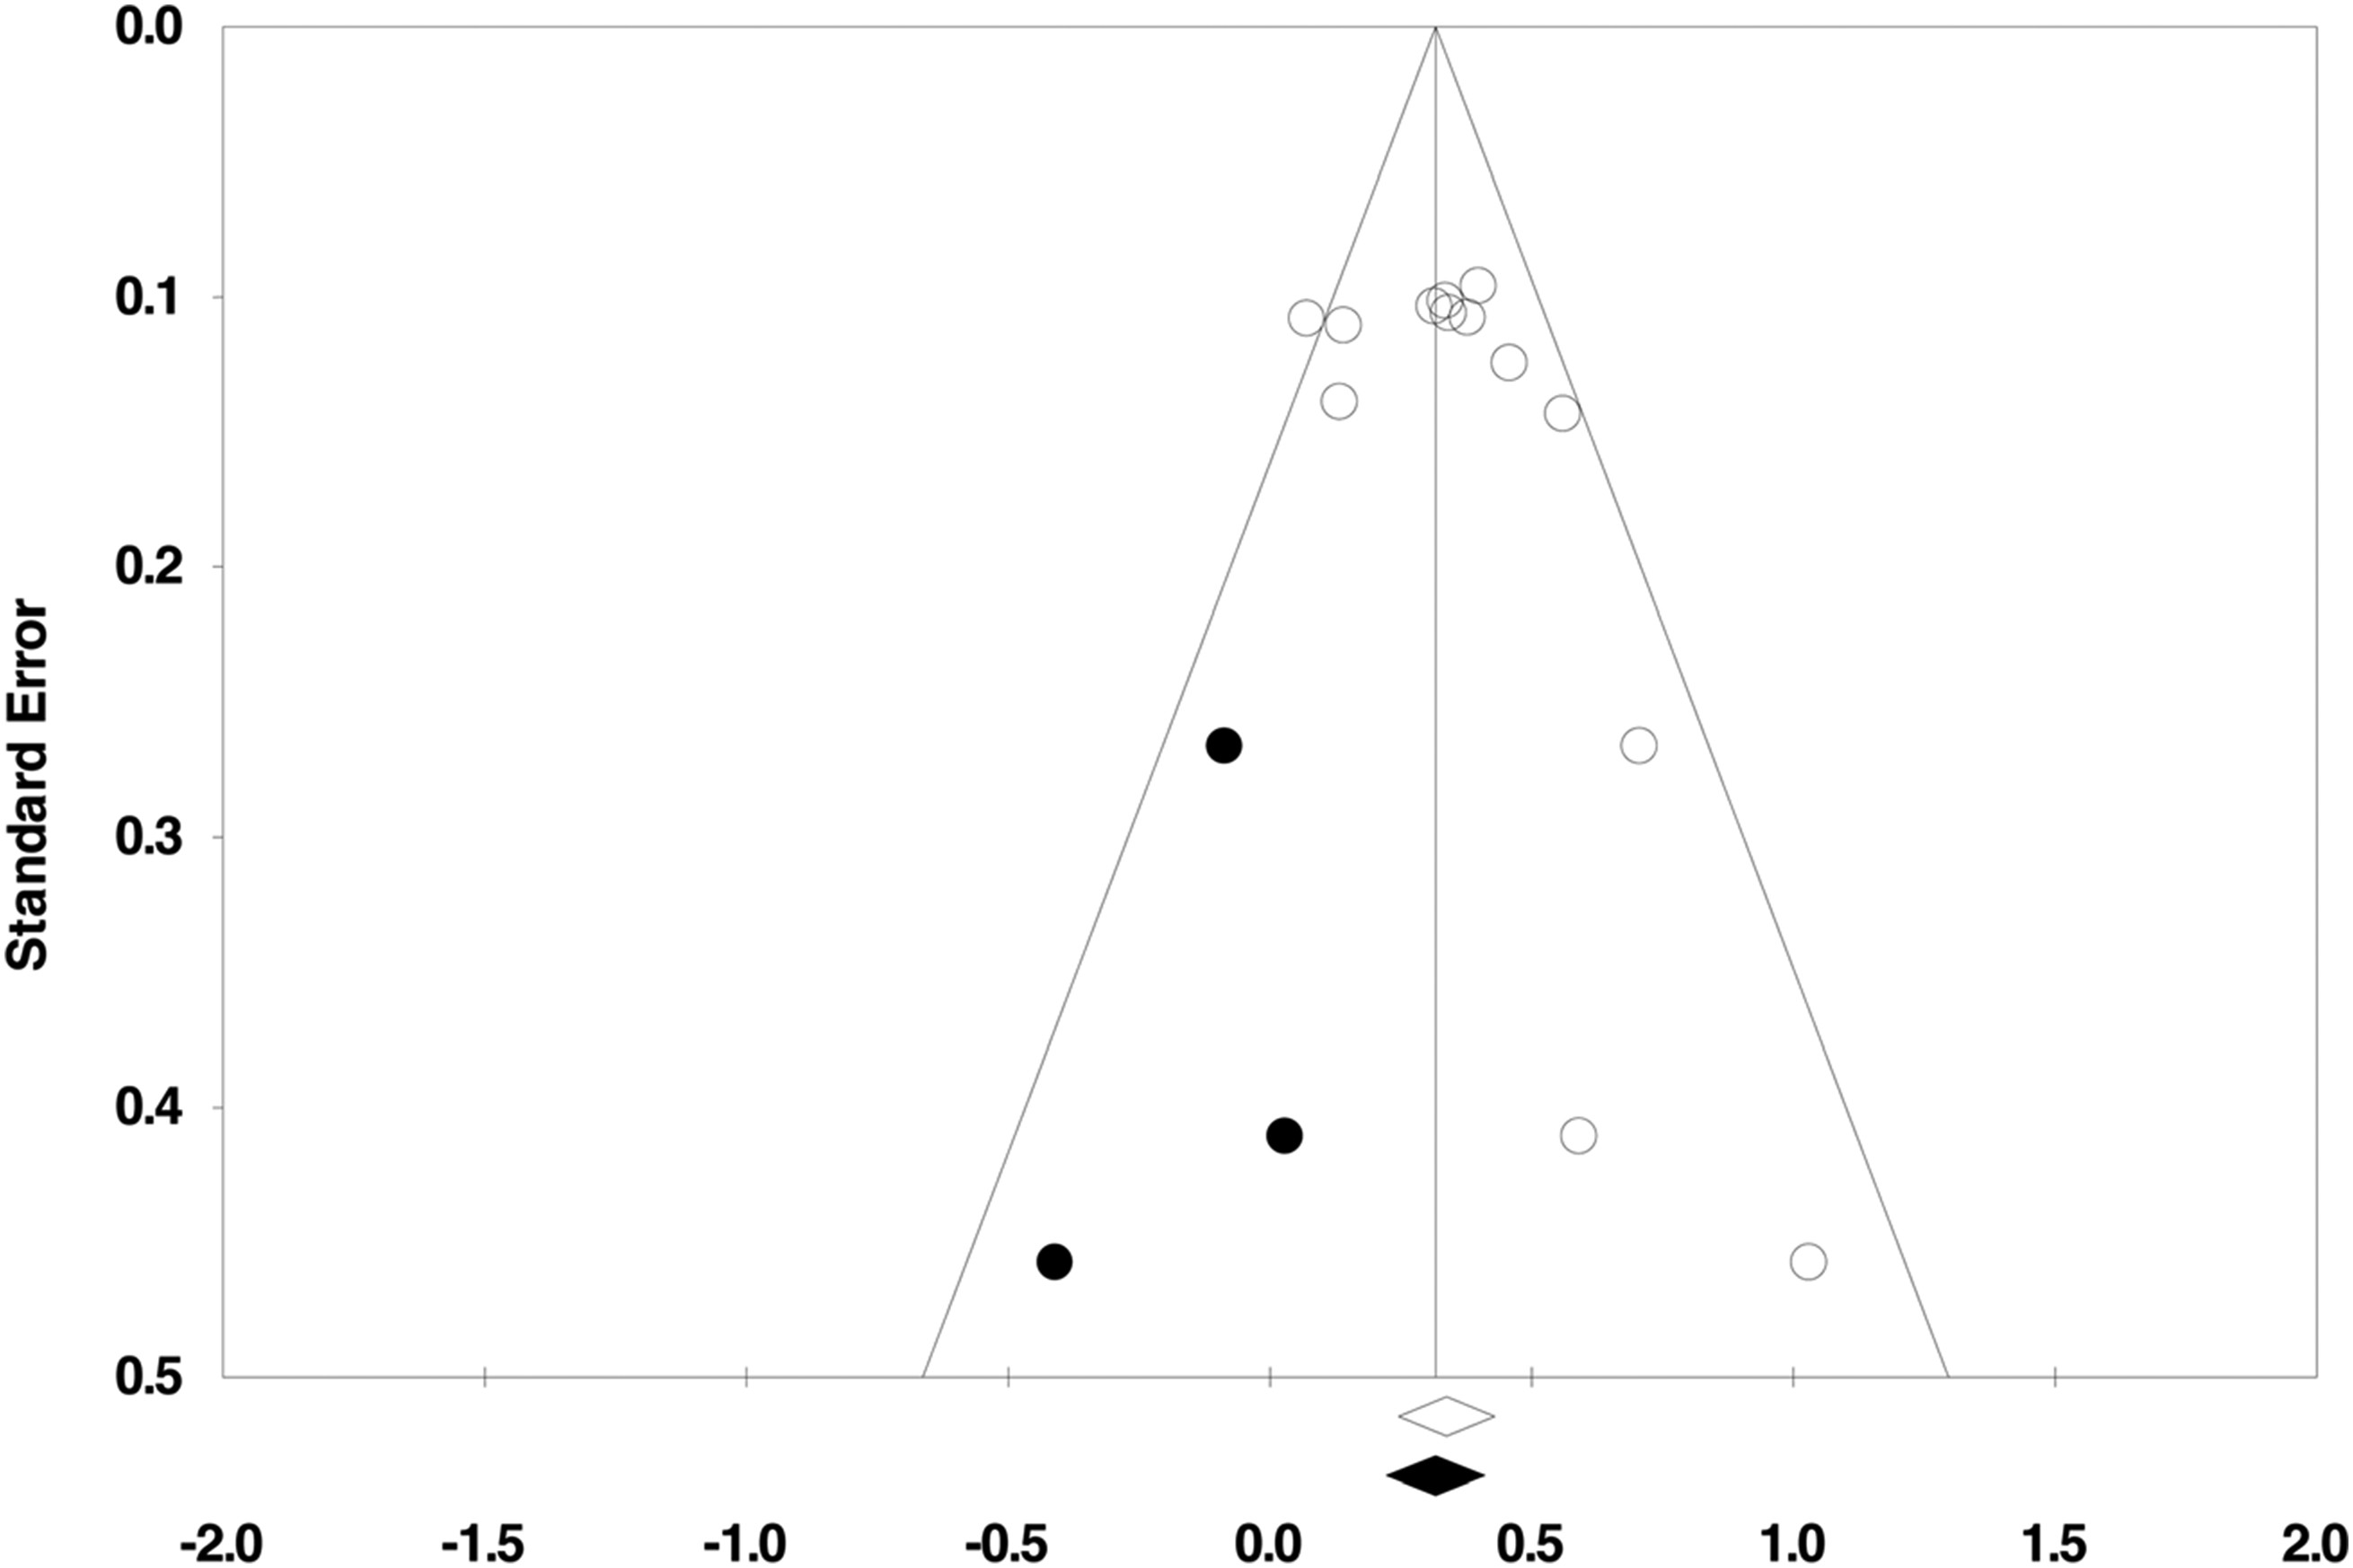
Publication Bias.
Discussion
Editors' Summary
References
Information & Authors
Information
Published In
History
Authors
Metrics & Citations
Metrics
Citations
Export Citations
If you have the appropriate software installed, you can download article citation data to the citation manager of your choice. Simply select your manager software from the list below and click Download.
For more information or tips please see 'Downloading to a citation manager' in the Help menu.
View Options
View options
PDF/EPUB
View PDF/EPUBGet Access
Login options
Already a subscriber? Access your subscription through your login credentials or your institution for full access to this article.
Personal login Institutional Login Open Athens loginNot a subscriber?
PsychiatryOnline subscription options offer access to the DSM-5-TR® library, books, journals, CME, and patient resources. This all-in-one virtual library provides psychiatrists and mental health professionals with key resources for diagnosis, treatment, research, and professional development.
Need more help? PsychiatryOnline Customer Service may be reached by emailing [email protected] or by calling 800-368-5777 (in the U.S.) or 703-907-7322 (outside the U.S.).
