Serious mental illness (SMI) is a significant cause of disability worldwide.
1 Depression, bipolar disorder, anxiety, substance use disorders, and psychosis are among the most common disorders in this class,
2 each of which is not fully understood and has much higher prevalence, cost, and burden than previously estimated.
3 Unfortunately, interventions for many of these disorders are ineffective for a sizable proportion of individuals. Trials of front-line medications for patients with major depressive disorders, for example, indicate remission rates below 50%,
4 and only a minority of these patients fully recover with medications alone.
5 Furthermore, untreated symptoms are associated with worsening disability, suffering, and cost.
6 Targeted prevention and intervention efforts are needed to reduce disability, financial burden, and mortality that these disorders confer.
2Contemporary medicine conceptualizes SMI as a brain disorder.
7 Resting-state functional connectivity (RSFC) derived via functional MRI (fMRI) provides critical insight into the neural bases of these disorders.
8 Across existing RSFC studies of internalizing and externalizing disorders, aberrant connectivity of the prefrontal cortex (PFC) to other brain regions is consistently associated with psychopathology. In general, internalizing disorders (e.g., depression and anxiety spectrum disorders) are related to dysfunctional connectivity between the PFC and emotion-related brain areas (e.g., amygdala
9). Externalizing disorders (e.g., antisocial behavior and substance abuse), on the other hand, are characterized by dysfunctional connectivity between the PFC and brain regions associated with reward/punishment (e.g., striatum
10,11). The generalizability of these findings is limited, however, by small, clinically homogenous samples that are uncharacteristic of the typically highly comorbid SMI populations seen in everyday clinical practice.
Conventional approaches used to analyze neuroimaging data frequently rely on correlational approaches with conclusions based on the degree to which parameters share patterns of variability. For example, our group found significant correlations between interhemispheric inferior frontal gyri RSFC as well as interhemispheric insula RSFC and a global measure of self-reported substance use in a large, heterogeneous sample of inpatients with SMI.
12 This approach and related regression analyses have a long and established history but are limited to an a priori selection of a restricted number of parameters to avoid the known problems associated with multiple comparisons. While conservative in their conclusions, these approaches likely contribute to the relatively slow pace of advances in the understanding and treatment of SMI.
More recently, machine learning approaches have been used to create models based on neuroimaging to predict treatment response among a variety of conditions, such as depression.
13 While these approaches are more complex than conventional bivariate analyses, the field tends to rely on supervised learning approaches. Small sample sizes, again, are evident across supervised as well as unsupervised machine learning approaches.
13 The current study, on the other hand, demonstrated the feasibility of applying an agnostic analytic approach, topological data analysis (TDA), to RSFC data from a large (N=235), heterogeneous SMI sample collected early during the course of hospitalization to a specialty treatment facility. Patterns of connectivity between PFC and select brain regions associated with SMI were analyzed. This hypothesis-generating approach allowed for comparison of groups of patients (based on extensive patterns of connectivity) across diagnostic categories and treatment response domains.
Methods
Participants
Participants were 279 adult inpatients, voluntarily admitted to a specialty hospital (November 2012–September 2014) who consented to and completed the neuroimaging portion of the study. Of the 279 inpatients, 44 (15.3%) were excluded from the final analysis due to incomplete imaging data or incomplete clinical data. Final analyses are based on the remaining 235 inpatients with complete data.
Setting
All patients received treatment at a hospital specializing in SMI. Most had limited benefit from prior trials of psychotherapy, psychopharmacology, and/or psychiatric hospitalizations. Typical lengths of stay are 6–8 weeks, allowing for intensive psychotherapeutic and psychopharmacologic interventions in the context of a therapeutic milieu. Hospital-based interventions include: maximizing medication management, individual psychotherapy, group psychotherapy (process, psychoeducational), couples and family therapy, as well as structured leisure time activities. Chemical dependency and eating disorders evaluation and treatment supplement standard of care as indicated.
Procedures
Clinical data were collected as part of standard of care in the context of the hospital’s ongoing efforts to measure the effectiveness of treatment.
14 Assessments were done throughout the course of the hospitalization; however, only data collected at admission and discharge were used in the present study.
Neuroimaging: Acquisition, Preprocessing, and Resting-State Analysis
In the neuroimaging phase of the study, participants underwent an fMRI protocol early in the course of their hospitalization; details are discussed below in the Results section. Using a Siemens 3T Trio scanner, participants were scanned in a series of MRI sequences including 1) a T1-weighted structural scan (4.5-minute structural MPRAGE sequence, TE=2.66 ms, TR=1200 ms, flip angle=12°, 256×256 matrix, 160 1-mm axial slices at 1×1×1 mm voxels) to obtain detailed anatomy and 2) resting-state fMRI for 5 minutes while participants viewed a crosshair (TE=40 ms, TR=2 seconds, flip angle=90°, 3.4×3.4×4 mm voxels). Participants were instructed to “let their mind wander.” RSFC data were preprocessed using SPM8 (The Wellcome Trust, London), including realignment to the first time series image, coregistration to the mean image, normalization to the Montreal Neurological Institute (MNI) echo planar imaging template, and smoothing with a 6-mm full width at high maximum Gaussian smoothing kernel. Individual time points with excessive movement were removed using the software ART (ARtifact detection Tools, Susan Whitfield-Gabrieli, MIT [
http://web.mit.edu/swg/art/art.pdf]) utilizing the default parameters. Thus, data from all patients were included in the final analysis.
Regions of interest (ROI) for inferior, medial, and superior prefrontal cortex (frontal gyri); nucleus accumbens; putamen; amygdala; insula; anterior cingulate cortex; supplemental motor area; striatum; caudate; globus pallidus; habenula; dorsal, medial raphe; Broadmann area 25; medial vestibular cortex; septum verum; locus coeruleus; lingual gyrus; paracentral lobule; precuneus; and cuneus were created in AFNI
15 using the MNI atlas. These ROIs were selected due to prior literature associating them with serious mental illness and/or because of their biological connection to areas implicated in prior research (e.g., locus coeruleus downstream connections from the habenula).
16The MatLab CONN toolbox
17 was used to analyze RSFC data. Gray matter, white matter, and cerebrospinal fluid were segmented. Movement identified during preprocessing was included as six regressors of no interest; data with excessive movement were removed. Cerebrospinal fluid and white matter were also included as regressors. After processing, Fisher’s z-transformed correlation coefficients between the different seeds for each subject were identified and analyzed. All pairs of regions were analyzed, and RSFC recorded for each subject. For further details regarding the imaging protocol, see Viswanath and colleagues.
12Measures
Demographic variables and treatment histories were collected using a standardized survey.
14 Structured Clinical Interview for DSM-IV Axis I [SCID-I
18] and Axis II [SCID-II
19] interviews were conducted by masters-level research staff.
The primary outcome measure in this study was the 12-item World Health Organization Disability Assessment Schedule 2.0 (WHO-DAS 2.0
20). This self-report measure of functional disability associated with illness was selected over other disease- and symptom-specific measures given that 1) significant disability is associated with SMI
1; 2) The Diagnostic and Statistical Manual of Mental Disorders, Fifth Edition (DSM-5) Disability Study Group endorsed the use of the WHODAS 2.0 to replace the Global Assessment of Functioning with the revised diagnostic classification system, emphasizing that it is the best current measure of disability for routine clinical use
21; and 3) there is known diagnostic heterogeneity and significant comorbidity among the patient population treated at the study institution.
22 The WHO-DAS 2.0 quantifies disability associated with illness regardless of underlying etiology or number of medical/psychiatric comorbidities,
23 resulting in an ideal cross-cutting measure of treatment outcome in a multimodal treatment setting with myriad diagnostic presentations. The measure assesses six domains of functioning corresponding to International Classification of Functioning, Disability and Health codes: cognition, mobility, self-care, getting along, life activities and participation. The measure has sound psychometric properties and is widely used.
20,23 Raw scores were used for all analyses.
The Patient Health Questionnaire-15 (PHQ-15
24) is a broadband, self-report measure of somatic complaints with sound psychometric properties that was included in subsequent analyses as a covariate (discussed below). Physical/medical comorbidities are common among individuals with SMI,
25 including among patients treated at the study hospital,
22 and have the potential to significantly contribute to disability.
Data Analyses
TDA was done using the Ayasdi 3.0 platform (Ayasdi Inc., Menlo Park, Calif.), allowing for an exploration of the shape of the RSFC data. Briefly, TDA is a process of capturing geometric information about data in the form of topological summaries, represented as networks on the Ayasdi 3.0 platform.
26 Unlike traditional networks where nodes represent individuals and edges between nodes encode a measure of similarity between patients, each node in a topological network contains a number of patients who are similar over select characteristics—in this analysis, RSFC parameters. Nodes in the network are connected to one another via edges; nodes contain participants who are similar. The topological analyses and subsequent creation of the network are contingent on two parameters: metric and lens. Metrics are a measurement of
similarity and measure the distance between two points, typically between rows in a data set. Lenses are filters that convert the data set into a vector, such that each row of data in the data set provides a real number in the vector. Essentially, lenses convert every row in a data set into a single number. Lenses can come from geometry, statistics or any other branch of mathematics. Lenses are used to create overlapping bins in the data set and allow the data to be clustered. Metrics and lenses are used together to complete the topological analysis. Details about the mathematical underpinnings of the construction of the topological network can be found elsewhere.
26,27Topological networks were generated based on 204 possible connections between the right and left PFC from a total of 648 pairing of ROIs that have been associated with SMI as detailed above. They were created using six default combinations of metric and lens parameters on the Ayasdi 3.0 platform, including 1) correlation and multidimensional scaling (coordinates 1 and 2); 2) correlation and L-infinity centrality; 3) correlation and neighborhood lens 1 and 2; 4) variance normalized Euclidean and principal component analysis (coordinates 1 and 2); 5) variance normalized Euclidean and L-infinity centrality; and 6) variance normalized Euclidean and neighborhood lens 1 and 2. Details about the six combinations of metric and lens are published elsewhere.
26,27 Strength of association among RSFC brain regions was based on Kolmogorov-Smirnov (K-S) test statistic with associated p value. K-S statistics range in value from 0 to 1 with higher values being rarer than lower values and indicative of larger difference between groups.
28,29 Given the high number of possible connections among brain regions and the increased likelihood of spurious findings, we employed a permutation-based correction to family wise error rate (family-wise error-corrected α=0.05) to determine statistically-significant RSFC parameters that contributed to the generation of the topological network.
Patients who shared the same or neighboring nodes in a TDA network were identified as being similar and were grouped together; they were then compared with the remaining sample. Comparisons between these two groups of patients were done across clinical data collected at admission using independent samples t tests and Fisher’s exact test for continuous and categorical variables, respectively. Group differences in treatment outcome (discharge scores on the WHO-DAS 2.0) were examined using analysis of covariance (ANCOVA). Given their potential to bias discharge findings, ANCOVA models employed to evaluate treatment outcomes included the following covariates: admission levels of disability based on the WHO-DAS 2.0, admission levels of somatic complaints based on the PHQ-15, and any other potential differences in sociodemongraphic and clinical characteristics observed at admission. These analyses were conducted using SAS/STAT software, Version 9.3 (Cary, N.C.).
Ethics
This study conforms to guidelines set forth in the latest version of the Declaration of Helsinki. The Baylor College of Medicine’s Institutional Review Board approved the study design. Participants provided informed consent to participate in the study after receiving full explanation of all procedures.
Results
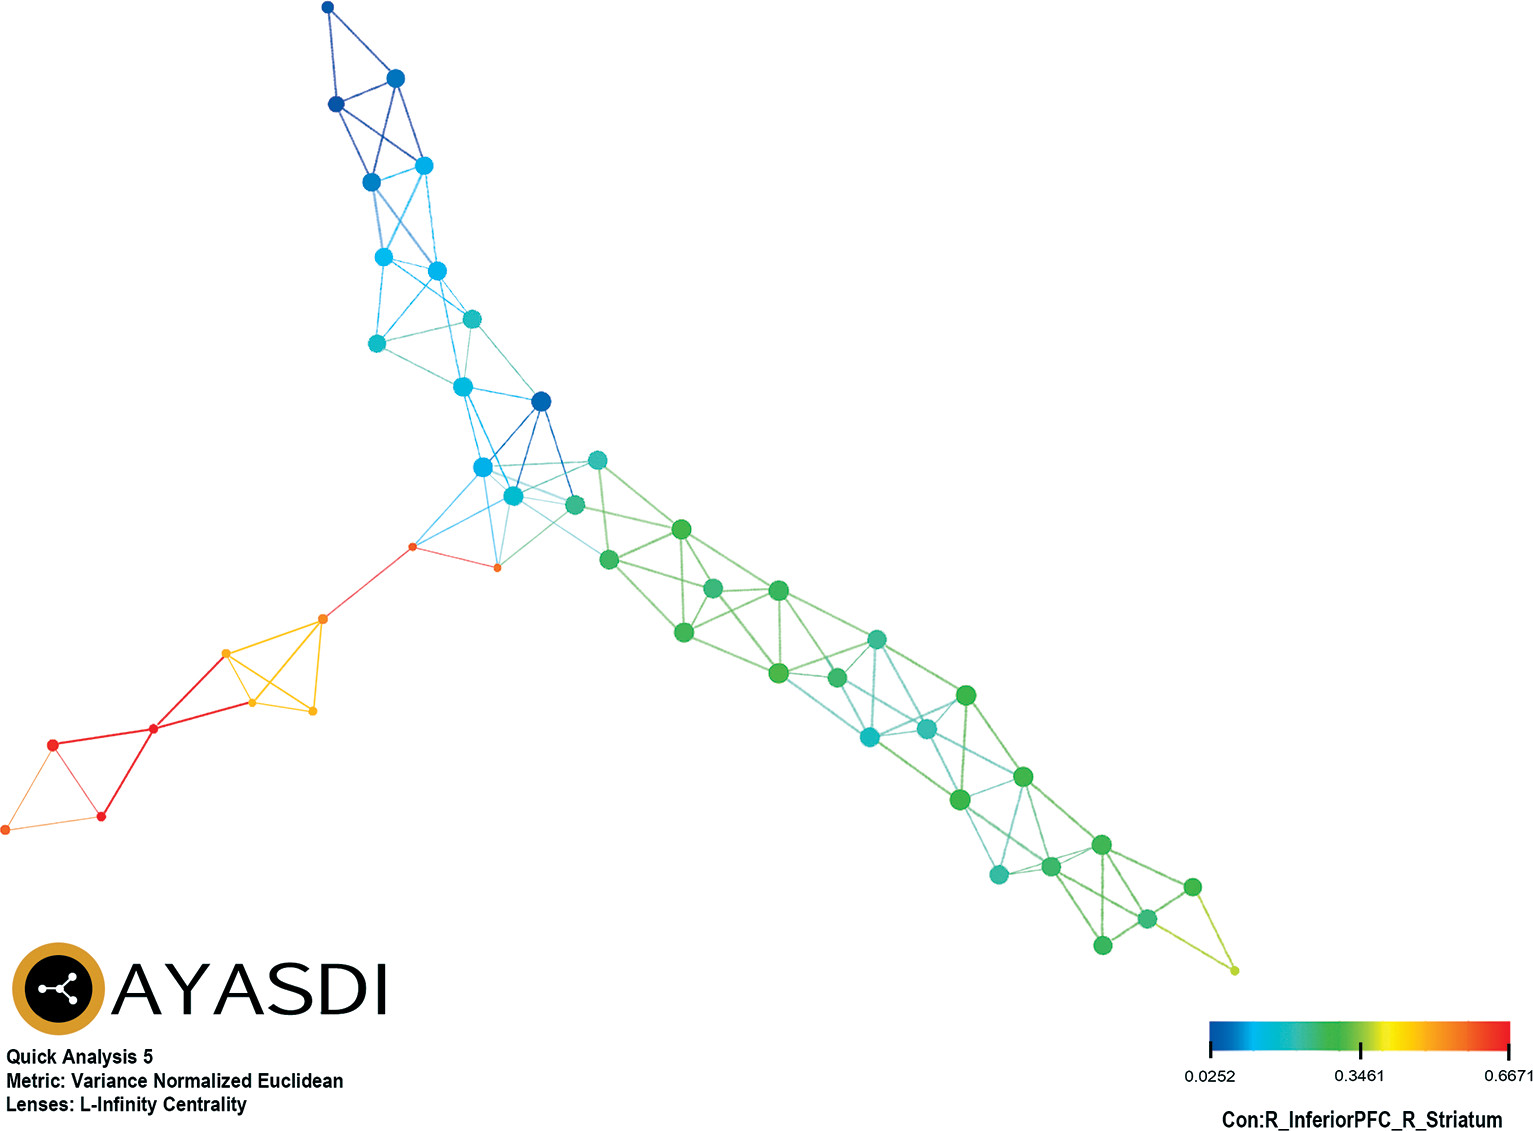
Of the six TDA analytic strategies evaluated, only variance normalized Euclidean and L-infinity centrality provided separation of patients based on connectivity between PFC and select brain regions. Two groups were represented: group 1 (N=13; 5.5%) and group 2 (N=222; 94.5%). There was no difference between group 1 (20.2±16.0 days) and group 2 (24.3±22.8 days) in duration of time that elapsed between date of admission and date of the fMRI (t=1.3, df=233, p=0.19). Diffuse, global RSFC drove the observed grouping of patients. Of note, connectivity between PFC and striatal brain regions accounted for 32.8% (41/125) of the significant differences between groups across RSFC data, including the most prominent (K-S≥0.90) of the connectivity parameters, between the right inferior PFC and right striatum (K-S=0.9009, p<0.0001) (
Table 1). As an exemplar of the RSFC derived groupings,
Figure 1 represents color-coded grouping of patients based on connectivity between right inferior PFC and right striatum.
The study sample completed all self-report assessments within days of their admission; group 1 (4.0±5.6 days) did not significantly differ from group 2 (4.4±6.9 days) in duration of time that elapsed between date of admission and date of assessment (t=0.22, df=233, p=0.83). On average patients met criteria for more than 3 axis I disorders at admission. Depressive, anxiety and substance use disorders were most common. Bipolar spectrum disorders were evident in almost 20% of the sample. Psychotic spectrum disorders were relatively less common but represented. Almost 40% of the sample met criteria for at least one personality disorder. Patients had required considerable previous treatment: multiple previous therapists, psychiatrists/prescription providers, acute psychiatric hospitalizations, and extended (>5 days) psychiatric hospitalizations. Between group (group 1 versus group 2) comparisons indicated no significant differences across sociodemographic and prior service utilization characteristics (
Table 2). Although borderline personality disorder was most common, group 1 was more likely to receive a diagnosis of antisocial personality disorder (15.38%) than group 2 (1.80%), p=0.038.
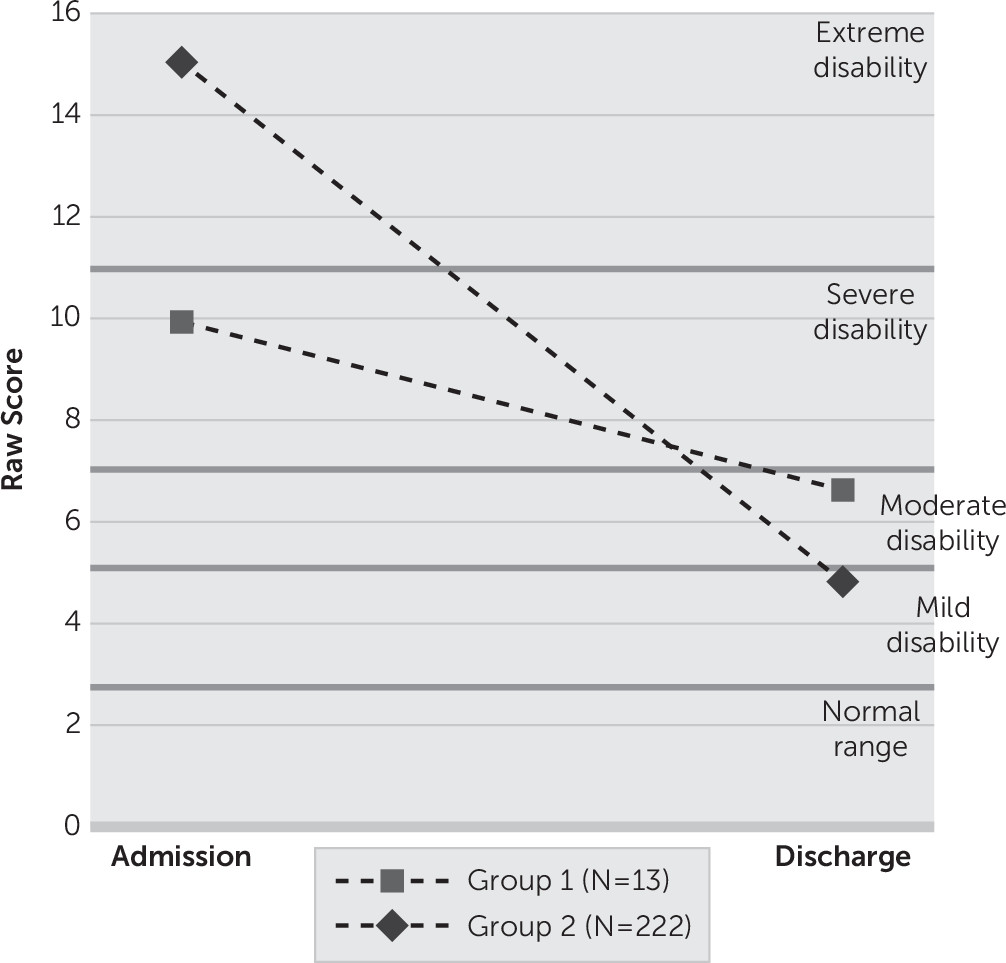
After controlling for self-reported disability at admission (p<0.0001), diagnosis of antisocial personality disorder (p=0.046), and somatic complaints (p=0.582), results indicate that group 1 (N=13) evidenced less improvement than group 2 (N=222) from admission to discharge on the WHO-DAS 2.0 total score (F=4.35, df=1, 230, p=0.0381). Relative to their age-matched, normative peers,
30 group 1 moved from the severe range of disability (90–95th percentile; 9.92±7.81) to the moderate range of disability (85–89th percentile; 6.62±7.12), while group 2 moved from the extreme range of disability (95–99th percentile; 15.02±9.26) to the mild range of disability (75th–84th percentile; 4.82±5.37). (
Figure 2). Qualitatively, 30.8% of group 1 scored in the remission category at discharge (normal range of functioning in terms of WHO-DAS 2.0), whereas 46.0% of group 2 scored in the remission category at discharge. Additional analyses indicated that group 1 evidenced less improvement at discharge across two of six domains of disability on the WHO-DAS 2.0 after controlling for the corresponding admission disability domain, diagnosis of antisocial personality disorder, and somatic complaints. See
Table 3 for details. In absolute terms, group 1 (3.3±5.19) evidenced approximately one-third of the change in WHO-DAS 2.0 total score from admission to discharge compared with group 2 (10.19±7.95), t(233)=3.08, p=0.0023. Qualitatively, 30.8% of group 1 scored in the remission category at discharge (normal range of functioning in terms of WHO-DAS 2.0), whereas 46.0% of group 2 scored in the remission category at discharge.
Discussion
Concerted multidisciplinary efforts have identified a number of biomarkers of SMI; yet, robust, replicable, and clinically actionable biomarkers remain elusive.
7,31 Through an agnostic, exploratory analytical approach, the current study examined RSFC of the PFC in the largest, clinically heterogeneous SMI population collected to date. This novel analytic approach identified a subset of patients who evidenced diffuse, global hyperconnectivity with primarily stronger connectivity between the PFC and striatal regions. Subsequent analyses suggest that patients in the group with diffuse, global hyper-connectivity were more likely to meet formal criteria for an antisocial personality disorder diagnosis compared with patients with lesser connectivity. Additionally, hyper-connectivity was associated with an attenuated treatment response after weeks of intensive, multimodal treatment – even after controlling for baseline characteristics (e.g., baseline disability, presence of antisocial personality disorder, baseline somatic complaints). Thus, the attenuated treatment response cannot be accounted for solely by the presence of antisocial personality disorder. Despite receiving the same intensive treatment, a small group of patients experienced an attenuated treatment response and discharged in the moderate range of disability. Only 30.8% of this group would be classified as being in remission upon discharge (i.e., falling in the normal range of functioning on the WHO-DAS 2.0) compared with 46.0% patients in the other group. If these findings can be replicated, the policy implications of a biomarker of differential treatment response (15.2% fewer patients remitting) potentially could have significant repercussions for the broader SMI patient population.
Recently, dopaminergic-mediated pathways between the PFC and striatum have been implicated in neurobiological models of anhedonia in depression. Treadway and Zald
32 suggested that motivational aspects of the reward circuitry could distinguish varieties of anhedonia based on deficits in pleasure and motivation. They introduced the term “decisional anhedonia” to address the influence of anhedonia on reward decision-making. Perhaps a high degree of connectivity between the PFC and striatum reflects a lack of flexibility in the face of potentially reinforcing stimuli and is reflective of a treatment-refractory neurobiology among individuals with SMI, especially among individuals meeting criteria for antisocial personality disorder. Alternatively (or perhaps additionally), this hyperconnectivity may be a marker of maladaptive, thrill-seeking personality traits, as is common among many individuals with antisocial personality disorder or substance use disorders.
11 Insofar as the observed pattern of RSFC collected early during treatment is replicable in a future sample, this potential biomarker may indicate the need for modification of standard of care for patients who are likely to evidence an attenuated treatment response such as the use of pharmacogenomics testing to guide medical decision-making (e.g., evaluation of polymorphisms that may affect dopaminergic activity
33;).
Findings from this study also may be useful in advancing the overarching goal of the NIMH Research Domain Criteria (RDoC) initiative to develop an empirically derived system for diagnosing and treating mental disorders based on genetic, neural and behavioral data.
34 Specifically, RDoC is calling for a new approach to investigating psychopathology beyond traditional diagnostic boundaries because studies evaluating the latent structure of adult personality pathology at the symptom level have found only modest support for discrete DSM-based disorders (see
35 for a review). Indeed, there has been a growing interest in considering models that evaluate general factors that account for both common variances shared across diagnoses and unique sources of variance that may represent more specific forms of psychopathology.
36,37 As yet, putative meta-structures of psychopathology have yet to be validated with biological data. It is against this background that the analytic approach of the current study has potential value.
While this study has a number of strengths including a relatively large, heterogeneous sample typical of real world patients, with extensive imaging data and objective measures of clinical functioning, limitations must be acknowledged. The data analytic approach was by design exploratory and could have yielded spurious findings given the sheer number of RSFC brain regions examined. However, selecting PFC connections to select brain regions, correcting for multiple comparisons using among the most balanced correction procedures (i.e., permutation-based correction of family-wise error),
38 as well as limiting interpretation of significant findings to a very high threshold for statistical significance were a priori decisions to increase the likelihood of finding a true signal. Nonetheless, replication of these findings is critical before using connectivity data to guide medical decision-making on the individual level. Data collection for a validation study is currently underway; however, a large sample will be necessary to be sufficiently powered to replicate findings given the limited numbers of patients with an attenuated treatment response (5.5%) compared with the rest of the sample. We anticipate recruiting another 300 participants for the validation study and will use findings from this study to employ more traditional analytic approaches based on a priori hypotheses. Future analytic approaches with a large enough sample may also include appropriately selected cross-validation techniques.
39 Additionally, though it is possible that extreme values and violations of underlying assumptions of normally distributed data might have biased findings, this is unlikely given 1) the large sample size (N=235) and associated robustness that it provides to the influence of outliers
40; 2) reliance on the nonparametric, K-S statistics to establish strength of association given that it is essentially an analysis of ranks and does not assume an underlying distribution to the data
28; and 3) post hoc analyses of all of the RSFC data revealed no violations of the underlying assumptions of normality (Shapiro-Wilks) and only one significant difference (out of a possible 125 RSFC parameters) between groups’ standard deviations (F’; right inferior PFC to left superior PFC, p=0.0001). Despite limitations, the exploratory, novel data analytic approach applied to RSFC data in this study represents a paradigm shift from more traditional, hypothesis-driven approaches to explore clinical phenomenology and evaluation of interventions. Such approaches may be necessary to increase the pace of discovery to address the global burden of SMI.
Acknowledgments
The authors thank the team of Ayasdi Inc. (Gunnar Carlsson, Devi Ramanan, and Ajith Warrier) for clinical assistance provided in understanding topological data analysis, as well as application of their proprietary data analytics platform.


