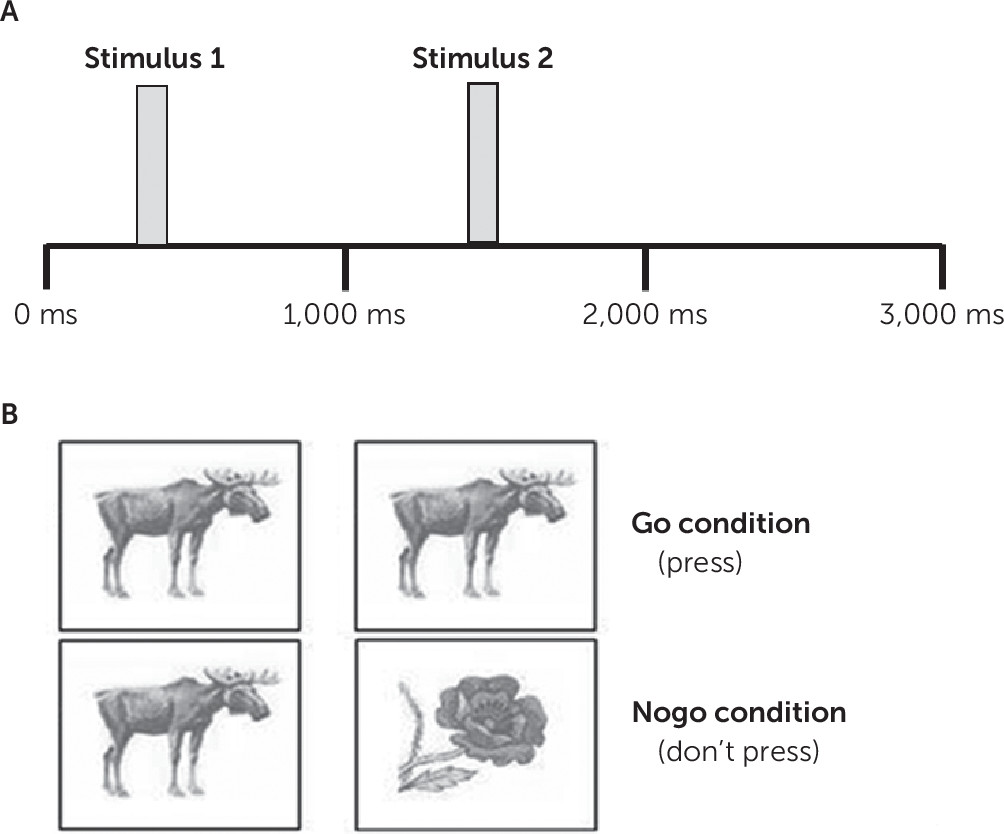
Obsessive-compulsive disorder (OCD), characterized by recurrent obsessions and compulsions, affects 1%−3% of the general population (
1–
3). Although classified as a single condition, individuals with OCD have varied experiences (
4). One way to characterize OCD in an individual is to use the Yale-Brown Obsessive Compulsive Scale (Y-BOCS), which is considered the gold standard tool for assessing severity and symptom diversity in OCD (
5,
6). Several studies have used the Y-BOCS to identify symptom clusters, including a large meta-analysis examining factor analytic studies that found that four factors explain 79% of the variance in OCD symptoms: symmetry, forbidden thoughts, cleaning, and hoarding (
7–
9). These four clusters appear stable across the lifespan and robust to differences in factor analytic techniques of individual meta-analyses. The same four clusters have been confirmed in other studies (
10,
11); however, under DSM-5, hoarding became a separate classification, leaving three symptom clusters within OCD (
12). As well as symptom heterogeneity, which may be identified with the Y-BOCS, individuals with OCD often have psychiatric comorbidities, most notably depression (
13). Critically, symptom cluster and comorbidity are known to affect treatment responsiveness; therefore, it is beneficial to better understand this heterogeneity (
8,
14–
16). Despite the importance of these factors, research has typically not accounted for the heterogeneity of OCD symptoms and comorbidities within study designs, which may have contributed to mixed findings in some areas (
17). One such area of research is response inhibition.
Several studies have identified differences in performance on response inhibition tasks in OCD when compared with healthy control participants using go/nogo tasks (
18,
19), but findings are inconsistent. Behavioral measures show both faster reaction times (
20) and slower reaction times in OCD (
21). There are also reports of altered error rates (
22), although others find no differences in any measure (
23–
29) in OCD. Of these studies, only one (
26) noted the symptom cluster and did not consider this as a variable in the analysis. In the majority of the studies, those with comorbidities including depression were excluded (
20–
24,
28,
29); where comorbid depression was recorded (
25–
27), it was not differentiated in the analysis. The failure of these studies to take into account two important sources of heterogeneity in OCD may have in part contributed to the inconsistent findings.
Neurophysiological data from go/nogo tasks focus on the event-related potentials (ERPs) N200 (negative deflection at frontal and central sites at 200–300 ms) and P300 (positive deflection at frontal and central sites at 300–600 ms) (
30), often considered collectively as the N2-P3 complex (
31). These N2 and P3 components are associated with the early and late phases of response inhibition, respectively, and would normally be increased in inhibition conditions (
30). Analysis of the N2-P3 complex in OCD has shown inconsistent results; N2 has been reported to be both increased (
22,
32,
33) and decreased (
26,
27,
34) in OCD, and P3 has also been reported as both increasing and decreasing in different studies of OCD (
32,
33,
35,
36) or not changing at all. As with the behavioral data, only one study noted symptom clusters but did not analyze according to it (
26). The majority also excluded those with comorbid depression (
22,
32,
33,
35,
36); the remaining three studies included those with depression but did not account for this in their analysis (
26,
27,
34). This again demonstrates that key sources of heterogeneity have been neglected in previous studies.
Results
ERP But Not Behavioral Measures Differentiate Between Patients With OCD and Control Subjects
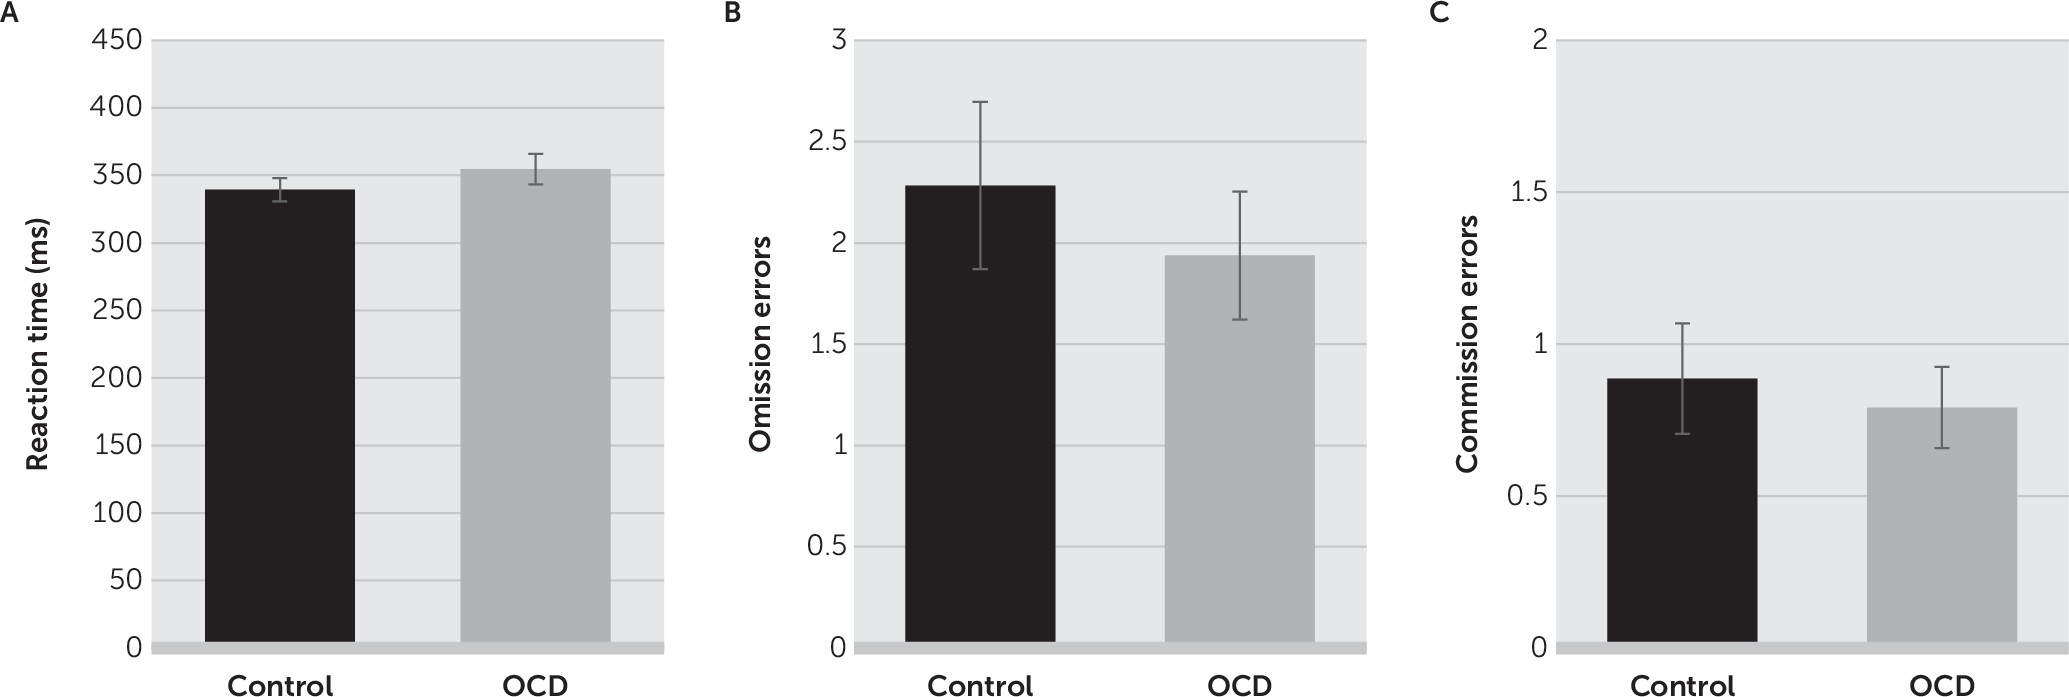
There was no significant difference in the mean reaction time for correct responses between the control group (mean, 339.5 ms [SD=63.0]) and the OCD group (mean, 354.6 ms [SD=78.4]; t=1.069, df=99, p=0.288;
Figure 2A). There were also no differences in the number of omission errors (control group: mean, 2.3 [SD=3.0]; OCD group: mean, 1.9 [SD=2.2]; t=0.655, df=99, p=0.514;
Figure 2B) or commission errors (control group: mean, 0.9 [SD=0.0]; OCD group: mean, 0.8 [SD=0.2]; t=0.415, df=99, p=0.679;
Figure 2C) between the two groups.
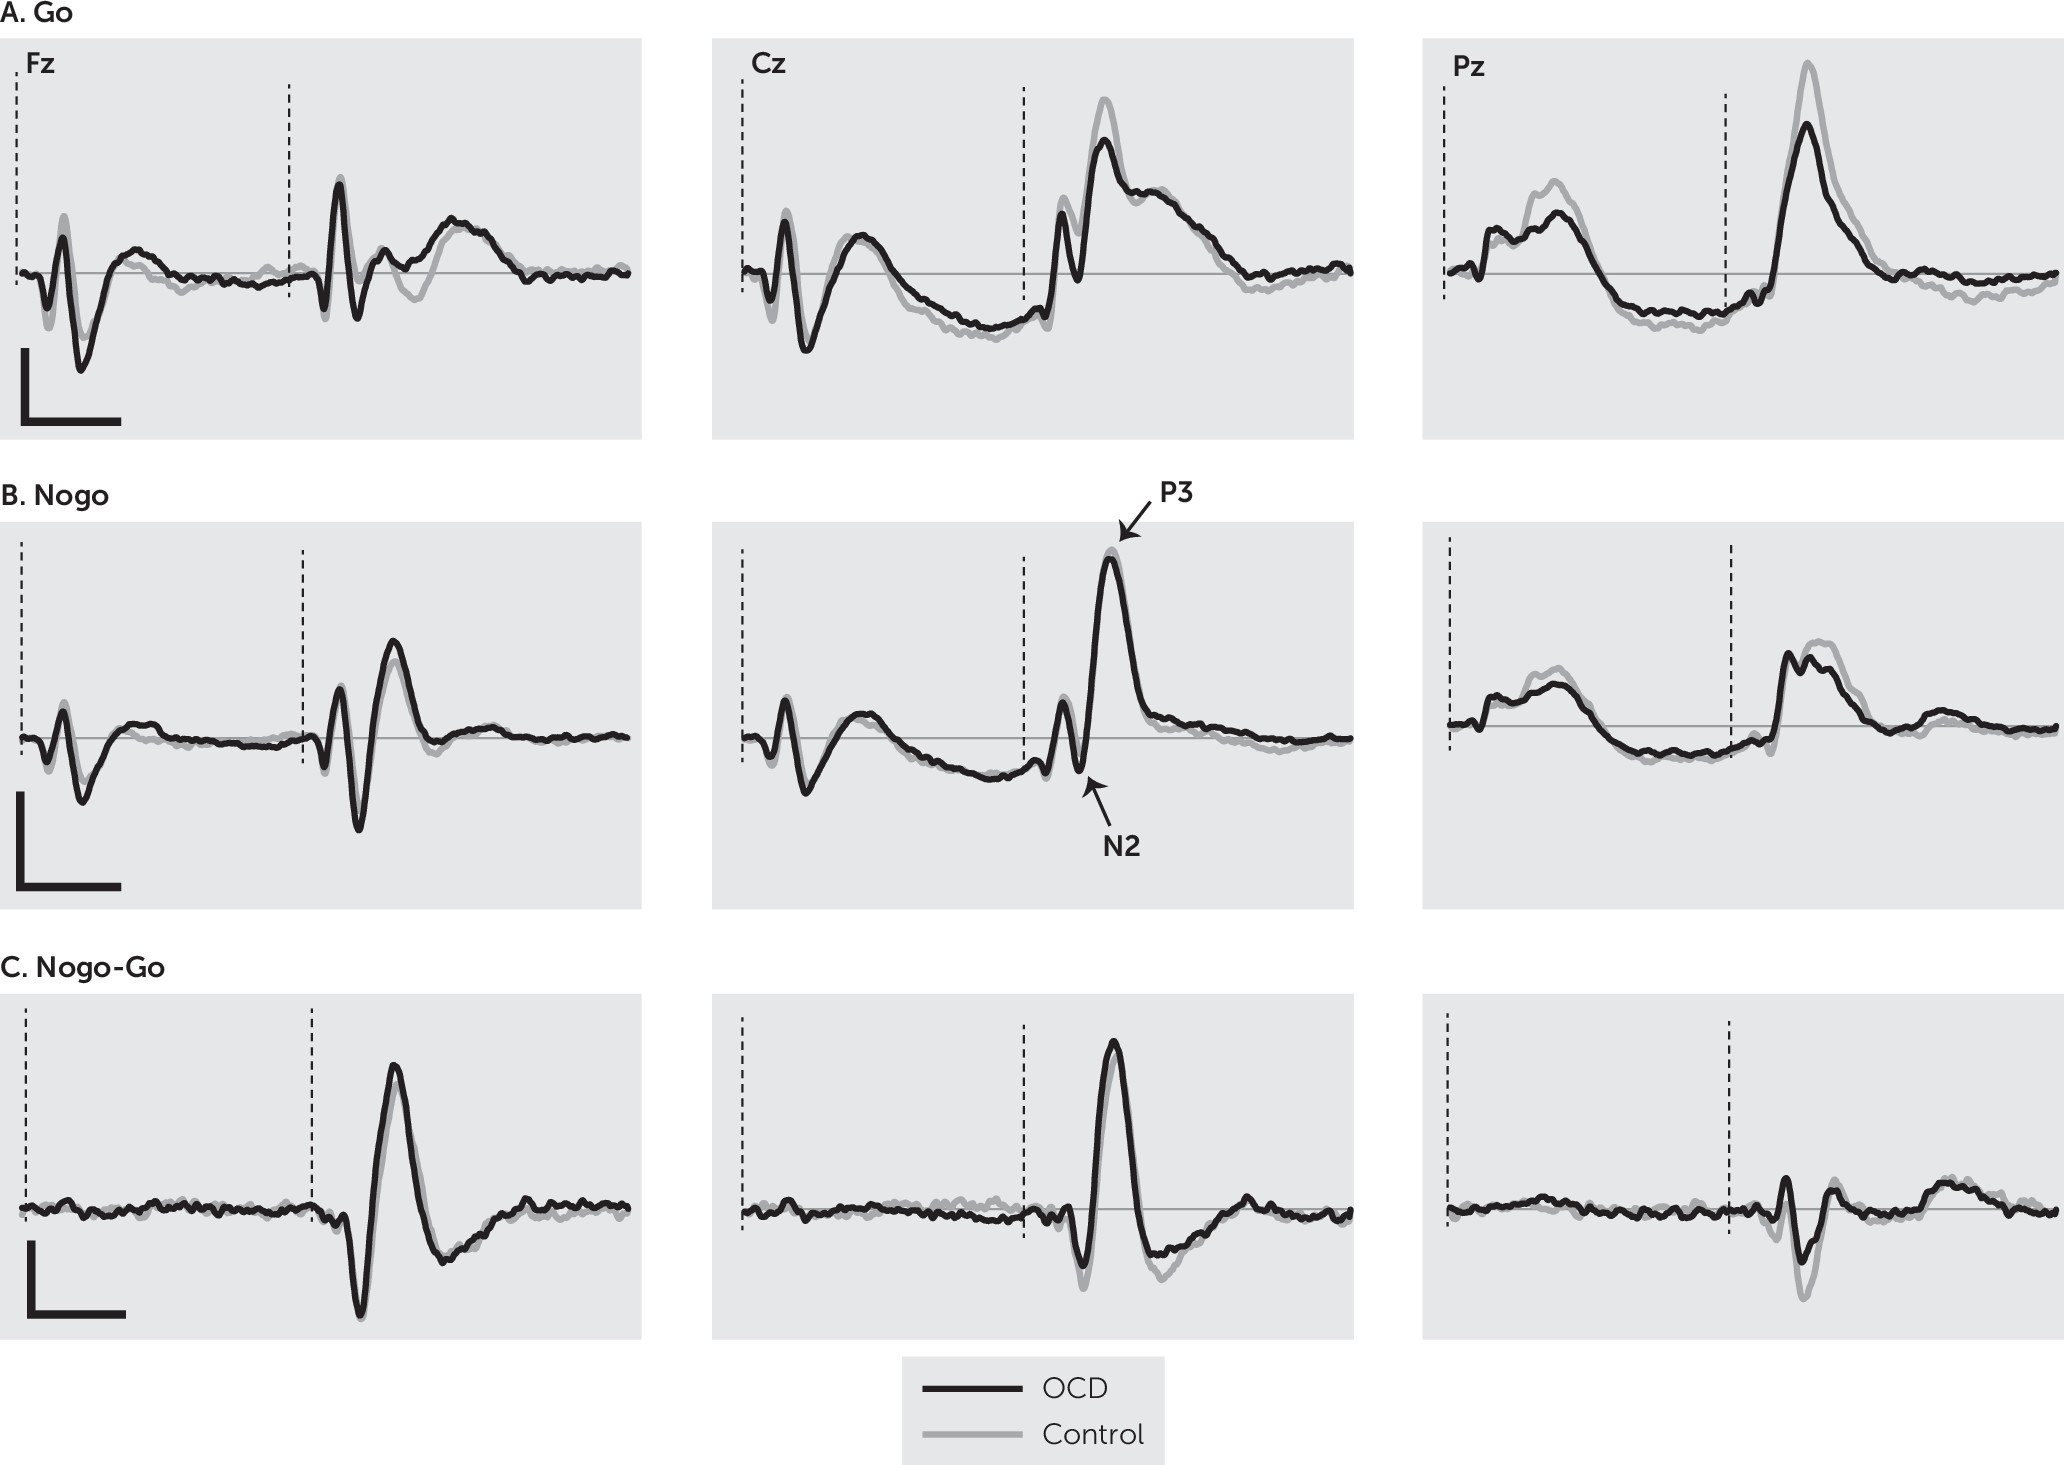
Grand averages of the ERP responses of the OCD and control groups are shown in
Figure 3. Analysis of N2 amplitude revealed a significant main effect of group (F=5.64, df=1, 99, p=0.019), with the control group having a larger overall N2 component when all sites were considered. There was also a significant main effect of condition (F=80.12, df=1, 99, p<0.001), with the nogo condition eliciting a greater N2 response. Finally, there was a significant main effect of site (F=134.91, df=2, 198, p<0.001); pairwise comparisons showed all sites differed significantly from each other (p<0.001; Fz >Cz >Pz). There was no negative response at Pz, indicating N2 was not found at this location when both groups were considered together. There was a significant site-by-group interaction (F=13.22, df=2, 198, p<0.001), with interaction contrasts revealing that N2 was no different between the two groups at Fz, both groups lacked a response at Pz, and the Cz response was significantly different due to no appreciable negative response being present in the OCD group. There was no significant group-by-condition interaction (F=0.13, df=1, 99, p=0.910). There was a significant site-by-condition interaction (F=26.62, df=2, 198, p<0.001) driven by the difference in go and nogo and the fact that N2 was not present at all sites. There was a significant group-by-site-by-condition interaction (F=21.88, df=2, 198, p<0.001). Examination of the contrasts revealed that this interaction arises because of the more localized N2 in OCD participants and the fact that N2 is greater at the frontal location in the nogo condition in comparison to the go condition.
N2 latency analysis focused on Fz because this was the only location in which it was present for both groups. It revealed a significant main effect of group (F=6.81, df=1, 99, p=0.01), with the OCD group having a significantly larger latency (i.e., a slower response). There was also a significant main effect for condition (F=10.79, df=1, 99, p=0.001), with larger latencies (i.e., slower responses) in the go condition. There was no significant interaction (F=1.06, df=1, 99, p=0.306). Finally, N2d analysis revealed that the OCD group had a larger difference between the two conditions than the control group (t=2.37, df=99, p=0.020).
Analysis of P3 amplitude found a significant main effect of group (F=8.43, df=1, 99, p=0.005), with the OCD group having a larger P3 amplitude. There was also a significant main effect of condition (F=113.42, df=1, 99, p<0.001), with the nogo condition eliciting a greater amplitude. Finally, there was a significant main effect of site (F=164.29, df=, 2, 198, p<0.001), with pairwise comparisons showing all sites differed significantly from each other (p<0.001; Cz >Pz >Fz). There was a significant site-by-group interaction (F=12.56, df=2, 198, p<0.001). To break this down, interaction contrasts were performed comparing P3 amplitude across the electrode sites. They revealed that controls had a larger P3 at Fz, whereas those with OCD had higher P3 amplitudes at Cz and Pz. There was also a site-by-condition interaction (F=149.16, df=2, 98, p<0.001). This was driven by the fact that in the go condition the responses at Cz and Pz were comparable and larger than at Fz, whereas in the nogo condition, responses were greatest at Cz and comparable and lower at Fz and Pz. Finally, there was a significant group-by-condition interaction (F=5.99, df=1, 99, p=0.016). Again, examination of the data and interaction contrasts revealed that this interaction was due to a greater P3 amplitude difference between the OCD and controls in the go condition compared with the nogo condition (p=0.016). There was no significant group-by-site-by-condition interaction (F=0.45, df=2, 198, p=0.64).
P3 latency analysis showed no significant main effect of group (F=0.00, df=1, 99, p=0.996), but there was a main effect of condition (F=7.57, df=1, 99, p=0.007), with larger P3 latencies (i.e., slower responses) in the go condition. There was also a main effect of site (F=78.39, df=1.54, 151.92, p<0.001). Contrasts revealed that the P3 response was slowest at Fz (p<0.001) and fastest at Pz (p<0.001). There was no significant group-by-site interaction (F=1.25, df=1.54, 151.92, p=0.283) or group-by-condition interaction (F=2.28, df=1, 99, p=0.135). However, there was a significant site-by-condition interaction (F=3.23, df=2, 198, p=0.042), with latencies in the go condition varying more with site than in the nogo condition. There was a significant group-by-site-by-condition interaction (F=3.23, df=1.76, 173.89, p=0.048). Examination of the interaction contrasts revealed that the difference in P3 latency between the go and nogo conditions across the OCD and control group differed between Fz and Pz (p=0.025) and Cz and Pz (p=0.041). P3d amplitude analysis revealed a significant main effect of group (F=5.99, df=1, 99, p=0.016), with larger responses in the control group. In addition, there was a main effect of site (F=159.38, df=2, 198, p<0.001), with pairwise comparisons showing significant differences between all electrode sites (p<0.001; Cz>Fz>Pz), indicating the greatest inhibition effect at central locations. There was no significant interaction (F=0.45, df=2, 198, p=0.640).
Differences Between Different Symptom Clusters
There was no significant difference in the mean reaction time for correct responses between three different clusters (symmetry: mean, 348.3 ms [SD=104.4]; forbidden thoughts: mean, 354.4 ms [SD=70.9]; cleaning: mean, 362.3 ms [SD=82.2]; F=0.536, df=3, 53, p=0.660). There were also no differences in terms of the number of omission errors (symmetry: mean, 2.6 [SD=2.7]; forbidden thoughts: mean, 2.0 [SD=2.4]; cleaning: mean, 1.6 [SD=1.7]; F=0.507, df=3, 53, p=0.679) or commission errors (symmetry: mean, 1.0 [SD=1.0]; forbidden thoughts: mean, 0.5 [SD=0.8]; cleaning: mean, 1.1 [SD=1.0]; F=1.650, df=3, 53, p=0.189).
For N2 amplitude and latency, there was no significant main effect of cluster (amplitude: F=0.023, df=2, 44, p=0.977; latency: F=0.898, df=2, 44, p=0.415). There was also no main effect of condition on latency (F=0.092, df=1, 44, p=0.763). However, mirroring the whole cohort analysis, there was a main effect of condition on amplitude (F=10.241, df=1, 44, p=0.003), with a greater response in the nogo condition. There were no significant condition-by-cluster interactions (amplitude F=1.78, df=2, 44, p=0.180; latency F=0.31, df=2, 44, p=0.733). There was no significant difference between the clusters for N2d amplitude (F=0.884, df=2, 44, p=0.420).
For P3 there was no significant main effect of cluster (amplitude: F=0.23, df=2, 44, p=0.799; latency: F=0.27, df=2, 44, p=0.767), condition (amplitude: F=0.04, df=1, 44, p=0.849; latency: F=0.13, df=1, 44, p=0.725), or site (amplitude: F=8.60, df=1, 44, p=0.427; latency: F=3.42, df=1.35, 59.18, p=0.057). There were also no significant interactions (amplitude: condition-by-cluster: F=0.31, df=2, 44, p=0.736; condition-by-site: F=0.19, df=2, 88, p=0.826; site-by-cluster: F=0.47, df=4, 88, p=0.760; condition-by-site-by-cluster: F=1.27, df=4, 88, p=0.287; latency condition-by-cluster: F=0.54, df=2, 44, p=0.586; condition-by-site: F=0.94, df=1.52, 66.77, p=0.374; site-by-cluster: F=1.27, df=4, 88, p=0.287; condition-by-site-by-cluster: F=0.75, df=3.04, 66.77, p=0.526). P3d showed no significant main effects (cluster: F=0.309, df=2, 44, p=0.736; site: F=0.192, df=2, 88, p=0.826) or interaction (cluster-by-site: F=0.97, df=4, 90, p=0.429).
Selected Effects of Comorbid Depression on Behavioral and ERP Responses
The average reaction time for correct responses on the go trials did not differ between those with (mean, 334.9 ms [SD=66.8]) and without comorbid depression (mean, 368.6 [SD=84.1]; t=1.491, df=46, p=0.143). There were also no differences in terms of the number of commission errors made (OCD group: mean, 1.1 [SD=2.6]; OCD with comorbid depression group: mean, 0.6 [SD=1.7]; t=1.622, df=46, p=0.101). However, there was a significant difference for omission errors (t=2.426, df=99, p=0.019), with those with OCD (mean, 2.8[SD=0.2]) making more omission errors that those with OCD and comorbid depression (mean, 1.3 [SD=0.3]).
For N2 amplitude and latency, there was no significant main effect of comorbidity (amplitude: F=2.70, df=1, 46, p=0.107; latency: F=0.061, df=1, 46, p=0.806). However, as with the other comparisons, there was a main effect of condition on amplitude (F=85.98, df=1, 46, p<0.001), with bigger N2 responses during the nogo condition. Again, mirroring the main OCD analysis compared with the control analysis, there was also a significant main effect of condition on latency (F=9.46, df=1, 46, p=0.004), with slower responses during the go conditions. There were no significant condition-by-comorbidity interactions (amplitude F=0.26, df=1, 46, p=0.613; latency F=1.78, df=1, 46, p=0.188). For N2d there was no significant difference for amplitude (F=2.19, df=1, 46, p=0.145) between those with and without comorbid depression.
For P3 amplitude there was no significant main effect of comorbidity (F=0.34, df=1, 46, p=0.562). As with the main comparison between those with and without OCD, there was a significant main effect of condition (F=29.48, df=1, 46, p<0.001), with bigger P3 responses during the nogo condition. There was a significant main effect of site (F=76.65, df=2, 92, p<0.001), with pairwise comparisons revealing that all sites differed significantly from each other (p<0.001; Cz>Pz>Fz) in the same way as the main group comparison. There was also a significant condition-by-site interaction (F=64.51, df=2, 92, p<0.001) following the same pattern as the main group analysis. There were no other significant interactions for P3 amplitude (condition-by-comorbidity: F=2.72, df=1, 46, p=0.106; site-by-comorbidity: F=0.28, df=2, 92, p=0.757; site-by-condition-by-comorbidity: F=1.25, df=2, 92, p=0291).
For P3 latency there was a significant main effect of comorbidity (F=6.02, df=1, 46, p=0.018), with those with comorbid depression demonstrating faster P3 responses. There was also a main effect of site (F=34.50, df=2, 92, p<0.001); pairwise comparisons revealed significant differences between Fz and Cz (p<0.001) and Fz and Pz (p<0.001), with the fastest P3 response at Pz and the slowest at Fz as found for the main analysis. There was no significant main effect of condition (F=1.95, df=1, 46, p=0.169), but there was a significant site-by-condition interaction (F=18.20, df=2, 92, p<0.001) in line with the results from hypothesis 1. There was a significant condition-by-comorbidity interaction (F=8.80, df=1, 46, p=0.005); during the go condition the OCD-only group had a slower P3 latency compared with the OCD with comorbid depression. However, during the nogo condition the groups demonstrated similar latencies for P3. There was no site-by-comorbidity interaction (F=1.88, df=2, 92, p=0.158). Finally, there was also a significant three-way interaction of condition-by-site-by-comorbidity (F=5.25, df=2, 92, p=0.007). Contrasts revealed that the group differences across the go and nogo differed across the Fz compared with Pz (p=0.004) and Cz compared with Pz (p=0.004).
For amplitude of P3d there was no significant main effect of comorbidity (F=2.72, df=1, 46, p=0.106), but there was a main effect of site (F=64.52, df=2, 92, p<0.001), where contrasts revealed that the inhibition effect of P3d was significantly different between all electrode sites (p<0.001; Cz > Fz >Pz). There was no significant site-by-comorbidity interaction (F=1.25, df=2, 92, p=0.291).
Discussion
The aim of this study was to investigate response inhibition in OCD using behavioral and ERP measures by examining distinct symptom clusters and the presence of comorbid depression. We set out to test three specific hypotheses: that there will be significant differences in response inhibition between control and OCD participants and OCD participants with different symptom clusters and comorbidity status.
Our OCD cohort consisted of participants identified as belonging to all three of the symptom clusters identified and accepted as part of OCD according to DSM-5 (
9,
12). Furthermore, as is commonly found, just over half of our participants reported comorbid depression (
13). Together, these features suggest we had an ecologically valid cohort. When this cohort was compared as a whole to healthy control participants, we found no differences in behavioral measures of response inhibition, as had been found previously (
23–
29). As would be expected for ERP components linked to response inhibition, both N2 and P3 showed greater amplitude in the nogo compared with the go condition. However, importantly for our first hypothesis, there were significant differences between OCD and control participants. In control participants the N2 component was present at both frontal and central locations, whereas within the OCD cohort, although comparable to controls frontally, N2 was absent at the central location, indicating a more localized response in OCD. This site-dependent effect has also been found by others (
26,
33) and may have contributed to previous inconsistent results where different electrode sites had been included in analysis or combined in different ways. The OCD participants also had a longer latency response. Previous research has suggested that the latency of the N2 component on this task reflects the speed of the monitoring of conflict; therefore, the increased latency may indicate that OCD influences the time course of inhibitory activity by slowing down the speed of response inhibition (
42). The slower latency would suggest reduced conflict monitoring in OCD, causing slower responding to the occurrence of conflicts. There is some evidence to support deficits in conflict monitoring in OCD (
43). However, the greater difference in N2 amplitude between the go and nogo conditions (N2d) found in the present study suggests overactive conflict monitoring in this cohort (
42,
44). The conflicting findings in the present study are not entirely unprecedented. A recent review has suggested that it is still not clear whether conflict monitoring is reliably altered in OCD (
45). Based on the findings presented here, there is evidence for slower but greater conflict monitoring. Interestingly, the results for P3 also show this mixed picture. We found that OCD participants exhibited a greater P3, implying greater response inhibition—a finding in line with previous research, which also suggests that the increased P3 reflects hyperactivity of the underlying neuronal networks between the orbitofrontal and anterior cingulate cortices and basal ganglia in OCD (
31). However, we also found a smaller P3d, indicative of reduced response inhibition (
44).
These differences in the control group compared with the OCD group, although interesting, are not new findings. The critical element of the current study was to investigate whether there were differences between clusters of those with and without comorbid depression, which may have confounded previous studies. The cluster analysis revealed no differences between the clusters on any measure of response inhibition. This indicates that cohorts with different symptom clusters have not contributed to the inconsistent results previously found. However, it is important to acknowledge that although the overall sample size for the OCD cohort in the present study is considerably larger than in many previous studies (
22,
24,
26,
33,
43,
46), the number of participants in each cluster was limited, especially for the symmetry cluster.
The comparison of OCD participants with and without comorbid depression revealed that those with OCD only made more errors of omission that those with comorbid depression. This was the only significant difference found in any behavioral measure for this study. Errors of omission can be considered an index of response execution, as opposed to errors of commission, which are an index of response inhibition. The increased level of omission errors in those with OCD only indicates a deficit in sustained attention (
47). Although the higher level of omission errors reported here contrasts with previous work where OCD (in the absence of comorbidities) was associated with a decrease in omission and an increase in commission errors (
22), it is in line with studies showing poorer sustained attention in OCD (
48,
49). However, this does not explain why the presence of comorbid depression would effectively protect against errors of omission. Previous research has shown errors of omission in depressed participants are comparable to control participants (
50), but there is no evidence to suggest those with comorbid depression somehow have improved sustained attention, although this may be something to consider in future research. Irrespective of this, the present data suggest that this particular deficit in OCD leading to increased errors of omission is not due to the presence of depression, as has been previously suggested (
51) and more recently discounted elsewhere (
52,
53).
There were no significant group differences for most ERP measures, but there was a reduced latency for P3 in those with comorbid depression. This is in line with previous studies of depression showing a short latency P3 in patients with depression relative to healthy controls (
54). P3 latency is believed to represent the speed of high-level cognitive activity (
55) such that a decrease in latency would suggest an increase in the speed of processing during the stimulus-evaluation and decision-making phases of response. These results, as with the findings on errors, imply that the presence of comorbid depression somehow supports improved task performance. It remains to be seen whether this arises because of effective compensation mechanisms or prior treatment of depression (because current treatment was matched in the present study), for example. Although the effect on response inhibition reported here is small, the prevalence of this comorbidity is high. Therefore, it can be argued that it is beneficial to differentiate comorbidity in analyses of response inhibition. Given these findings, it is possible that the presence of comorbid depression could have had a small effect on previous results in response inhibition studies with OCD participants. However, it is important to recognize the limitations of the work presented here. Although the sample size for the two groups was satisfactory, we did not independently assess depression.
As well as the limitations of sample size discussed above, it is important to note that this study used only one measure of response inhibition—the go/nogo task—and this is a limitation. Response inhibition is not a unitary trait. It involves three distinct elements: action postponement, action restraint, and action cancellation (
56). Different tasks access different subcomponents of response inhibition. The go/nogo task may contain response-selection and waiting elements but does not access information related to response cancellation (
57). One task that does access this is the stop-signal task (SST), but this in turn does not access the subcomponents available from the go/nogo task (
57). Perhaps unsurprisingly, given that they access different subcomponents of response inhibition, performance on these tasks relies on slightly different neural circuitry: the go/nogo task is highly dependent on the inferior frontal cortex and the SST more reliant on normal functioning of the dorso-medial striatum (
58–
60). Previous studies with OCD participants have revealed that there are changes in the inferior frontal cortex for regional blood flow (
61,
62), gray matter volume (
63), and activation during go/nogo tasks (
64). However, OCD is also linked to changes in cortico-striatal circuitry, albeit with most changes noted for the ventral rather than dorsal striatum (
65). Nonetheless, this means that using the SST may be a worthwhile future investigation for this clinical group. In addition to using only one task, we only included participants with comorbid depression because this has been shown to be the most common comorbidity, found in over 50% of individuals with OCD (
13). However, there are several other comorbid conditions that are relatively common in OCD, including social phobia (35.3%), generalized anxiety disorder (34.1%), and specific phobia (31.6%). Therefore, these additional comorbidities may also affect the measures we collected. Future studies should consider including a wider range of comorbidities.


