In 2008, Congress passed the Mental Health Parity and Addiction Equity Act (MHPAEA). The MHPAEA amended the Public Health Service Act, the Employee Retirement Income Security Act (ERISA), and the Internal Revenue Code. It was generally effective for plan years beginning on or after October 3, 2009. The parity act's interim final regulations went into effect in April 2010 and involved all health plan years beginning on or after July 1, 2010.
The MHPAEA states that if a group health plan includes general medical and surgical benefits and mental health and substance abuse benefits, the financial requirements and treatment limitations that apply to behavioral health benefits must be no more restrictive than the predominant financial requirements or treatment limitations that apply to substantially all medical and surgical benefits (
1). The MHPAEA also states that plans that include mental health and substance abuse benefits and provide out-of-network medical and surgical benefits must also provide out-of-network behavioral health benefits. In addition, standards for determining medical necessity and reasons for any denial of benefits relating to behavioral health must be disclosed upon request.
The MHPAEA applies to plans sponsored by private- and public-sector employers with more than 50 employees, including employers with self-insured as well as fully insured arrangements. The MHPAEA also applies to health insurance issuers who sell coverage to employers with more than 50 employees. The law allows employers who demonstrate a 2% increase in premiums in the first year after implementation—1% in subsequent years—to request an exemption from the parity requirements for the next year. The exemption procedures are described in regulations from the U.S. Department of Health and Human Services and the U.S. Departments of Labor and the Treasury (
2) that pertained to the Mental Health Parity Act of 1996. Under the formula used to determine whether an increase in premiums exceeds the threshold, the total costs under parity for the base year are divided by total costs minus claims for benefits and other administrative costs incurred during the base year that can be attributable to the parity requirements and compliance with the parity regulations. One is subtracted from this ratio to determine the percent increase that is due to parity. Under the formula, total costs include both behavioral health and general medical and surgical costs.
The law requires the U.S. Government Accountability Office to evaluate the effect of parity requirements within three years of the law's passage, including its costs, its effect on access, and its impact on the benefits offered by employers. A number of organizations have estimated the potential impact of parity laws on health care expenditures. As noted in a review by Barry and colleagues (
3), estimates of the impact of parity range from an increase in total premiums of 1% to 11%. Taking into account the effect of managed care, the Congressional Budget Office (CBO) estimated that the law would increase premiums for group health insurance by an average of about .4%. The CBO estimate did not account for the responses of health plans, employers, and workers to the higher premiums that might result from the law (
4). The methods that the CBO used are not published and organizations that provided other estimates of the effect of parity did not present details on the assumptions that they made regarding how behavioral health utilization changed as a result of parity (
5).
A primary goal of this study was to describe baseline spending for behavioral health services in order to be better prepared to anticipate, evaluate, and interpret spending and utilization shifts that occur after the MHPAEA is fully implemented. We provide information on utilization of and spending patterns related to behavioral health services from 2001 through 2009 by using claims data from approximately 100 large self-insured-employer group insurance plans. We also simulated the possible effects of future growth in behavioral health use and expenditures on total health care and illustrate how much the use of particular types of behavioral services would have to increase to have a significant effect on health care premiums. The results allow insight into the likely effects of the MHPAEA and help to interpret changes in behavioral health care spending after parity implementation.
Methods
Data sources
The analyses were based on data from the Thomson Reuters MarketScan Commercial Claims and Encounter Database, which comprises insurance claims data from group health plans sponsored by large self-insured employers (
6). MarketScan data are available from as long ago as the mid-1990s; however, the analysis presented here focused on the period from 2001 through 2009. The data are from all plans offered by approximately 100 employers each year, with some variation year to year in the number of contributing employers. The analytic file was limited to employers who provided complete inpatient, outpatient, and prescription drug claims across all services, including carved-out services. The number of employees and dependents captured in the databases was 5.2 million in 2001, 7.5 million in 2002, 9.1 million in 2003, 11.2 million in 2004, 13.3 million in 2005, 14.1 million in 2006, 15.0 million in 2007, 17.7 million in 2008, and 17.4 million in 2009. Separate analyses were also conducted on the 26 employers who contributed data continuously from 2003 through 2009 to determine whether the results were influenced by employers entering and exiting the database.
The analyses focused on paid claims, which included both the employers' and the employees' share of the services billed. Behavioral health expenditures were defined as insurance claims with a principal or primary psychiatric diagnosis (ICD-9-CM codes between 295 and 314). Mental health and substance abuse prescription drug claims filled at retail and mail order pharmacies were captured by using the Red Book classification system, which codes each prescription drug claim on the basis of its National Drug Code. Mental health medications were defined as medications in the following therapeutic classes: antidepressants, anxiolytics, antipsychotics, and stimulants. Substance abuse medications included disulfiram, naltrexone, acamprosate, and buprenorphine. Medications prescribed directly by health care providers, such as methadone or medications provided to inpatients, were included within the charges submitted by the provider and were not captured separately.
Data analyses
In the first set of analyses, we calculated the annual growth rate in total health care spending and in behavioral health spending from 2001 through 2009. We then estimated the contribution of behavioral health spending to growth in total spending for all diseases. The estimation was based on what the total health spending growth rate would have been had mental health spending remained at the same level as the prior year. Thus we could determine the proportion of spending growth that was driven by behavioral health before parity. These findings served as a baseline to examine the effect of parity.
We also conducted this calculation without including spending for psychiatric prescription medications. By excluding spending for such prescription drugs, the analysis highlighted the contribution of prescription drug spending to health spending trends (
7). It allowed us to focus separately on use of inpatient and outpatient services, which are the most directly affected by changes in benefits resulting from the MHPAEA. Prescription drug benefits are unlikely to be affected by the MHPAEA because benefits for psychiatric drugs are generally already provided on parity with benefits for drugs used to treat other types of conditions, given that generally pharmaceutical benefits are structured on the basis of generic and brand formulations and prices rather than differing by therapeutic category.
In the second set of analyses, we calculated the contribution of behavioral health expenditures to the overall health expenditures for 135 employers during 2008 and 2009. The distribution of the contribution and the number of employers experiencing increases in behavioral health expenditures that contributed more than 1% to all disease expenditures were determined. This analysis was designed to reveal how spending trends may vary across employers.
In the third set of analyses, we decomposed behavioral health spending trends into three categories—users per enrollee, or the percent of enrollees using behavioral health services; intensity of utilization, for example, the average number of outpatient visits or inpatient admissions per user; and average expenditure per unit of utilization, for example, spending per visit or hospital stay. Then we simulated how much behavioral health expenditures would need to change in order to increase the growth rate for total health expenditures by at least 1%.
In the final set of analyses, we examined the distribution of behavioral health inpatient days and outpatient visits over the population. We used this distribution to conduct additional simulations of how increases in utilization would affect overall health care expenditures excluding administrative costs.
Results
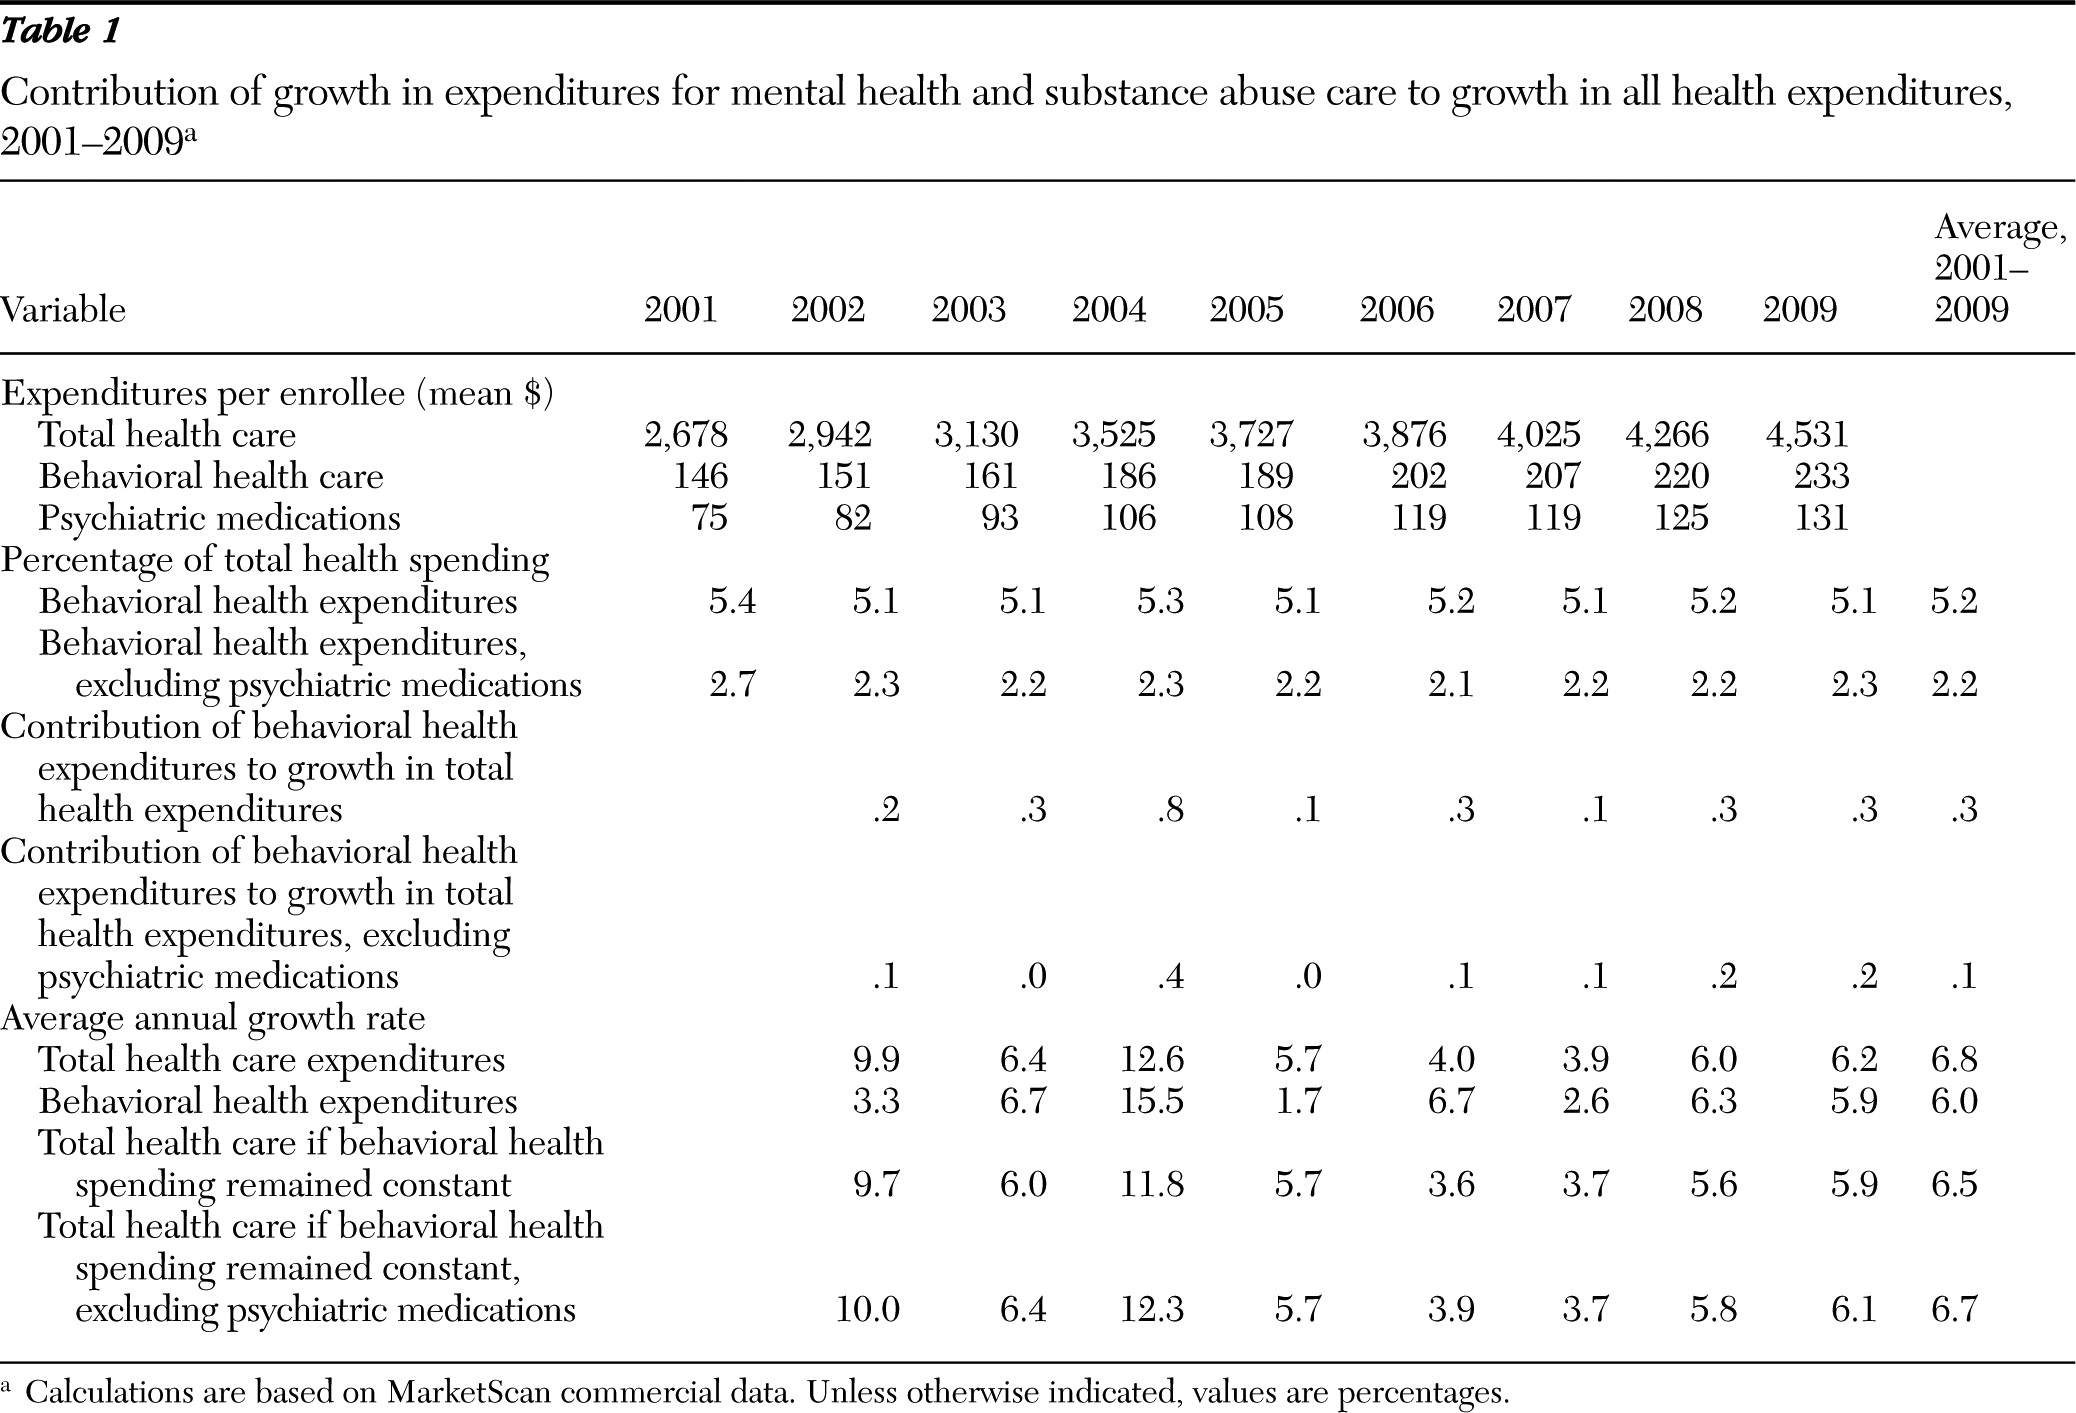
Table 1 presents average expenditures for total health care and behavioral health care per enrollee from 2001 through 2009. Mental health and substance abuse spending constituted 5.2% of all health expenditures, on average, across the nine years. Spending for behavioral health excluding expenditures for prescription psychiatric drugs constituted only 2.2% of all health expenditures. The percentage share of behavioral health spending is important to note because this factor, along with the rate of growth in behavioral health spending, determines its contribution to the growth rate in overall health care expenditures.
Table 1 also displays the average annual growth rates for total health care spending and behavioral health spending. There was a fair amount of year-to-year variability in both the total health care and behavioral health growth rates.
Table 1 also reveals the extent to which behavioral health expenditures contributed to the growth rate in total health care expenditures. For example, between 2001 and 2002, total health expenditures grew by 9.9% and behavioral health expenditures grew by 3.3%. Without any change to mental health expenditures, total health expenditures would have grown by 9.7%. Thus mental health and substance abuse expenditures contributed .2% to the growth in total health spending from 2001 to 2002. If prescription drugs were excluded from mental health and substance abuse expenditures and there was no change in behavioral health expenditures, the rate of growth in overall health spending would have been 10.0%, or .1% higher. Thus more than half of the contribution of behavioral health spending to total health spending growth was due to prescription drugs.
Table 1 also shows the contribution of behavioral health expenditures to growth rates in average annual total spending for health care. On average, behavioral health spending contributed .3% to the growth in total health care spending when prescription drugs were included and .1% when prescription drugs were excluded. Across all years, the largest increases in behavioral health expenditures occurred from 2003 through 2004. During 2004, behavioral health expenditures contributed .8% to the growth rate for total health care expenditures.
We also examined the contribution of mental health and substance abuse expenditures to total expenditures across each of the 135 employers who supplied data from 2008 and 2009 (data not shown in tables). Three (2%) employers experienced an increase in behavioral health expenditures per enrollee that resulted in an overall increase of more than 1% in growth in health care cost per enrollee. A total of 42 (32%) employers experienced an increase of .5% to 1%, and 89 (66%) experienced an increase of <.5%.
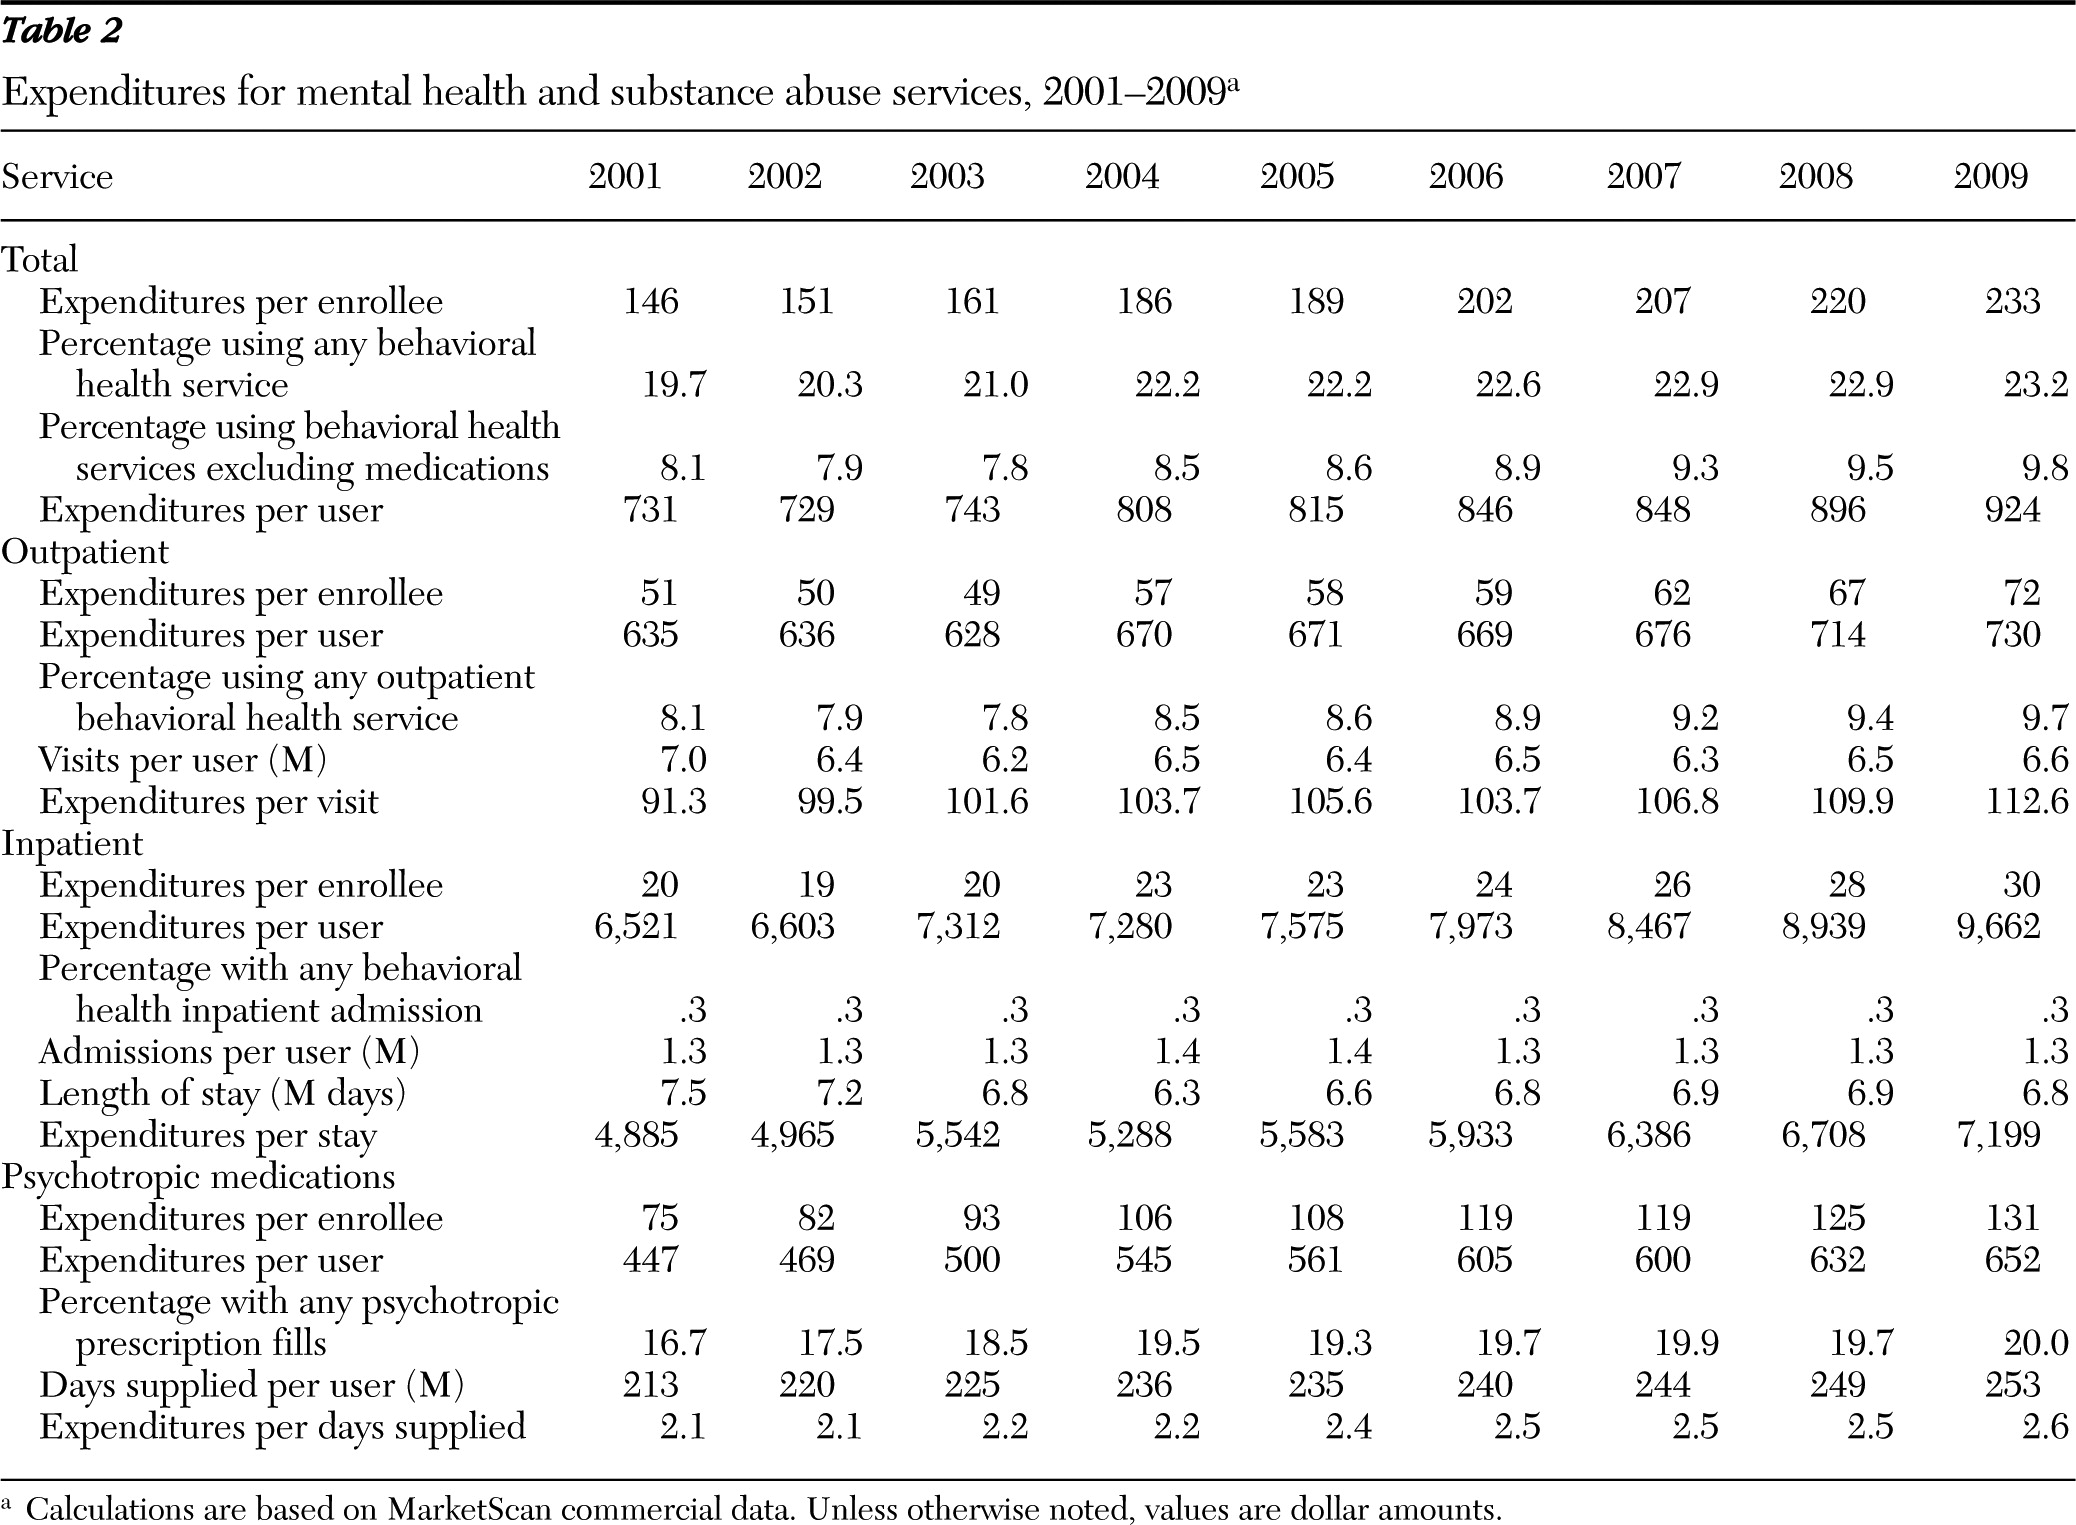
Table 2 reveals important information about the nature of behavioral health care utilization and expenditures. In 2009, 23.2% of all enrollees used a behavioral health service or received a psychotropic medication; yet as shown in
Table 1, behavioral health expenditures constituted only about 5% of total health expenditures during that year. This result is explained by the fact that utilization was concentrated on relatively low-cost pharmaceutical and outpatient services rather than on more expensive inpatient services. In 2009, 9.7% of enrollees used an outpatient behavioral health service, 20.0% used a psychiatric medication, and only .3% had a psychiatric inpatient admission.
Using the data in
Table 2, we simulated the amount that mental health and substance abuse expenditures, outpatient visits, or inpatient admissions would have to increase for the contribution of behavioral health expenditures to exceed 1% of baseline total health care expenditures, with all else being equal. The growth rate of behavioral health expenditures would have to be at least 20% higher than during its peak year of growth (15.5% in 2004) to make a contribution of 1% or more to health care costs. Alternatively, the growth rate for inpatient and outpatient behavioral health expenditures would need to have more than doubled (from 17% to over 40%) to yield at least a 1% increase in the total health costs.
We also examined behavioral health utilization patterns to understand how much utilization would have to increase to substantially raise claims expenditures after implementation of parity.
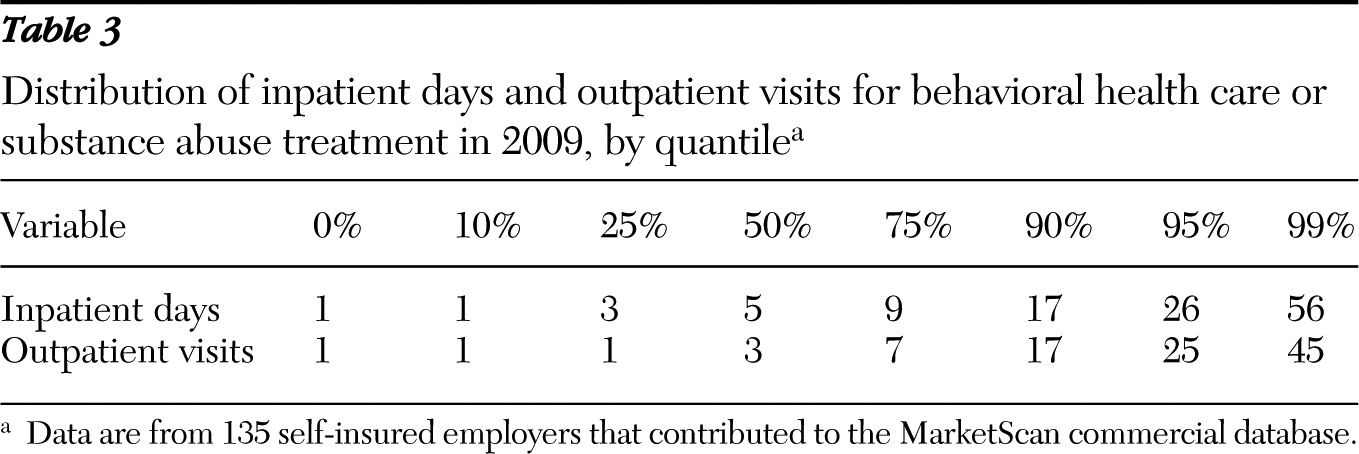
Table 3 presents the average number of inpatient days and outpatient visits for behavioral health per user per year by quantile segments for the 135 employers contributing to MarketScan in 2009. The median number of inpatient days per year among those who used behavioral health inpatient care was five, and the median number of outpatient visits among those who used behavioral health outpatient care was three. The bottom tenth percentile for inpatient days and the bottom 25th percentile for outpatient days were both one. One percent of those using any behavioral health inpatient services used 56 or more inpatient days per year, and 1% of those using any behavioral health visits used more than 45 visits per year. Only 10% of the sample used more than 17 inpatient days or outpatient visits per year.
If we examine these results in terms of the benefit limits of health plans, it is clear that a majority of users of behavioral health care are using services at a rate significantly below most health plan benefit limits. In 2008, only 34% of employer health benefits had caps on outpatient visits of 20 visits or fewer, and the remaining 66% of plans had visit limits at higher levels. Only 18% had limits of 20 inpatient days or fewer, and the remaining 82% had higher limits on inpatient days (
8). In 2006, the typical plan limited hospital days for substance abuse treatment to 34 per year and office visits for substance abuse to 34 per year (
9).
We used the information presented in
Table 3 to simulate the types of increases in utilization that would have to occur to significantly increase total health care costs. In most health plans, the lower boundary on limits to use of behavioral health services is 20 days of inpatient care or 20 outpatient visits. We adopted these limits as a conservative estimate of the constraints imposed by people's health insurance and assumed that only those people whose use had previously been constrained would increase their utilization under parity. We assumed that individuals who were using 17 or more inpatient days or outpatient visits per year would be the most likely to increase their utilization significantly under parity. We replaced the mean number of inpatient days or outpatient visits by individuals with at least 17 inpatients days or outpatient visits with the number of inpatient days (N=56) or outpatient visits (N=45) used by the top 1% of users. We then estimated how much expenditures would increase given these very large increases in the tail of the distribution. We found that a rise in utilization of this magnitude would increase the mean number of outpatient visits per user from 6.6 to 8.1 and increase the mean number of inpatient days per user from 6.8 to 11. This, in turn, would increase behavioral health expenditures by 12.0% and total expenditures by only .6%.
Discussion
Our results showed that before parity, mental health and substance abuse spending was, on average, a minor contributor to the overall rate of growth in health care expenditures. Across the nine years examined, behavioral health expenditures contributed .3%, on average, to the growth in total health expenditures per enrollee. When prescription drug expenditures were excluded, behavioral health contributed only .1% to the overall growth rate. This exclusion is important because prescription drugs are covered under the medical-surgical portion of health insurance plans and are not subject to the discriminatory use restrictions and high cost sharing typical of other mental health and substance abuse services. We also found, however, that the contribution varied across employers. In fact, a small portion of employers (about 2%) experienced an increase in the contribution of spending for behavioral care of more than 1% in 2008 and 2009, before implementation of parity.
Because the MHPAEA will eliminate limits on behavioral health inpatient days and outpatient visits, use of those services may increase. However, we observed that use by more than 90% of enrollees was well below the limit of 30 inpatient days or outpatient visits that characterize a typical preparity health insurance plan. Our simulations indicated that even large increases in utilization among individuals whose use was close to 20 inpatient days or 20 outpatient visits—conservative estimates of the service limits of insurance plans—would produce an impact of less than 1% of total health care expenditures.
These analyses must be understood in light of their limitations. The data were from a convenience sample of large, self-insured employers. To the extent that group plans differ from plans of large employers, the utilization and cost patterns may vary. However, self-insured plans are most likely to be affected by the MHPAEA because they were exempt from state-level parity legislation under ERISA. Thus understanding their utilization and cost patterns is of particular interest. Moreover, in the most recent years the size of the database was approximately 17 million, which represented 10% of the 170 million individuals in the United States with employer-based insurance coverage in 2009. This was an extremely large sample and important in its own right because of the large number of people it represented (
10).
These analyses cannot address the effect of lowering cost-sharing amounts for mental health and substance abuse benefits under the MHPAEA. According to a survey by Barry and colleagues (
11), in 2002 only 22% of covered workers had higher cost sharing for mental health benefits than for medical benefits. A survey by the U.S. Bureau of Labor Statistics found that in 2002, just 13% of employers in private industry had higher coinsurance for inpatient care for mental health than for inpatient medical care, and 10% had higher copayments for mental health than for medical care. Coinsurance rates and copayment rates for outpatient mental health care were higher than those for outpatient medical care among 22% and 21% of the employers, respectively. The lower copayments under the MHPAEA are likely to lead to higher utilization; however, as shown by this study, even large increases in utilization would be unlikely to raise total expenditures by more than 1%.
Prior evaluations of the impact of mental health parity regulations that were implemented in states and for federal employees have generally found limited effects on costs and utilization (
3), and often the findings were assumed to be attributed to the restraining influence of managed care programs. More recent estimates of the cost of parity, such as those by the CBO, projected that the effects of parity on costs and utilization will be even smaller than previously estimated because the estimates assumed that expanded use of managed care would have a dampening effect on behavioral health care costs. Our analyses made no assumptions about managed care, and we lacked information on the types of managed care protocols that were implemented in the employer plans that we studied. However, we found that even without assuming that managed care would constrain behavioral health care use and expenditures, the effects of the MHPAEA on total health care spending are likely to be limited.
Perceptions of the costs and benefits of the MHPAEA depend, in part, on the context in which they are considered. In the context of the overall U.S. behavioral health system, private spending constituted only about 40% of total behavioral health spending in 2005 (
12). Initially, the effects of the MHPAEA will be limited to private health plans, which were the focus of this analysis. However, the MHPAEA may also influence behavioral health utilization and spending patterns for health care plans established under the Medicaid expansion, the health insurance exchanges, and Medicaid managed-care plans, as mandated by the Affordable Care Act, that were not considered by this study. Moreover, although this analysis highlighted that the MHPAEA will have a limited effect on total health plan spending, the changes resulting from the MHPAEA may be significant for individuals who use behavioral health services. For example, evaluations of parity of mental health benefits under the Federal Employees Health Benefits Program found that although the effect of parity on utilization was limited, it did lower out-of-pocket expenditures for those who used mental health services (
13). Furthermore, parity should improve access and reduce the financial risk to those few individuals on the tail end of the utilization distribution who have serious behavioral illness and significant service needs.
Conclusions
In the coming years, changes that occur in behavioral health utilization and spending after the implementation of the MHPAEA will be evaluated. Analyses of baseline spending will allow researchers to place future studies in a larger context of existing utilization and cost patterns and trends. In general, we found that high anxiety about cost increases stemming from parity appears to be unfounded.
Acknowledgments and disclosures
Funding for this study was provided by the Substance Abuse and Mental Health Services Administration (SAMHSA) and the National Institute on Drug Abuse (NIDA). The views expressed do not necessarily reflect those of SAMHSA, NIDA, or the U.S. Department of Health and Human Services.
The authors report no competing interests.


