Full access
Articles
Published Online: 31 October 2014

Using Claims Data to Generate Clinical Flags Predicting Short-Term Risk of Continued Psychiatric Hospitalizations

Abstract

Objective:

As health information technology advances, efforts to use administrative data to inform real-time treatment planning for individuals are increasing, despite few empirical studies demonstrating that such administrative data predict subsequent clinical events. Medicaid claims for individuals with frequent psychiatric hospitalizations were examined to test how well patterns of service use predict subsequent high short-term risk of continued psychiatric hospitalizations.

Methods:

Medicaid claims files from New York and Pennsylvania were used to identify Medicaid recipients ages 18–64 with two or more inpatient psychiatric admissions during a target year ending March 31, 2009. Definitions from a quality-improvement initiative were used to identify patterns of inpatient and outpatient service use and prescription fills suggestive of clinical concerns. Generalized estimating equations and Markov models were applied to examine claims through March 2011, to see what patterns of service use were sufficiently predictive of additional hospitalizations to be clinically useful.

Results:

A total of 11,801 individuals in New York and 1,859 in Pennsylvania identified met the cohort definition. In both Pennsylvania and New York, multiple recent hospitalizations, but not failure to use outpatient services or failure to fill medication prescriptions, were significant predictors of high risk of continued frequent hospitalizations, with odds ratios greater than 4.0.

Conclusions:

Administrative data can be used to identify individuals at high risk of continued frequent hospitalizations. Payers and system administrators could use such information to authorize special services (such as mobile outreach) for such individuals to promote service engagement and prevent rapid rehospitalizations.
Mental health policy makers and services researchers routinely use administrative data to describe population characteristics and make inferences about service costs, quality, and treatment outcomes (16). Typically, these are retrospective efforts, sometimes with time lags of years between events and subsequent analytic findings. However, as health information technology advances, service providers have begun using administrative data to inform real-time treatment planning (7). This study used Medicaid data from New York and Pennsylvania to model the extent to which various “clinical flags” raised by timely use of claims data may be helpful in identifying individuals at unusual risk of poor outcomes, which might enable service providers to use this information to help avert psychiatric hospitalizations.
In any given year, a small subset of people with serious mental illness experiences multiple psychiatric hospitalizations. Many initiatives to improve client outcomes while reducing costs focus on these individuals—hence the appeal of using claims data to identify patterns of service use (and nonuse) to help identify individuals at imminent risk of hospitalization. If timely and of high enough predictive value to be clinically useful, such information could identify who should receive mobile outreach or other services to help avert another hospitalization. Services such as mobile outreach are expensive; hence timely use of administrative data may help in making wise triage decisions.
We used measures from the New York City Mental Health Care Monitoring Initiative (7,8), a quality improvement initiative for frequently hospitalized Medicaid-enrolled individuals with serious mental illness, to examine to what extent Medicaid claims data may be used to predict subsequent psychiatric hospitalizations. The initiative focused on individuals who had been hospitalized in a psychiatric unit at least twice in the prior year and whose pattern of service use continued to raise significant clinical concerns. The leadership committee for the initiative deemed the following patterns of service use as raising clinical concerns significant enough to warrant intervention: continued frequent psychiatric hospitalizations, defined as two or more psychiatric unit admissions within the previous four months (although many individuals are readmitted once within a six-month period, the leadership deemed two or more admissions to be a strong signal that current treatment needed improvement); lack of engagement in outpatient services, defined as no outpatient services for a mental health or substance use disorder in the previous four months; and not taking psychotropic medication, defined as no filling of a psychotropic medication prescription in the previous two months. Other mental health service systems, as well as accrediting bodies such as the National Committee for Quality Assurance, have begun using similar flags to identify clinical concerns, prompt interventions, or make inferences about quality of care.
With this study we examined the extent to which these clinical flags are predictive of continued psychiatric hospitalizations.

Methods

Medicaid claims data

We used New York and Pennsylvania Medicaid claims to identify Medicaid enrollees ages 18 to 64 with two or more inpatient psychiatric hospitalizations during the year ending March 31, 2009. We defined inpatient psychiatric hospitalizations as an inpatient claim with a mental health or substance use primary diagnosis. We tracked the cohort’s service utilization for 24 months to see what patterns of service use were sufficiently predictive of additional hospitalizations to be clinically useful.

Patterns of service use

We used the Mental Health Care Monitoring Initiative definitions to identify patterns of service use that were of clinical concern. These flags were two or more psychiatric admissions within the previous four months, no outpatient visit for a mental or substance use disorder in the previous four months, and no filling of a prescription of a psychotropic medication in the previous two months. These three flags were computed as of the first day of each of the 24 months from April 1, 2009, through March 1, 2011. We included individuals who had Medicaid eligibility for at least 90% of the previous four months as of the first day of the focal month. Institutional review boards of the New York State Psychiatric Institute and the University of Pittsburgh approved the project.

Statistical analysis

We conducted two complementary analyses (described below) to gain a more robust understanding of the extent to which the clinical flags are predictive of psychiatric hospitalizations. For each month, we calculated the presence and absence of each of the three flags for each individual. Analyses of Medicaid claims indicated that about 90% of mental health inpatient and outpatient services were paid within four months of the service date, with prescription claims typically generated at the time of fill.
Our overall goal was to better understand predictive factors in continued heavy use of inpatient services, operationalized as having two or more hospitalizations in the coming four months for individuals with serious mental illness and a history of recent hospitalizations. We used lagged (meaning previous) occurrences of the three flags individually to predict the value (present or absent) of a current hospitalization flag. We incorporated variables for patient characteristics, including age, gender, the number of inpatient admissions during the period that determined cohort membership, membership in a Medicaid managed care plan, and receipt of Supplemental Security Income (SSI), to control for their association in predicting continued hospitalizations.
We used generalized estimating equation (GEE) models to describe longitudinal trajectories over time. These models allowed us to examine what happened to the outcomes of interest during the period and to identify any trends in that time frame (such as a plateauing of the rate of hospitalization). Recognizing that some decision makers must emphasize data from the recent past and ask how those data predict the near-term future, we also ran Markov models. Markov modeling is useful for determining what current events (such as recent service use) predict future events (such as continued frequent hospitalizations) from a particular time point; compared with GEE analyses, which describe longitudinal trajectories over time, Markov models may provide more relevant information regarding factors that may affect the near-term future.
We used GEE models with a binomial distribution and logit link function to account for correlation of repeated observations over time (SAS PROC GENMOD). We used a GEE approach to examine longitudinal, population-averaged effects of prior flags in predicting future hospitalization flags. The most recent look-back period for a flag was four months prior to the four-month period containing the index hospitalization flag; the second most recent look-back period was the period four to eight months prior to the index hospitalization flag, and so on in lagged four-month intervals.
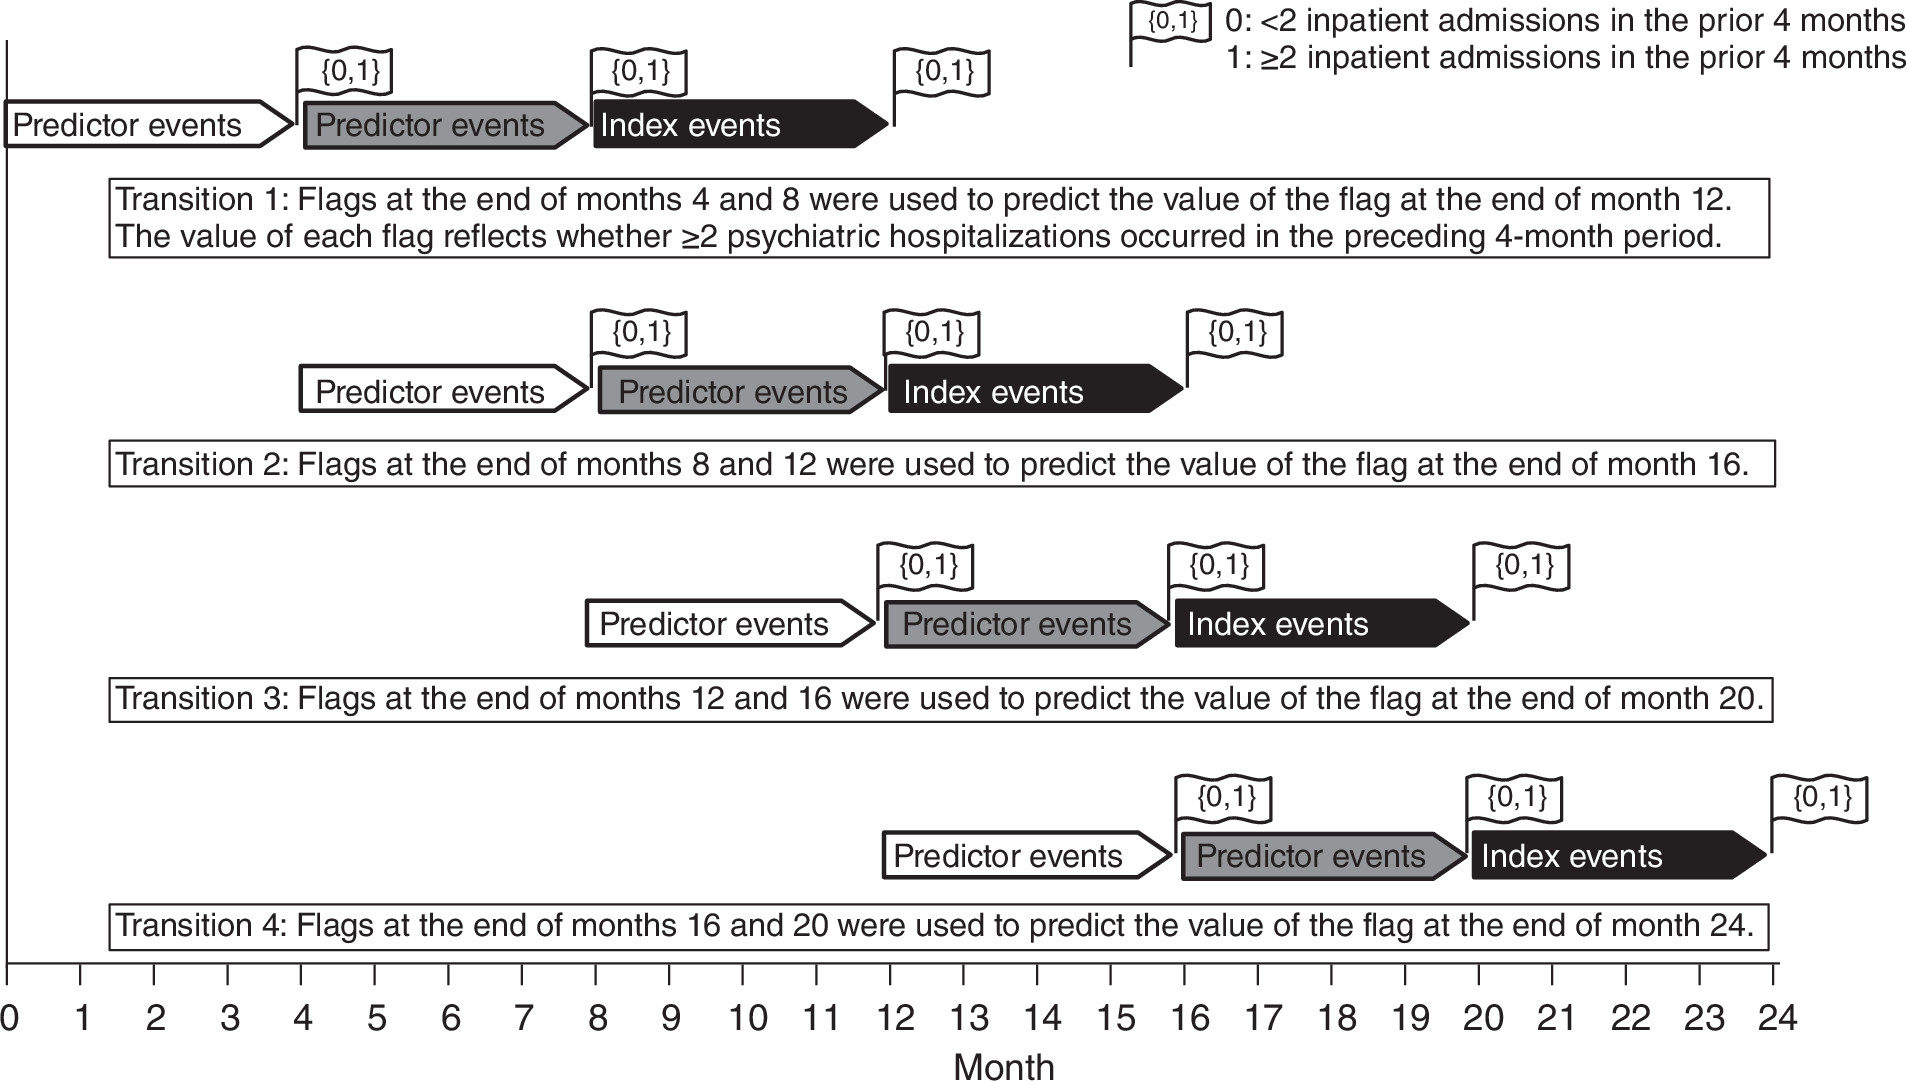
To determine the extent to which, at specific time points, prior flags predict future hospitalization flags, we applied Markov chain models (9) using logistic regression (SAS PROC LOGISTIC). At four-month intervals during the observation period (months 1–4, 5–8, 9–12, 13–16, and 17–20), we examined the extent to which the presence-of-hospitalization flag was predicted by previous flags, where the number of previous four-month intervals, N, defined the Markov model of order N.
In the Markov model of order 1, each four-month period defined a transition, where the flag value (0 or 1) at the end of the transition was used to predict the value of the hospitalization flag at the end of the next transition. In the Markov model of order 2, two successive four-month periods defined a transition (months 1–4 and 5–8 represented the first transition, and months 5–8 and 9–12 represented the second transition) (Figure 1). Values of the hospitalization flags at the end of two consecutive four-month periods were used to predict the value of the flag at the end of the next four-month period. Higher-order Markov models were constructed similarly.
Figure 1 Markov model for predicting future hospitalization by observing previous hospitalization of Medicaid enrollees during four-month intervals

Results

Descriptive statistics

The selection criteria resulted in 11,801 unique individuals in New York and 1,859 in Pennsylvania; of these, 11,150 New York individuals (94%) and 1,680 in Pennsylvania (90%) met the Medicaid eligibility criterion of at least 90% of days in each relevant look-back period. Individuals’ service utilization data were used to compute monthly rates of generating flags. Sixty percent of the New York cohort (N=6,690) and 54% of the Pennsylvania cohort (N=907) were men. The mean±SD age was 38±11.5 years in New York and 37±11.9 years in Pennsylvania. In New York, the racial mix was 42% white (N=4,683) and 37% black (N=4,125), with people of other races and ethnicities completing the cohort (21%, N=2,342). In Pennsylvania, the racial mix was 63% white (N=1,059) and 29% black (N=487), with people of other races and ethnicities completing the cohort (8%, N=134). Individuals in New York were classified as residing either in the greater New York City region (62% of the cohort, N=6,913) or elsewhere (38% of the cohort, N=4,237).
Individuals were assigned to one of five large diagnostic categories (mood disorders, schizophrenia disorders, alcohol dependence disorders, drug dependence disorders, and other mental or substance use disorders) based on the most common primary diagnoses for hospitalizations determining the analytic cohort. In case of ties, we assigned individuals the most recent of those diagnoses. In New York, schizophrenia disorders (31%, N=3,457), mood disorders (30%, N=3,345), and other mental or substance use disorders (19%, N=2,119) were most common. In Pennsylvania, mood disorders (62%, N=1,042), schizophrenia disorders (21%, N=353), and other mental or substance use disorder diagnoses (13%, N=218) were most common.
Table 1 shows the percentage of individuals for each month with patterns of service use that generated flags suggesting clinical concerns. Because no new members were added to this cohort, the number of those meeting the 90% Medicaid eligibility criteria decreased over time (Table 1).
Table 1 Service utilization based on Medicaid eligibility in New York and Pennsylvaniaa
Observation monthLook-back periodDate of service count calculationHad 90% Medicaid eligibility during look-back periodUsed acute psychiatric inpatient care (%)No outpatient visits (%)No psychotropic drug fill (%)b
StartEndN.Y.Penn.N.Y.Penn.N.Y.Penn.N.Y.Penn.
1Dec. 1, 2008March 31, 2009April 1, 200910,2051,68028.36.923.620.236.424.6
2Jan. 1, 2009April 30, 2009May 1, 200910,1451,61924.96.323.821.936.325.3
3Feb. 1, 2009May 31, 2009June 1, 200910,0001,56720.85.425.223.637.427.2
4March 1, 2009June 30, 2009July 1, 20099,8841,51417.75.726.124.937.827.3
5April 1, 2009July 31, 2009Aug. 1, 20099,7301,48414.24.327.427.938.227.4
6May 1, 2009Aug. 31, 2009Sept. 1, 20099,6041,44913.43.428.228.838.229.3
7June 1, 2009Sept. 30, 2009Oct. 1, 20099,5111,42013.03.028.628.539.028.7
8July 1, 2009Oct. 31, 2009Nov. 1, 20099,4051,38612.53.229.130.538.028.4
9Aug. 1, 2009Nov. 30, 2009Dec. 1, 20099,3131,37511.93.229.430.837.729.5
10Sept. 1, 2009Dec. 31, 2009Jan. 1, 20109,2061,36111.32.529.632.038.030.4
11Oct. 1, 2009Jan. 31, 2010Feb. 1, 20109,1721,35310.92.729.132.637.230.7
12Nov. 1, 2009Feb. 28, 2010March 1, 20109,1111,33010.02.330.233.437.432.2
13Dec. 1, 2009March 31, 2010April 1, 20109,0481,32310.32.929.333.136.831.1
14Jan. 1, 2010April 30, 2010May 1, 20109,0191,30210.32.829.032.935.431.3
15Feb. 1, 2010May 31, 2010June 1, 20108,9851,29510.12.829.332.336.434.4
16March 1, 2010June 30, 2010July 1, 20108,9571,29210.82.628.930.336.434.2
17April 1, 2010July 31, 2010Aug. 1, 20108,9261,29810.22.829.132.436.734.1
18May 1, 2010Aug. 31, 2010Sept. 1, 20108,8561,29810.12.828.833.636.135.7
19June 1, 2010Sept. 30, 2010Oct. 1, 20108,8111,28610.32.928.532.636.236.0
20July 1, 2010Oct. 31, 2010Nov. 1, 20108,7791,28110.03.028.833.335.737.4
21Aug. 1, 2010Nov. 30, 2010Dec. 1, 20108,7441,2749.52.129.834.036.237.2
22Sept. 1, 2010Dec. 31, 2010Jan. 1, 20118,7031,2679.22.129.434.636.137.8
23Oct. 1, 2010Jan. 31, 2011Feb. 1, 20118,6581,2529.02.829.634.635.039.5
24Nov. 1, 2010Feb. 28, 2011March 1, 20118,6511,2458.42.729.935.335.940.3
a
Initial cohort: New York, N=11,801; Pennsylvania, N=1,859
b
The look-back period for filling a prescription was the previous 2 months.
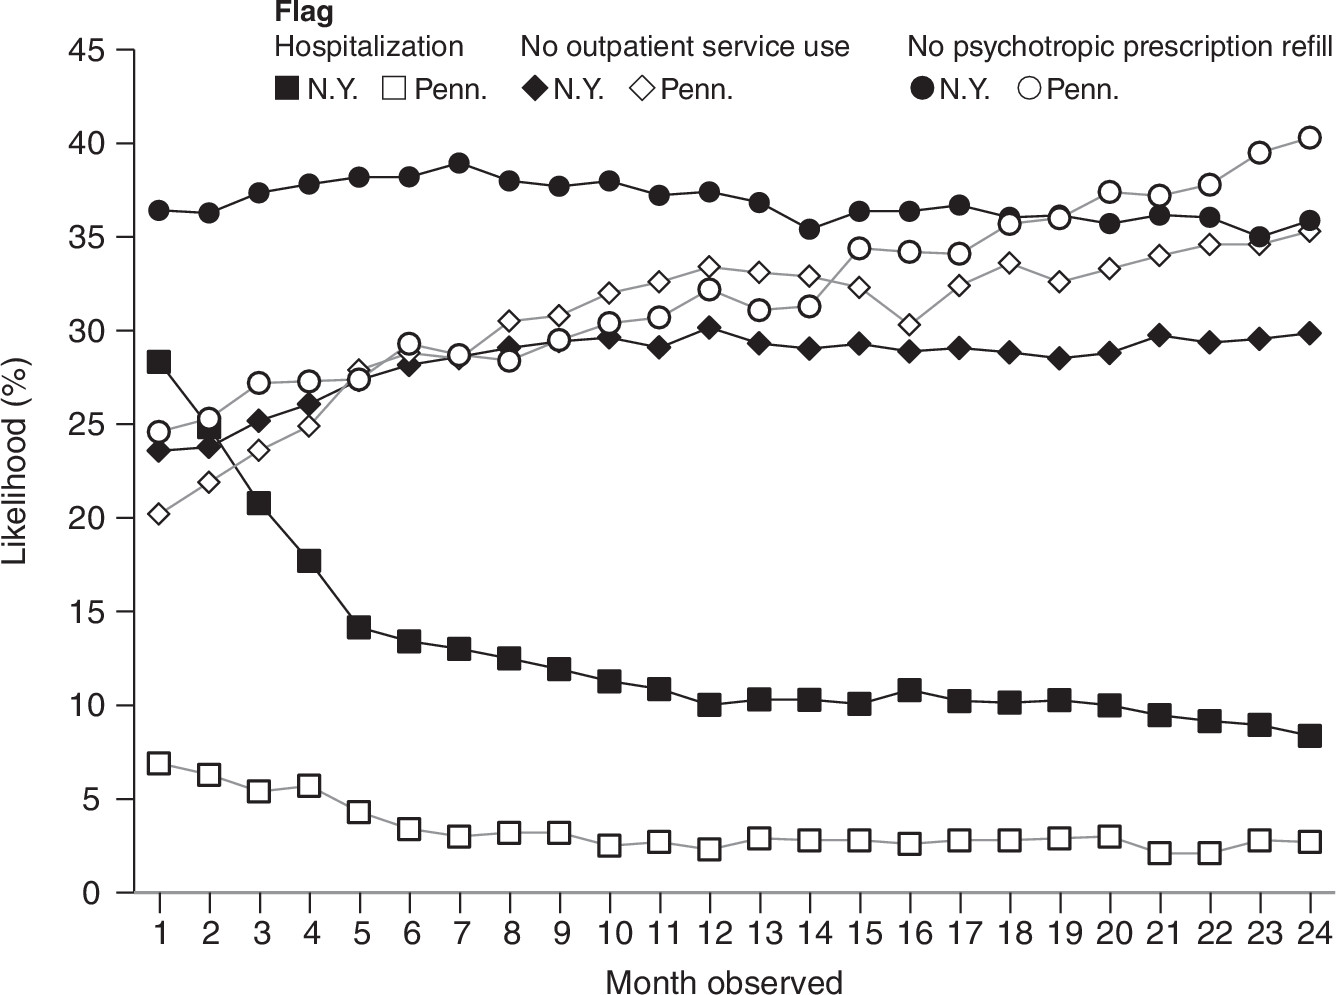
Over 24 months, the likelihood of generating hospitalization flags fell from 28% to 8% in New York and from 7% to 3% in Pennsylvania (Figure 2), indicating that persons remaining in the cohort experienced ever fewer psychiatric hospitalizations over time. In contrast, rates of generating flags indicating no outpatient service use increased from 24% to 30% in New York and from 20% to 35% in Pennsylvania. Rates of generating flags indicating no filling of a prescription for a psychotropic medication in the previous two months fluctuated around 37% in New York over time and increased from approximately 25% to 40% in Pennsylvania.
Figure 2 Likelihood that prior hospitalization, lack of service use, and lack of prescription fill led to future hospitalization of Medicaid enrollees over 24 months

Predicting hospitalization from previous flags

When the GEE model “looked back” from the index interval, the value of the flag for the most recent lagged interval (in other words, the value of a flag for the interval with a lag of 1, representing two or more hospitalizations in months 1–4 prior to the index interval) was a significant predictor of the presence of a hospitalization flag in the index interval (New York, odds ratio [OR]=4.6, p<.001; Pennsylvania, OR=8.7, p<.001). In New York but not in Pennsylvania, values of the two prior hospitalization flags also each significantly predicted future hospitalization flags (flag lagged four months, OR=4.7, p<.001, flag lagged eight months, OR=2.2, p<.001), and this pattern held for three, four, and five lagged intervals. Number of inpatient admissions during the period determining membership in the cohort was a significant predictor of future inpatient flags in all models (in New York, OR=1.2, p<.001; in Pennsylvania, OR=1.3, p<.001, each with one lagged hospitalization flag).
In New York, Markov models 1–4 consistently showed that generation of hospitalization flags in the most recent prior interval was the strongest predictor of subsequent hospitalization flags, with diminishing associations for relatively distant intervals. Markov model 1 showed that the odds that an individual who had generated a hospitalization flag at month 17 also would generate a hospitalization flag at month 21 was 7.2 (p<.001) times that of an individual who had not generated a hospitalization flag. In Pennsylvania the OR was 8.5—similarly high (p<.001). At earlier transition periods, the association was attenuated. Compared with individuals who had not generated hospitalization flags at the end of transition period 1 (months 1–4), individuals in New York who generated hospitalization flags were 1.8 times as likely to generate additional hospitalization flags at the end of transition period 2 (months 5–8) (p<.001). In Pennsylvania, such individuals were 1.7 times as likely, but this difference was not significant.
When we included age, region of residence, gender, race, managed care status, diagnosis (New York only), and SSI status in the Markov logistic regression analyses, age reached statistical significance in later transitions, but its OR ranged only from .98 to .99. In the Markov models for the New York sample, region was consistently significant, with individuals in New York City showing greater likelihood of generating hospitalization flags over time; ORs were modest (in Markov model 1, transition 1, for example, region OR=1.20, p=.006).
Using the algorithm described above to assign an individual to a diagnostic category, we examined the utility of diagnosis in predicting inpatient hospitalization flags in New York. Using mood disorders as the referent, GEE models indicated that individuals with a substance use disorder were less likely to generate a hospitalization flag (OR=.62, p<.001), and individuals with schizophrenia were more likely to generate a hospitalization flag (OR=1.18, p=.009). Markov models yielded similar results.
To test the predictive models’ precision, we calculated the area under the receiver operating curve (AUC) for each GEE and Markov model and computed sensitivity, specificity, and predictive values. The AUC ranged from .73 to .78 for the GEE models and from .70 to .78 for the Markov models for one to five predictor intervals, respectively. The AUC did not change significantly with the addition of diagnosis to the GEE or Markov model.

Predicting hospitalization from other flags

The presence of previous outpatient flags was associated with a lower likelihood of generating a hospitalization flag (OR=.62, p<.001). Similarly, the presence of previous medication flags also was associated with a lower likelihood of generating a hospitalization flag, also with an OR suggesting little clinical utility for this information (OR=.94, p<.001).

Discussion

States and other entities that contract with managed care organizations increasingly build claims-based performance measures into contracts to provide incentives to engage people in services posthospitalization and prevent rapid rehospitalizations. Our analyses demonstrated that claims data on prior psychiatric hospitalizations can identify Medicaid enrollees at unusual risk of continued frequent behavioral health hospitalizations; as few as four months of recent claims data were sufficient for this purpose. Managed behavioral health organizations and system administrators could use such information to authorize special services (including mobile outreach and assertive community treatment teams). Studies examining claims for all types of hospitalizations similarly have shown that prior inpatient admissions are among the strongest predictors of future admissions (1012).
We found that recent hospitalizations are a greater predictor than more distant hospitalizations of continued frequent hospitalizations, suggesting that a triage policy, whereby individuals with multiple recent hospitalizations receive additional supports in order to avert a cascade of subsequent hospitalizations, may be beneficial. Even recent hospitalizations are only fair predictors of continued frequent hospitalizations and should be considered more as cautionary flags that a person is at unusual risk for further hospitalizations rather than as predictors of the certainty of continued frequent hospitalizations. Our analyses indicate that having access to more than one year’s worth of data yielded modest, if any, increases in predictive power of who was at greatest risk for continued frequent hospitalizations. Hence, efforts to identify individuals eligible for special services to avert hospitalizations would do well to weight the recent past most heavily and to have such special services in place at the time of discharge.
The finding that lack of participation in outpatient services and lack of filling psychotropic medication prescriptions predicted a modest decrease in the likelihood of continued frequent hospitalizations was surprising. We speculate that the project’s bar for “participating in outpatient services” was set very low (at least one service in the previous four months) and therefore failed to identify individuals participating sufficiently in outpatient services for these services to have a protective effect. This finding also may be an indicator that the individuals who were the most ill received services. Alternatively, not using services may indicate that someone is doing well. Over one-third of the cohort did not fill a prescription for a psychotropic medication in the prior two months, and individuals who met this criterion were slightly less likely than those who did fill a prescription to continue to be hospitalized frequently (OR=.94).
The study had some noteworthy limitations. Analytic files indicated whether outpatient services and medication fills occurred during four-month look-back periods but not the exact date of these services, thereby introducing a confounding factor that would not have occurred if we could have based models on precise dates. The care monitoring initiative focused on individuals with frequent psychiatric hospitalizations, and we do not know how findings would generalize to frequent hospitalizations for other populations. We used data from states with relatively generous Medicaid mental health benefits and robust mental health provider systems and don’t know how our findings would generalize to other regions or systems. Medicaid claims data provide information neither about non-Medicaid reimbursed services that individuals may have been receiving nor about the quality or appropriateness of services provided.
In this initiative, the bar for what constituted participating in outpatient services was set very low, whereas the bar for generating a hospitalization flag (two or more admissions for a mental or substance use disorder within the previous four months) may have been set relatively high. Setting the outpatient bar higher and the hospitalization bar lower would have increased the numbers of individuals in the care monitoring initiative dramatically, overwhelming the system’s ability to provide enhanced outreach services (8). Indeed, in part because of the large number of individuals generating one or more flags, in its subsequent refinement of the care monitoring initiative, New York State elected to focus on the subset of individuals who continued to be hospitalized frequently and who had received fewer than four outpatient services in six months. Such a shift acknowledges that if someone is not using outpatient services, is not filling medication prescriptions, and is staying out of the hospital, perhaps systems’ resources should focus elsewhere even if that individual had multiple hospitalizations in the past year. Simultaneously, further research is needed to understand how the presence (and absence) of outpatient services and psychotropic medication claims can inform efforts to target services to individuals with mental illnesses and at greater risk of negative outcomes, such as hospitalization.

Conclusions

Administrative data can identify individuals at high risk of continued frequent hospitalizations. Our findings suggest emphasizing recent service-use data to identify individuals most in need of services to help break a cycle of continuing rapid psychiatric readmissions. Our findings also have implications for designing algorithms to identify individuals eligible for specialized services and serve as a cautionary tale regarding attempts to determine service eligibility based solely on past service use.

Acknowledgments and disclosures

This work was supported in part by grant 5R01MH086236 from the National Institute of Mental Health and the New York State Office of Mental Health. Carlos T. Jackson, Ph.D., was one of the original co-principal investigators on this project. The authors thank Donald Hedeker, Ph.D., for statistical consultation.
The authors report no competing interests.

References

1.
Gilmer TP, Dolder CR, Lacro JP, et al: Adherence to treatment with antipsychotic medication and health care costs among Medicaid beneficiaries with schizophrenia. American Journal of Psychiatry 161:692–699, 2004
2.
Fischer MA, Vogeli C, Stedman MR, et al: Uptake of electronic prescribing in community-based practices. Journal of General Internal Medicine 23:358–363, 2008
3.
Riley GF: Administrative and claims records as sources of health care cost data. Medical Care 47(suppl 1):S51–S55, 2009
4.
Frayne SM, Berg E, Holmes TH, et al: Mental illness–related disparities in length of stay: algorithm choice influences results. Journal of Rehabilitation Research and Development 47:709–718, 2010
5.
Marcus SC, Bridge JA, Olfson M: Payment source and emergency management of deliberate self-harm. American Journal of Public Health 102:1145–1153, 2012
6.
Olfson M, Marcus SC, Bridge JA: Emergency treatment of deliberate self-harm. Archives of General Psychiatry 69:80–88, 2012
7.
Smith TE, Appel A, Donahue SA, et al: Public-academic partnerships: using Medicaid claims data to identify service gaps for high-need clients: the NYC Mental Health Care Monitoring Initiative. Psychiatric Services 62:9–11, 2011
8.
Smith TE, Appel A, Donahue SA, et al: Determining engagement in services for high-need individuals with serious mental illness. Administration and Policy in Mental Health and Mental Health Services Research (Epub ahead of print, May 1, 2013)
9.
Diggle PJ, Heagerty P, Liang K, et al: Analysis of Longitudinal Data, 2nd ed. New York, Oxford University Press, 2002
10.
Raven MC, Doran KM, Kostrowski S, et al: An intervention to improve care and reduce costs for high-risk patients with frequent hospital admissions: a pilot study. BioMed Central Health Services Research 11:270, 2011
11.
Billings J, Mijanovich T: Improving the management of care for high-cost Medicaid patients. Health Affairs (Project Hope) 26:1643–1654, 2007
12.
Billings J, Dixon J, Mijanovich T, et al: Case finding for patients at risk of readmission to hospital: development of algorithm to identify high risk patients. British Medical Journal 333:327, 2006

Information & Authors

Information

Published In

Go to Psychiatric Services

Cover: Woman Sitting on Couch Looking at Picture, by Alice Barber Stephens. Library of Congress, Prints and Photographs Division, DLC/PP-1933:0012.

Psychiatric Services
Pages: 1341 - 1346
PubMed: 25022360

History

Published ahead of print: 31 October 2014
Published online: 1 November 2014
Published in print: November 01, 2014

Authors

Details

Bradley D. Stein, M.D., Ph.D.
Dr. Stein and Mr. Sorbero are with RAND Corporation, Pittsburgh (e-mail: [email protected]). Dr. Stein is also with the Department of Psychiatry, University of Pittsburgh. Dr. Pangilinan, Ms. Donahue, and Ms. Xu are with the Office of Performance Measurement and Evaluation, New York State Office of Mental Health, Albany. Dr. Marcus, Dr. Smith, and Dr. Essock are with the Department of Psychiatry, Columbia University College of Physicians and Surgeons, New York City. Dr. Marcus is also with the Department of Biostatistics, Columbia University Mailman School of Public Health. Dr. Smith and Dr. Essock are also with Mental Health Services and Policy Research, New York State Psychiatric Institute, New York City.
Maria Pangilinan, M.S., Ph.D.
Dr. Stein and Mr. Sorbero are with RAND Corporation, Pittsburgh (e-mail: [email protected]). Dr. Stein is also with the Department of Psychiatry, University of Pittsburgh. Dr. Pangilinan, Ms. Donahue, and Ms. Xu are with the Office of Performance Measurement and Evaluation, New York State Office of Mental Health, Albany. Dr. Marcus, Dr. Smith, and Dr. Essock are with the Department of Psychiatry, Columbia University College of Physicians and Surgeons, New York City. Dr. Marcus is also with the Department of Biostatistics, Columbia University Mailman School of Public Health. Dr. Smith and Dr. Essock are also with Mental Health Services and Policy Research, New York State Psychiatric Institute, New York City.
Mark J. Sorbero, M.S.
Dr. Stein and Mr. Sorbero are with RAND Corporation, Pittsburgh (e-mail: [email protected]). Dr. Stein is also with the Department of Psychiatry, University of Pittsburgh. Dr. Pangilinan, Ms. Donahue, and Ms. Xu are with the Office of Performance Measurement and Evaluation, New York State Office of Mental Health, Albany. Dr. Marcus, Dr. Smith, and Dr. Essock are with the Department of Psychiatry, Columbia University College of Physicians and Surgeons, New York City. Dr. Marcus is also with the Department of Biostatistics, Columbia University Mailman School of Public Health. Dr. Smith and Dr. Essock are also with Mental Health Services and Policy Research, New York State Psychiatric Institute, New York City.
Sue M. Marcus, Ph.D.
Dr. Stein and Mr. Sorbero are with RAND Corporation, Pittsburgh (e-mail: [email protected]). Dr. Stein is also with the Department of Psychiatry, University of Pittsburgh. Dr. Pangilinan, Ms. Donahue, and Ms. Xu are with the Office of Performance Measurement and Evaluation, New York State Office of Mental Health, Albany. Dr. Marcus, Dr. Smith, and Dr. Essock are with the Department of Psychiatry, Columbia University College of Physicians and Surgeons, New York City. Dr. Marcus is also with the Department of Biostatistics, Columbia University Mailman School of Public Health. Dr. Smith and Dr. Essock are also with Mental Health Services and Policy Research, New York State Psychiatric Institute, New York City.
Sheila A. Donahue, M.A.
Dr. Stein and Mr. Sorbero are with RAND Corporation, Pittsburgh (e-mail: [email protected]). Dr. Stein is also with the Department of Psychiatry, University of Pittsburgh. Dr. Pangilinan, Ms. Donahue, and Ms. Xu are with the Office of Performance Measurement and Evaluation, New York State Office of Mental Health, Albany. Dr. Marcus, Dr. Smith, and Dr. Essock are with the Department of Psychiatry, Columbia University College of Physicians and Surgeons, New York City. Dr. Marcus is also with the Department of Biostatistics, Columbia University Mailman School of Public Health. Dr. Smith and Dr. Essock are also with Mental Health Services and Policy Research, New York State Psychiatric Institute, New York City.
Yan Xu, M.S.
Dr. Stein and Mr. Sorbero are with RAND Corporation, Pittsburgh (e-mail: [email protected]). Dr. Stein is also with the Department of Psychiatry, University of Pittsburgh. Dr. Pangilinan, Ms. Donahue, and Ms. Xu are with the Office of Performance Measurement and Evaluation, New York State Office of Mental Health, Albany. Dr. Marcus, Dr. Smith, and Dr. Essock are with the Department of Psychiatry, Columbia University College of Physicians and Surgeons, New York City. Dr. Marcus is also with the Department of Biostatistics, Columbia University Mailman School of Public Health. Dr. Smith and Dr. Essock are also with Mental Health Services and Policy Research, New York State Psychiatric Institute, New York City.
Thomas E. Smith, M.D.
Dr. Stein and Mr. Sorbero are with RAND Corporation, Pittsburgh (e-mail: [email protected]). Dr. Stein is also with the Department of Psychiatry, University of Pittsburgh. Dr. Pangilinan, Ms. Donahue, and Ms. Xu are with the Office of Performance Measurement and Evaluation, New York State Office of Mental Health, Albany. Dr. Marcus, Dr. Smith, and Dr. Essock are with the Department of Psychiatry, Columbia University College of Physicians and Surgeons, New York City. Dr. Marcus is also with the Department of Biostatistics, Columbia University Mailman School of Public Health. Dr. Smith and Dr. Essock are also with Mental Health Services and Policy Research, New York State Psychiatric Institute, New York City.
Susan M. Essock, Ph.D.
Dr. Stein and Mr. Sorbero are with RAND Corporation, Pittsburgh (e-mail: [email protected]). Dr. Stein is also with the Department of Psychiatry, University of Pittsburgh. Dr. Pangilinan, Ms. Donahue, and Ms. Xu are with the Office of Performance Measurement and Evaluation, New York State Office of Mental Health, Albany. Dr. Marcus, Dr. Smith, and Dr. Essock are with the Department of Psychiatry, Columbia University College of Physicians and Surgeons, New York City. Dr. Marcus is also with the Department of Biostatistics, Columbia University Mailman School of Public Health. Dr. Smith and Dr. Essock are also with Mental Health Services and Policy Research, New York State Psychiatric Institute, New York City.

Funding Information

National Institute of Mental Health10.13039/100000025: 5R01MH086236

Metrics & Citations

Metrics

Citations

Export Citations

If you have the appropriate software installed, you can download article citation data to the citation manager of your choice. Simply select your manager software from the list below and click Download.

For more information or tips please see 'Downloading to a citation manager' in the Help menu.

Format
Citation style
Style
Copy to clipboard

View Options

View options

PDF/EPUB

View PDF/EPUB

Login options

Already a subscriber? Access your subscription through your login credentials or your institution for full access to this article.

Personal login Institutional Login Open Athens login
Purchase Options

Purchase this article to access the full text.

PPV Articles - Psychiatric Services

PPV Articles - Psychiatric Services

Not a subscriber?

Subscribe Now / Learn More

PsychiatryOnline subscription options offer access to the DSM-5-TR® library, books, journals, CME, and patient resources. This all-in-one virtual library provides psychiatrists and mental health professionals with key resources for diagnosis, treatment, research, and professional development.

Need more help? PsychiatryOnline Customer Service may be reached by emailing [email protected] or by calling 800-368-5777 (in the U.S.) or 703-907-7322 (outside the U.S.).

Media

Figures

Other

Tables

Share

Share

Share article link

Share