Full access
Articles
Published Online: 4 January 2016

Growth in Spending on and Use of Services for Mental and Substance Use Disorders After the Great Recession Among Individuals With Private Insurance

Abstract

Objective:

Recessions are associated with increased prevalence of mental and substance use disorders, but their effect on use of behavioral health services is less clear. This study examined changes in spending per enrollee for behavioral health services compared with general medical services among individuals with private insurance following the Great Recession that began in 2007.

Methods:

The National Survey on Drug Use and Health was used to examine the prevalence of behavioral health conditions among persons with private insurance from 2004 to 2013. Truven Health MarketScan Commercial Claims and Encounters data (2004–2012) were used to calculate use of and spending on treatment of behavioral and general medical conditions before and after the recession among individuals with employer-sponsored private health insurance.

Results:

There was a statistically significant increase in serious psychological distress and episodes of major depression between 2007 and 2010. Between 2004–2009 and 2009–2012, the growth in average annual spending per individual slowed for general medical care (from 6.6% to 3.7%) but accelerated for behavioral health care (from 4.8% to 6.6%). From 2009 to 2012, the percentage of individuals receiving inpatient treatment, outpatient treatment, and prescription drugs for behavioral conditions increased, whereas use of these services for general medical care decreased or remained flat. Out-of-pocket costs increased more slowly for behavioral conditions than for other medical conditions.

Conclusions:

The recession was associated with increased need for and use of behavioral health services among individuals with private insurance. The Mental Health Parity and Addiction Equity Act may have also played a role in facilitating increasing use of behavioral health services after 2008.
Macroeconomic factors, such as income and employment rates, are chief determinants of the amount, type, and price of health care services that individuals receive. These factors were altered by the recession that began in 2007, commonly known as the “Great Recession,” which affected most sectors of the U.S. economy, including health care. Data show that as of 2012, growth in U.S. private insurance health care spending had not returned to prerecession rates, despite modest economic recovery (1). Private insurance spending on behavioral health services slowed substantially during the recession, as millions of individuals lost employment and their health insurance benefits (2).
Recessions are known to be associated with an increased prevalence of mental and substance use disorders, including higher rates of suicide, depression, and binge drinking (38). This association has been found not only among individuals who lose their jobs during a recession but also among persons who maintain their employment yet experience increased financial and employment insecurities. However, the effects of the recent recession and slow recovery on the use of behavioral health services among individuals who retained their private health insurance are not well understood.
Individuals with private insurance may use more treatment for mental and substance use disorders during economic downturns because they experience a greater need. Alternatively, these individuals may be reluctant to seek these services in the face of reduced wage growth, increased debt, and the threat of unemployment (9,10). The level of financial protection afforded by health insurance coverage may play a role in their decision to seek treatment. Beginning in 2009, private insurance coverage for behavioral health services may have improved because of the implementation of the Mental Health Parity and Addiction Equity Act (MHPAEA) (11). Recent market entry of generic versions of a number of widely prescribed psychotropic medications has made many medications more affordable (12,13). However, deductibles and out-of-pocket costs have been rising significantly for all types of health care services, which may have deterred service use (14,15). Determining how people with private insurance ultimately used and spent on behavioral health services in response to these diverse changes raises complex empirical questions.
The goal of this study was to examine trends in the use of and spending on behavioral health services among individuals with private health insurance during the recession and the years immediately following it. For context, we also examined similar spending patterns for all other medical conditions, which we refer to as general medical care. This information may help identify access gaps among individuals with private insurance who need services for mental or substance use disorders as a result of economic shocks.

Methods

We used the National Survey on Drug Use and Health (NSDUH) to examine the effect of the recession on the prevalence of mental and substance use disorders among individuals with private insurance. The NSDUH is conducted annually by the Substance Abuse and Mental Health Services Administration and is used to monitor trends in the prevalence of mental and substance use disorders in the United States. The NSDUH is a nationally representative sample of the noninstitutionalized, civilian population ages 12 and older. It uses computer-assisted, face-to-face interviews to collect data. We used the questions on private insurance to identify individuals with private insurance. We used the measure of serious psychological distress and major depressive episode in the past year. We calculated the prevalence rates for each of these variables from 2004 through 2013.
To examine trends in utilization of and spending for services to treat mental and substance use disorders, we used the Truven Health MarketScan Commercial Claims and Encounters Database from 2004 through 2012. Institutional review board approval is waived for studies using such deidentified, aggregate data. The database contains private insurance claims from approximately 150 large employers for employees, their dependents, and early retirees. Over this study period, the number of individuals included in the database grew from 11 million to nearly 20 million, which represents approximately 13% of the population with private health insurance. We limited data to enrollees younger than age 65. Despite a change in sample size, however, the database continued to have the same age and sex distribution as reported by the U.S. census for individuals with employer-sponsored private insurance. To further ensure that the database was representative of trends in private insurance, we applied weights to the sample. The U.S. Bureau of Economic Analysis recently conducted a study that determined that the weighted MarketScan data could provide accurate information on national private insurance spending trends by disease (16,17).
These data were analyzed using SAS. We measured spending as the sum of payments made by insurers (primary insurance and coordination of benefits) and by patients (copayments, coinsurance, and deductibles). We also separately analyzed out-of-pocket patient costs. An important analytic goal was to compare spending trends on treatment of mental and substance use disorders with trends in spending on all other medical conditions. For inpatient and outpatient claims, we used ICD-9 diagnosis codes to identify claims with a mental or substance use disorder as the primary diagnosis. For prescription drug claims, we selected drugs on the basis of the National Drug Code (NDC) assigned to specific therapeutic classes, which are defined by the Truven Health RED BOOK classification system. The classes were antidepressants, antipsychotics, stimulants, anxiolytics/sedatives/hypnotics, antimanic agents, and miscellaneous central nervous system agents. In addition, we identified certain medications for the treatment of addictions on the basis of their NDCs. We summarized the claims data by year, diagnosis category (mental or substance use disorder versus general medical), and type of care (inpatient, outpatient, and prescription drug).
Growth in spending for inpatient care, outpatient care, and prescription drugs per enrollee was divided into multiplicative components, as shown in the following equation for inpatient care:
We determined the growth rate of each of the components and compared the rates for treatment of behavioral disorders and general medical conditions.

Results

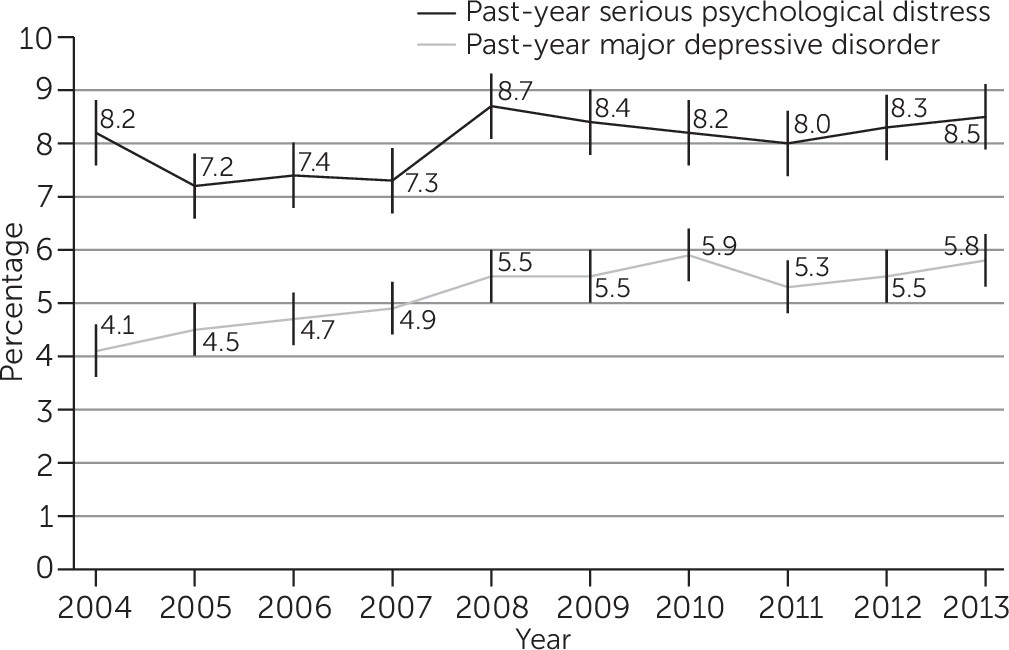
Figure 1 shows the trends in the prevalence of serious psychological distress and of episodes of major depressive illness among individuals with private insurance. There was a statistically significant increase in the prevalence of serious psychological distress from 2007 to 2008 (from 7.3% to 8.7%). There was also a statistically significant increase in the prevalence of major depressive episodes from 2007 to 2010 (4.9% to 5.9%).
FIGURE 1. Trends in the prevalence of serious psychological distress and a major depressive episode in the past year among individuals with private insurance, 2004–2013a
a Source: Author analysis of the National Survey on Drug Use and Health
Between 2004–2009 and 2009–2012, the average annual growth in spending per enrollee slowed for general medical care (from 6.6% to 3.7%) but accelerated for treatment of behavioral disorders (from 4.8% to 6.6%) (Table 1). Spending on treatment of behavioral disorders as a share of total private insurance spending decreased from 5.5% in 2004 to 5.1% in 2009 and then increased to 5.5% in 2012.
TABLE 1. Monthly spending per enrollee and average annual growth in monthly spending per enrollee for behavioral health and general medical carea
YearBehavioralGeneral medicalTotalBehavioral share (%)
Spending ($)
 2004152592755.5
 2005162812975.4
 2006172993165.4
 2007173163335.1
 2008183363545.1
 2009193563755.1
 2010203673885.2
 2011223864095.4
 2012233974205.5
Years (range)Average annual growth in spending (%) 
 2004–20094.86.66.4 
 2009–20126.63.73.8 
 2004–20125.55.55.4 
a
Source: Author analysis of the Truven Health MarketScan Commercial Claims and Encounters Database
We gained additional information by comparing rates of growth in private insurance spending across types of care, particularly for the 2009–2012 period, when overall growth rates between behavioral health and general medical care diverged (Table 2). Overall spending growth is a function of the size of each of the spending categories (inpatient, outpatient, and prescription drug) and the growth rate of the components. From 2009 through 2012, average annual spending for treatment of behavioral conditions increased more quickly than treatment for general medical conditions in inpatient settings (9.6% and 3.5%, respectively) and in outpatient settings (10.9% and 4.2%, respectively). However, spending on prescription drugs for treatment of behavioral and general medical conditions grew at similar average annual rates (1.9% and 2.4%, respectively).
TABLE 2. Monthly spending per enrollee and average annual growth in monthly spending per enrollee for behavioral health and general medical care, by type of care, 2004–2012a
 BehavioralGeneral medical
YearInpatientOutpatientPrescription drugsInpatientOutpatientPrescription drugs
 Spending ($)
 20041.865.138.2866.10141.2551.91
 20051.875.118.6570.49155.9554.99
 20061.935.189.6574.42166.1758.40
 20072.085.409.7778.85176.4560.88
 20082.255.7510.1884.40189.2162.28
 20092.496.2610.5589.39202.7563.92
 20102.746.8710.8892.78209.9964.67
 20113.077.7511.3398.04221.2567.18
 20123.288.5311.1699.08229.3568.62
 Percentage of total spending
 200412.233.654.225.5054.4820.02
 200512.032.755.325.0555.4119.54
 200611.530.957.624.8955.5819.53
 200712.131.356.624.9455.8119.25
 200812.431.656.025.1356.3318.54
 200912.932.454.725.1156.9417.95
 201013.433.553.125.2557.1517.60
 201113.935.051.225.3757.2517.38
 201214.337.148.624.9557.7617.28
Years (range)Contribution to increase in spending (%)
 2004–200916.028.056.024.062.014.0
 2009–201216.047.013.012.032.04.0
 Average annual growth in spending (%)
 2004–20096.04.15.06.27.44.4
 2009–20129.610.81.93.74.22.3
 2004–20127.36.63.85.36.33.6
a
Source: Author analysis of the Truven Health MarketScan Commercial Claims and Encounters Database
Table 3 reports spending by component for behavioral health care (inpatient, outpatient, and prescription drugs) in 2004, 2009, and 2012 and average annual growth in spending by component for general medical and behavioral health care in 2009–2012, the period immediately following the Great Recession. Between 2009 and 2012, the percentage of enrollees with an inpatient admission increased at a rate of 3.5% per year for behavioral health care but decreased by 3.2% for general medical care. Days per admission (length of stay) for inpatient care increased more for behavioral health care than for general medical care. Inpatient admissions per individual with any admission (readmissions) for either behavioral health or general medical care did not change appreciably. Average spending per day rose more quickly for inpatient stays involving general medical care versus behavioral health care.
TABLE 3. Components of behavioral health care in 2004, 2009, and 2012 and average annual growth in components of behavioral health and general medical care, 2009–2012a
 Average annual growth, 2009–2012 (%)
Type of care and component200420092012BehavioralGeneral medical
Inpatient     
 Spending per day ($)8451,0721,1993.85.9
 Days per admission6.316.807.212.0.9
 Admissions per user1.51.51.5.0.2
 Users per enrollee (%).28.28.313.5–3.2
 Total spending per enrollee month ($)1.862.493.281.93.7
Outpatient     
 Spending per visit ($)1101211374.24.4
 Visits per user6.906.917.342.0−.4
 Users per enrollee (%)8.19.010.24.3.0
 Total spending per enrollee month ($)5.136.268.5310.84.2
Prescription drugs     
 Price per day ($)2.342.572.49–1.12.2
 Days per prescription35.837.137.8.61.2
 Prescriptions per user6.97.27.4.9−.3
 Users per enrollee (%)17.218.419.21.4−.6
 Total spending per enrollee month ($)8.2810.5511.161.92.4
a
Source: Author analysis of the Truven Health MarketScan Commercial Claims and Encounters Database
The percentage of enrollees using outpatient services and the number of outpatient visits per user increased for behavioral health care but remained essentially stable or fell slightly for general medical care. Spending per outpatient visit increased for both behavioral health and general medical care.
The percentage of individuals using prescription drugs to treat behavioral conditions increased slightly, whereas the percentage of individuals using drugs to treat general medical conditions decreased slightly. The number of prescriptions filled per user rose slightly for psychiatric medications but fell slightly for general medical medications. There was a slight increase in the number of days filled per prescription for both types of medications. The price per day fell for psychiatric medications but rose for general medical medications.
Table 4 reports out-of-pocket costs from 2004 through 2012 for users of behavioral health and general medical care and for an inpatient stay, an outpatient visit, and a prescription fill for behavioral and general medical conditions. The 2009–2012 growth in out-of-pocket spending was higher for general medical conditions compared with behavioral health conditions for inpatient and outpatient services.
TABLE 4. Out-of-pocket expenditures for treatment of behavioral health and general medical conditions, by type of care, 2004–2012a
 Total per userPer inpatient stayPer outpatient visitPer prescription
 BehavioralGeneral medicalBehavioralGeneral medicalBehavioralGeneral medicalBehavioralGeneral medical
 
Year$Growth rate (%)$Growth rate (%)$Growth rate (%)$Growth rate (%)$Growth rate (%)$Growth rate (%)$Growth rate (%)$Growth rate (%)
2004174 444 704 603 23 34 16 15 
200518564921181015681132593710188167
200619765206710–127054264395199174
20071970548573947811127441618–5171
20082044555183213828628442218–117–1
20092113587683508918294456181172
2010223665211943131,095233165216181172
2011227267131,00261,158632355518–317–2
2012234371671,149151,32915347611116–816–3
2009–2012 (annual average) 3.5 6.7 10.9 13.8 5.4 9.6 –3.5 –1.4
a
Source: Author analysis of the Truven Health MarketScan Commercial Claims and Encounters Database

Discussion

The results of this study indicate that the use of behavioral health services increased following the 2007 recession in contrast to the use of general medical services, which declined or did not change. The change in rates of use was a central reason why overall spending for behavioral health services grew following the recession and spending for general medical care slowed. The stress created by economic uncertainty (such as increased debt, threats of job loss, and declining wage growth and income) may have led to increased need for and use of behavioral health services among those with access to these benefits. This result is consistent with prior evidence that recessions increase the prevalence of various mental and substance use disorders even among those who retain their employment (18,19). The NSDUH data support this hypothesis, showing significant increases in serious psychological distress and major depressive episodes following the recession in 2007. In contrast, the effect of recessions on somatic illness and general medical care usage has been contradictory and may vary by type of service, for example, routine versus nonroutine services (20,21).
Our results for inpatient care are qualitatively similar to those of two other recent studies. First, national data from general hospitals show that between 1997 and 2011, privately insured admissions decreased by 9% and newborn deliveries decreased by 16%, whereas admissions for mood disorders increased by 27% (22). A second study using a different employer sample found that from 2007 to 2012, the average annual growth rate for inpatient spending increased considerably faster for mental (11.7%) and substance use (28.9%) disorder admissions than for medical and surgical admissions (4.3%) (21). The authors also reported faster growth in the number of users of inpatient services per enrollee for behavioral health care compared with medical and surgical care, as was found in this study.
The implementation of the MHPAEA, which began in 2009, may be another contributor to the growth in rates of use of behavioral health care services and associated spending. In response to this law, most large, employer-based health plans changed their health insurance benefits by eliminating strict limits on inpatient days and outpatient visits and by dropping higher cost sharing for behavioral health care (23). Our analyses indicate that out-of-pocket spending growth was slower for behavioral conditions than for other medical conditions, which may be a result of these coverage changes. A recent quasi-experimental study found that the MHPAEA was associated with a moderate increase in spending on treatment of substance use disorders (24). Similar increases may be expected in the future, because the MHPAEA and the Affordable Care Act are projected to expand existing behavioral health services for up to 30 million Americans and provide new treatment access for 32 million others (25).
Several limitations of this study should be noted. First, the study focused on employer-sponsored insurance. The findings may not pertain to people who obtain health insurance through the individual market, which represents about 10% of those with private insurance. Second, the data are aggregated at the national level, which precluded our ability to distinguish states or employers that may have had different exposure to economic conditions, state parity laws, or other influences on spending. Third, the claims data are from a convenience sample; however, as noted in Methods, the sample was weighted to be nationally representative and has been determined to provide accurate representations of disease-specific trends among individuals with private insurance.

Conclusions

The finding that spending for behavioral health services increased in the years following the recession among individuals who had employer-sponsored insurance coverage may be a positive sign. Recessions are associated with increased prevalence of mental and substance use disorders, and increased spending may suggest that individuals were able to access more services as their need increased. However, additional microeconomic analyses are needed to confirm this hypothesis and to disentangle many simultaneous changes, such as implementation of the MHPAEA. Future studies should examine trends among individuals without insurance to further elucidate the role of insurance coverage in protecting individuals from the adverse psychiatric consequences of recessions.

Acknowledgments

The authors thank Lauren Hughey, M.P.H., for research assistance, Richard Bizier, B.A., for programming assistance, and Linda Lee, Ph.D., Paige Jackson, Ph.D., and Lucy Karnell, Ph.D., for editorial assistance. All are employees of Truven Health Analytics.

Footnote

The funder had no role in the design and conduct of the study; management, analysis, or interpretation of the data; or preparation of the article. The funder commented on an early version, and those comments were considered by the authors in later versions, but they did not affect the overall or specific findings in this article. The views expressed in this article are those of the authors and not necessarily those of SAMHSA or the Department of Health and Human Services.

References

1.
Martin AB, Hartman M, Whittle L, et al: National health spending in 2012: rate of health spending growth remained low for the fourth consecutive year. Health Affairs 33:67–77, 2014
2.
Levit KR, Mark TL, Coffey RM, et al: Federal spending on behavioral health accelerated during recession as individuals lost employer insurance. Health Affairs 32:952–962, 2013
3.
Coope C, Gunnell D, Hollingworth W, et al: Suicide and the 2008 economic recession: who is most at risk? Trends in suicide rates in England and Wales, 2001–2011. Social Science and Medicine 117:76–85, 2014
4.
Reeves A, McKee M, Stuckler D: Economic suicides in the Great Recession in Europe and North America. British Journal of Psychiatry 205:246–247, 2014
5.
Meltzer H, Bebbington P, Brugha T, et al: Job insecurity, socio-economic circumstances and depression. Psychological Medicine 40:1401–1407, 2010
6.
Bor J, Basu S, Coutts A, et al: Alcohol use during the great recession of 2008–2009. Alcohol and Alcoholism Journal 48:343–348, 2013
7.
Goldman-Mellor SJ, Saxton KB, Catalano RC: Economic contraction and mental health: a review of the evidence, 1990–2009. International Journal of Mental Health 39:6–31, 2010
8.
Zivin K, Paczkowski M, Galea S: Economic downturns and population mental health: research findings, gaps, challenges and priorities. Psychological Medicine 41:1343–1348, 2011
9.
Lusardi A, Schneider DJ, Tufano P: The Economic Crisis and Medical Care Usage. NBER Working Paper no 15843. Cambridge, Mass, National Bureau of Economic Research, March 2010. Available at www.nber.org/papers/w15843
10.
Hodgkin D, Karpman HE: Economic crises and public spending on mental health care. International Journal of Mental Health 39:91–106, 2010
11.
Beronio K, Glied S, Frank R: How the Affordable Care Act and Mental Health Parity and Addiction Equity Act greatly expand coverage of behavioral health care. Journal of Behavioral Health Services and Research 41:410–428, 2014
12.
Mark TL, Kassed C, Levit K, et al: An analysis of the slowdown in growth of spending for psychiatric drugs, 1986–2008. Psychiatric Services 63:13–18, 2012
13.
Medicine Use and Shifting Costs of Healthcare: A Review of the Use of Medicines in the United States in 2014. Danbury, Conn, IMS Institute for Healthcare Informatics, 2015. Available at www.imshealth.com/en/thought-leadership/ims-institute/reports/medicines-use-in-the-us-2014
14.
Ryu AJ, Gibson TB, McKellar MR, et al: The slowdown in health care spending in 2009–11 reflected factors other than the weak economy and thus may persist. Health Affairs 32:835–840, 2013
15.
Spending for Private Health Insurance in the United States: January 2013. Washington, DC, National Institute for Health Care Management, 2015. Available at www.nihcm.org/component/content/article/326-publications-health-care-spending/722-spending-for-private-health-insurance-in-the-united-states
16.
Dunn A, Rittmueller L, Whitmore B: Introducing the New BEA Health Care Satellite Account. Survey of Current Business, Jan 2015, pp 1–21. Available at www.bea.gov/scb/pdf/2015/01%20January/0115_bea_health_care_satellite_account.pdf
17.
Dunn A, Liebman E, Shapiro AH: Developing a framework for decomposing medical-care expenditure growth: exploring issues of representativeness; in Measuring Economic Sustainability and Progress. Edited by Jorgenson DW, Landefeld JS, Schreyer P. Chicago, University of Chicago Press, 2014
18.
Catalano R, Goldman-Mellor S, Saxton K, et al: The health effects of economic decline. Annual Review of Public Health 32:431–450, 2011
19.
Dee TS: Alcohol abuse and economic conditions: evidence from repeated cross-sections of individual-level data. Health Economics 10:257–270, 2001
20.
Yilmazer T, Babiarz P, Liu F: The impact of diminished housing wealth on health in the United States: evidence from the Great Recession. Social Science and Medicine 130:234–241, 2015
21.
Du J, Yagihashi T: Health care use, out-of-pocket expenditure, and macroeconomic conditions during the Great Recession. BE Journal of Economic Analysis and Policy 15:119–156, 2014
22.
Pfuntner A, Wier LM, Stocks C: Most Frequent Conditions in US Hospitals, 2011. HCUP Statistical Brief no 162. Rockville, Md, Agency for Healthcare Research and Quality, Sept 2013. Available at www.hcup-us.ahrq.gov/reports/statbriefs/sb162.pdf
23.
Substantial Improvements to Mental Health and Substance Use Disorder Coverage in Response to the Mental Health Parity and Addiction Equity Act of 2008. ASPE Research Brief. Washington, DC, US Department of Health and Human Services, Office of the Assistant Secretary for Planning and Evaluation, Nov 2013. Available at aspe.hhs.gov/daltcp/reports/2013/mhsudRB.shtml
24.
Busch SH, Epstein AJ, Harhay MO, et al: The effects of federal parity on substance use disorder treatment. American Journal of Managed Care 20:76–82, 2014
25.
Beronio K, Po R, Skopec L, et al: Affordable Care Act Expands Mental Health and Substance Use Disorder Benefits and Federal Parity Protections for 62 Million Americans. Washington, DC, US Department of Health and Human Services, Office of the Assistant Secretary for Planning and Evaluation, Feb 2013. Available at aspe.hhs.gov/health/reports/2013/mental/rb_mental.cfm

Information & Authors

Information

Published In

Go to Psychiatric Services

Cover: Assinibone hand drum, by Werner Forman. From the Plains Indian Museum, BBHC, Cody, Wyoming. Photo credit: HIP/Art Resource, New York City.

Psychiatric Services
Pages: 504 - 509
PubMed: 26725293

History

Received: 20 January 2015
Revision received: 20 July 2015
Accepted: 17 August 2015
Published online: 4 January 2016
Published in print: May 01, 2016

Authors

Details

Tami L. Mark, Ph.D., M.B.A.
Dr. Mark and Ms. Levit are with the Center for Behavioral Health Services Research, Truven Health Analytics, Washington, D.C. (e-mail: [email protected]). Dr. Hodgkin is with the Heller School for Social Policy and Management and Dr. Thomas is with the Schneider Institute for Health Policy, Brandeis University, Waltham, Massachusetts.
Dominic Hodgkin, Ph.D.
Dr. Mark and Ms. Levit are with the Center for Behavioral Health Services Research, Truven Health Analytics, Washington, D.C. (e-mail: [email protected]). Dr. Hodgkin is with the Heller School for Social Policy and Management and Dr. Thomas is with the Schneider Institute for Health Policy, Brandeis University, Waltham, Massachusetts.
Katharine R. Levit, B.A.
Dr. Mark and Ms. Levit are with the Center for Behavioral Health Services Research, Truven Health Analytics, Washington, D.C. (e-mail: [email protected]). Dr. Hodgkin is with the Heller School for Social Policy and Management and Dr. Thomas is with the Schneider Institute for Health Policy, Brandeis University, Waltham, Massachusetts.
Cindy Parks Thomas, Ph.D.
Dr. Mark and Ms. Levit are with the Center for Behavioral Health Services Research, Truven Health Analytics, Washington, D.C. (e-mail: [email protected]). Dr. Hodgkin is with the Heller School for Social Policy and Management and Dr. Thomas is with the Schneider Institute for Health Policy, Brandeis University, Waltham, Massachusetts.

Competing Interests

The authors report no financial relationships with commercial interests.

Funding Information

Substance Abuse and Mental Health Services Administration10.13039/100000058: HHSS283200700029I/HHSS28342002T
This study was supported by contract task order HHSS283200700029I/HHSS28342002T from the Substance Abuse and Mental Health Services Administration (SAMHSA) (contract HHSS283200700029I).

Metrics & Citations

Metrics

Citations

Export Citations

If you have the appropriate software installed, you can download article citation data to the citation manager of your choice. Simply select your manager software from the list below and click Download.

For more information or tips please see 'Downloading to a citation manager' in the Help menu.

Format
Citation style
Style
Copy to clipboard

View Options

View options

PDF/EPUB

View PDF/EPUB

Login options

Already a subscriber? Access your subscription through your login credentials or your institution for full access to this article.

Personal login Institutional Login Open Athens login
Purchase Options

Purchase this article to access the full text.

PPV Articles - Psychiatric Services

PPV Articles - Psychiatric Services

Not a subscriber?

Subscribe Now / Learn More

PsychiatryOnline subscription options offer access to the DSM-5-TR® library, books, journals, CME, and patient resources. This all-in-one virtual library provides psychiatrists and mental health professionals with key resources for diagnosis, treatment, research, and professional development.

Need more help? PsychiatryOnline Customer Service may be reached by emailing [email protected] or by calling 800-368-5777 (in the U.S.) or 703-907-7322 (outside the U.S.).

Media

Figures

Other

Tables

Share

Share

Share article link

Share