Predictors of Hospital Length and Cost of Stay in a National Sample of Adult Patients with Psychotic Disorders
Abstract
Objective:
Methods:
Results:
Conclusions:
Methods
Data Source
Sample
| Variable | N | % |
|---|---|---|
| Ages (range 18–64) (M±SD) | 40.86±11.96 | |
| Length of stay (range 0–365) (M±SD) | 10.88±14.80 | |
| Cost of stay (range $32.92–$4,759,869) (M±SD) | $23,008.07±$36,532.08 | |
| Sex | ||
| Men | 397,765 | 58.9 |
| Women | 277,055 | 41.1 |
| Race | ||
| White | 260,996 | 49.0 |
| Black/African American | 180,629 | 33.9 |
| Hispanic | 56,405 | 10.6 |
| Asian/Pacific Islander | 11,945 | 2.2 |
| Native American | 2,870 | .5 |
| Other | 20,229 | 3.8 |
| Median household income | ||
| $1–$38,999 | 242,837 | 42.1 |
| $39,000–$47,999 | 146,168 | 25.3 |
| $48,000–$62,999 | 111,372 | 19.3 |
| ≥$63,000 | 76,453 | 13.3 |
| Primary payer source | ||
| Medicare | 263,935 | 39.0 |
| Medicaid | 256,732 | 38.0 |
| Private, including HMO | 79,786 | 11.8 |
| Self-pay | 43,734 | 6.5 |
| No charge | 5,001 | .7 |
| Other | 27,006 | 4.0 |
| Loss of functioning due to illness | ||
| Minor | 231,611 | 34.6 |
| Moderate | 393,536 | 58.7 |
| Major | 40,653 | 6.1 |
| Extreme | 4,278 | .6 |
| Variable | N | % |
|---|---|---|
| Region | ||
| Northeast | 166,900 | 24.6 |
| Midwest | 166,386 | 24.6 |
| South | 219,859 | 32.4 |
| West | 124,539 | 18.4 |
| Location | ||
| Rural | 55,011 | 8.2 |
| Urban | 619,070 | 91.8 |
| Ownership or control | ||
| Government | 128,918 | 19.2 |
| Private, not for profit | 445,705 | 66.4 |
| Private, investor owned | 96,624 | 14.4 |
| Bed size | ||
| Small | 61,008 | 9.1 |
| Medium | 176,600 | 26.2 |
| Large | 436,473 | 64.8 |
| Teaching status | ||
| Nonteaching | 339,707 | 50.4 |
| Teaching | 334,374 | 49.6 |
Measures
Psychiatric diagnosis.
Patient characteristics.
Hospital characteristics.
Data Analysis
Rate estimates.
Multilevel models.
LOS and COS models.
Results
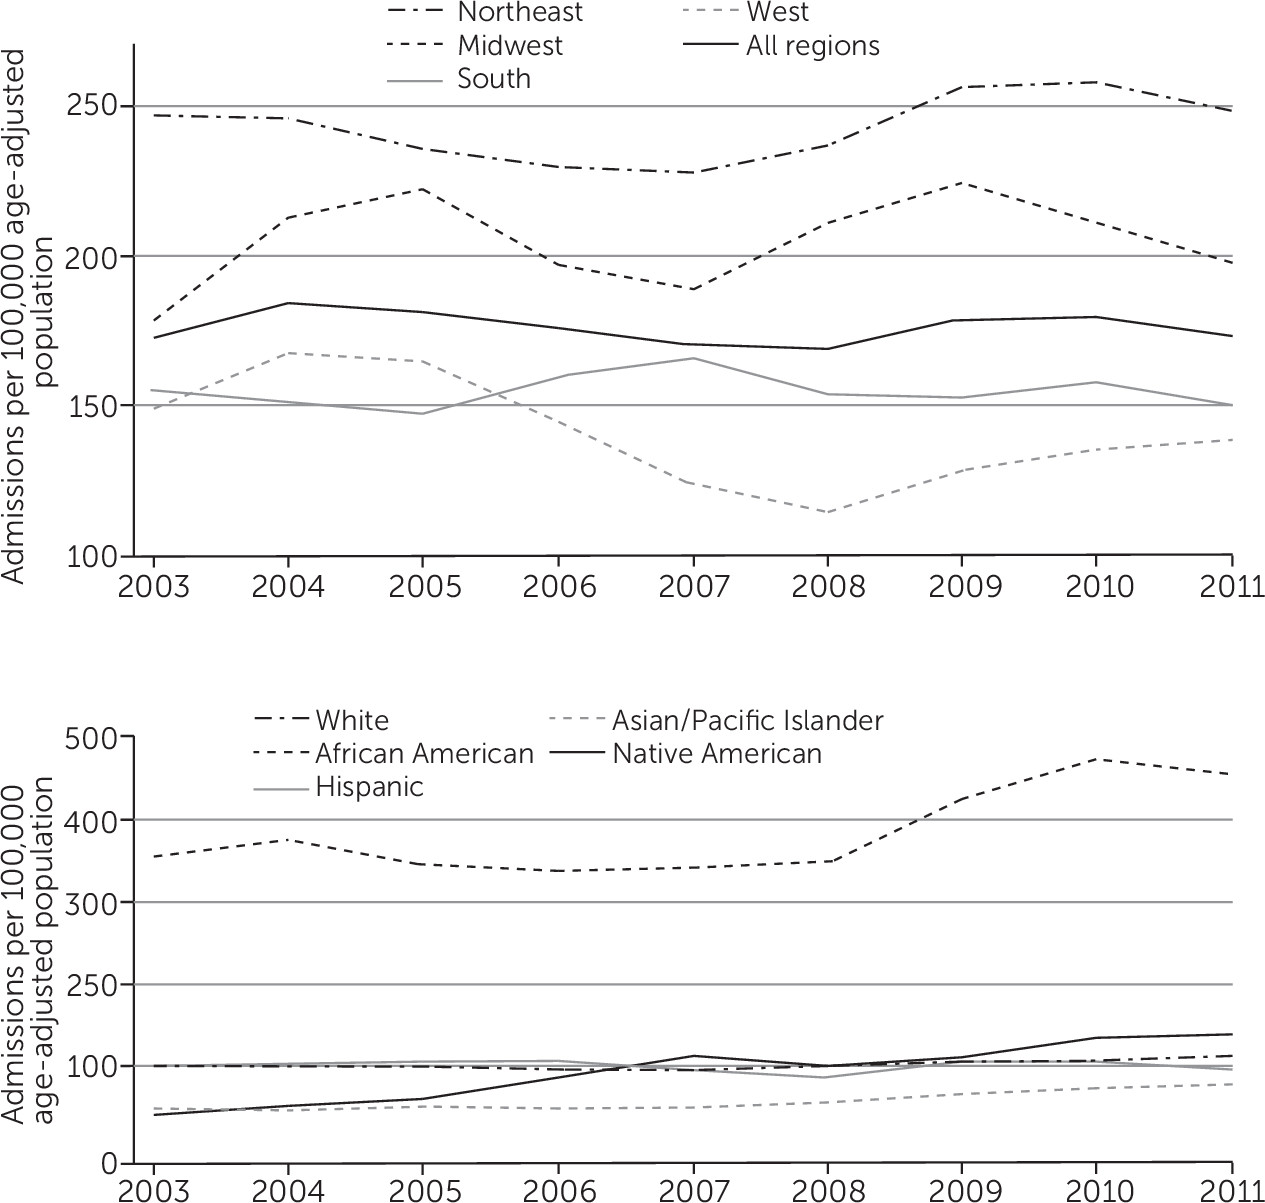
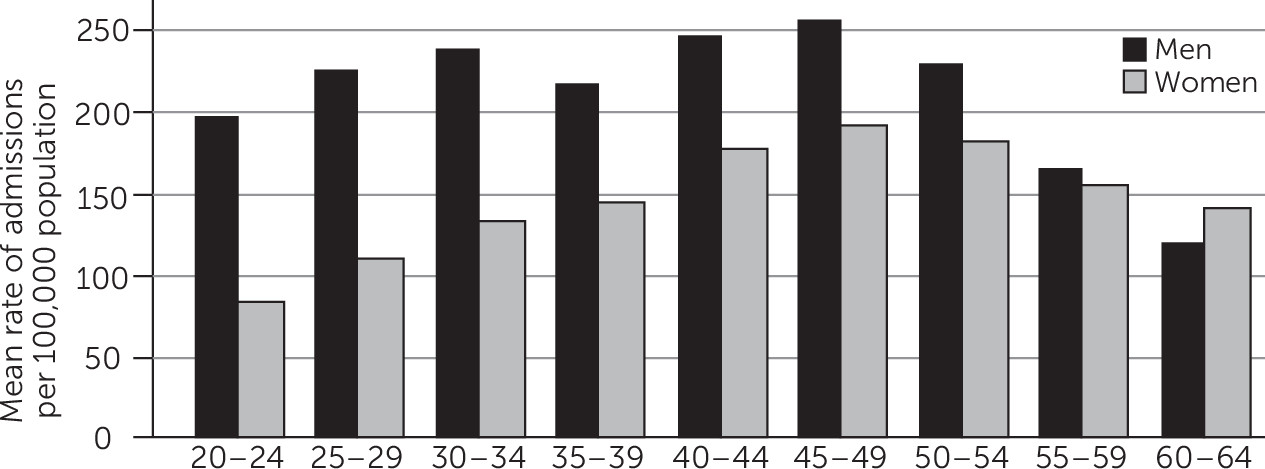
Hospitalization Rates


Multilevel Results for LOS and COS
| LOS model | COS model | |||||
|---|---|---|---|---|---|---|
| Variable | Coeff. | SE | p | Coeff. | SE | p |
| Fixed effect | ||||||
| Intercept (constant) | 11.29 | .24 | <.001 | 8.96 | .02 | <.001 |
| Age | .03 | .002 | <.001 | .003 | .000 | <.001 |
| Women (reference: men) | .69 | .04 | <.001 | .07 | .002 | <.001 |
| Race-ethnicity (reference: white) | ||||||
| Black/African American | –.58 | .05 | <.001 | –.04 | .002 | <.001 |
| Hispanic | –.46 | .08 | <.001 | –.02 | .004 | <.001 |
| Asian/Pacific Islander | 1.13 | .19 | <.001 | .10 | .009 | <.001 |
| Native American | .68 | .30 | .02 | .02 | .02 | .26 |
| Other | .24 | .18 | .19 | .02 | .007 | .01 |
| Median household income (reference: $1–$38,999) | ||||||
| $39,000–$47,999 | .15 | .05 | .004 | .02 | .003 | <.001 |
| $48,000–$62,999 | .33 | .07 | <.001 | .03 | .003 | <.001 |
| ≥$63,000 or more | 1.00 | .09 | <.001 | .06 | .005 | <.001 |
| Primary payer source (reference: Medicare) | ||||||
| Medicaid | –1.08 | .05 | <.001 | –.10 | .003 | <.001 |
| Private including HMO | –2.50 | .07 | <.001 | –.18 | .004 | <.001 |
| Self-pay | –2.91 | .07 | <.001 | –.25 | .004 | <.001 |
| No-charge | –1.11 | .26 | <.001 | –.11 | .01 | <.001 |
| Other | –1.50 | .12 | <.001 | –.19 | .01 | <.001 |
| Loss of functioning due to illness (reference: minor) | ||||||
| Moderate | .86 | .04 | <.001 | .11 | .003 | <.001 |
| Major | 2.37 | .10 | <.001 | .28 | .005 | <.001 |
| Extreme | 13.43 | .43 | <.001 | 1.02 | .02 | <.001 |
| Region (reference: Northeast) | ||||||
| Midwest | –5.23 | .10 | <.001 | –.55 | .01 | <.001 |
| South | –5.50 | .09 | <.001 | –.43 | .01 | <.001 |
| West | –5.13 | .10 | <.001 | –.11 | .01 | <.001 |
| Urban location (reference: rural) | 1.00 | .10 | <.001 | .38 | .02 | <.001 |
| Ownership or control (reference: government owned) | ||||||
| Private, not for profit | –1.23 | .21 | <.001 | .08 | .02 | <.001 |
| Private, investor owned | –.79 | .21 | <.001 | .23 | .02 | <.001 |
| Bed size (reference: small) | ||||||
| Medium | .61 | .13 | <.001 | .13 | .01 | <.001 |
| Large | 1.05 | .12 | <.001 | .17 | .01 | <.001 |
| Teaching (reference: nonteaching) | .44 | .10 | <.001 | .06 | .01 | <.001 |
| Year (reference: 2003) | ||||||
| 2004 | –.07 | .11 | .543 | .02 | .01 | .001 |
| 2005 | –.40 | .12 | .001 | –.01 | .01 | .03 |
| 2006 | –.54 | .12 | <.001 | .02 | .01 | .002 |
| 2007 | –.69 | .11 | <.001 | .08 | .01 | <.001 |
| 2008 | –.99 | .10 | <.001 | .04 | .01 | <.001 |
| 2009 | –1.36 | .10 | <.001 | .10 | .01 | <.001 |
| 2010 | –1.66 | .11 | <.001 | .12 | .01 | <.001 |
| 2011 | –1.13 | .10 | <.001 | .19 | .01 | <.001 |
| Random effect | ||||||
| Intercept (constant) | 3.81 | .05 | .45 | .004 | ||
| Residual | 13.52 | .10 | .70 | .001 | ||
LOS model.
COS model.
Discussion and Conclusions
Acknowledgments
Footnote
References
Information & Authors
Information
Published In

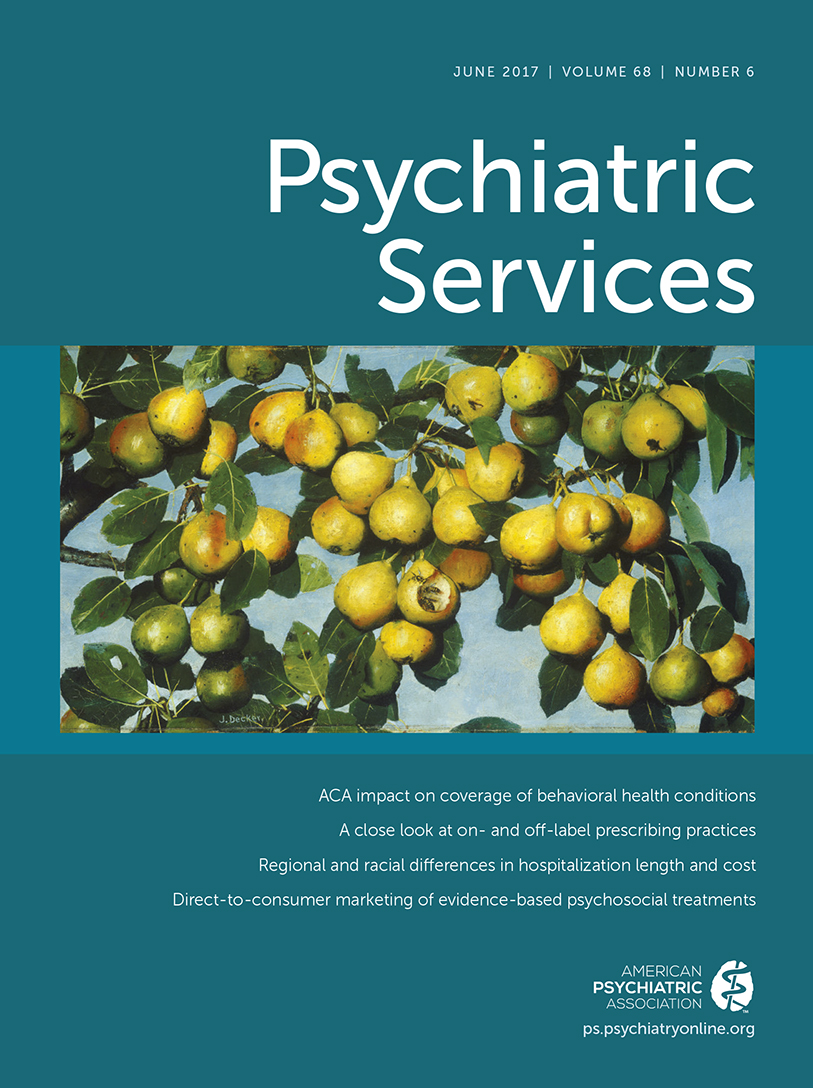
Cover: Ripening Pears, by Joseph Decker, circa 1884. Oil on canvas. Gift of Ann and Mark Kington/The Kington Foundation Avalon Fund. National Gallery of Art, Washington, D.C.
History
Keywords
Authors
Competing Interests
Funding Information
Metrics & Citations
Metrics
Citations
Export Citations
If you have the appropriate software installed, you can download article citation data to the citation manager of your choice. Simply select your manager software from the list below and click Download.
For more information or tips please see 'Downloading to a citation manager' in the Help menu.
View Options
View options
PDF/EPUB
View PDF/EPUBLogin options
Already a subscriber? Access your subscription through your login credentials or your institution for full access to this article.
Personal login Institutional Login Open Athens loginNot a subscriber?
PsychiatryOnline subscription options offer access to the DSM-5-TR® library, books, journals, CME, and patient resources. This all-in-one virtual library provides psychiatrists and mental health professionals with key resources for diagnosis, treatment, research, and professional development.
Need more help? PsychiatryOnline Customer Service may be reached by emailing [email protected] or by calling 800-368-5777 (in the U.S.) or 703-907-7322 (outside the U.S.).
