Full access
Articles
Published Online: 1 February 2017

Predictors of Hospital Length and Cost of Stay in a National Sample of Adult Patients with Psychotic Disorders

Abstract

Objective:

This study examined effects of patient-level and hospital-level characteristics on length and cost of hospital stays among adult patients with psychotic disorders.

Methods:

A subsample of 677,684 adult patients with a primary diagnosis of a psychotic disorder was drawn from the 2003–2011 Healthcare Cost and Utilization Project Nationwide Inpatient Sample. A nationally representative survey design and census data were used to calculate hospitalization rates. Multilevel models examined variation in length and cost of stay in relation to individual (age, sex, race-ethnicity, household income, payer source, and illness severity) and hospital (region, urban or rural location, ownership, teaching status, and size) characteristics.

Results:

Admission rates differed dramatically by region, with higher rates in the Northeast. Compared with white patients, African Americans had higher admission rates but shorter stays and lower costs, and Asians/Pacific Islanders and Native Americans had longer stays. Longer stays were also associated with higher versus lower illness severity and use of Medicaid and Medicare versus private insurance. Length and cost of stays were greater in Northeast hospitals and in public hospitals.

Conclusions:

Strong differences were noted in use of hospitalization to treat psychotic disorders. Higher admission rates and longer stays in the Northeast were striking, as were differences in admission rates and length of stay for African-American patients compared with white patients. Future research should investigate the appropriateness of acute care use from an overuse (Northeast) and underuse (West) perspective. Findings raise questions about the effects of health reform on adult acute care use and have implications for mental health and hospital policy.
Psychotic disorders, especially schizophrenia, are debilitating and chronic mental illnesses associated with extreme personal distress and high societal cost (1,2). Calculating the direct and indirect costs of schizophrenia is a complex task. Direct costs associated with care provision can be overwhelming for mental health systems as well as for family members of individuals with schizophrenia. Indirect costs include the loss of productivity, disability, and legal issues, which can involve violence (3). Although community treatment can be effective, many individuals require more intensive care in inpatient psychiatric settings (4). Despite the importance of inpatient care to mental health systems and to those with a diagnosis of a psychotic disorder, little research has documented national rates of hospitalization or the personal and hospital factors associated with both length of stay (LOS) and costs of stay (COS).
Many factors are associated with LOS and COS, including clinical factors, such as general medical comorbidities, along with age, illness severity, and other characteristics. However, personal characteristics, such as insurance and housing status, and sociodemographic characteristics, such as race and ethnicity, have also been found to be associated with LOS (5), raising questions about the appropriateness of decision making regarding hospitalization. Nonclinical characteristics are also associated with LOS and COS. For example, many states require that individuals are discharged to an address, and discharges may be delayed until a residence is secured. In addition, overdiagnosis and misdiagnosis of psychotic disorders among African Americans are well researched and documented in a variety of clinical settings (6,7). In the psychiatric hospital setting, African-American patients are more likely to be diagnosed as having schizophrenia and less likely to be diagnosed as having a mood disorder compared with white patients (810). Furthermore, African Americans diagnosed as having schizophrenia in hospital settings are more likely than white patients to be admitted (1113). Disparities in hospital diagnosis and subsequent admission decisions may have implications for LOS, especially if admission is not warranted.
This study examined the relationship between patient-level characteristics (age, sex, race-ethnicity, income, primary payer source, and illness severity) and community hospital-level characteristics (ownership and control, bed size, teaching status, urban or rural location, and geographic region) on the length and cost of hospitalization among adult patients with a primary diagnosis of schizophrenia or other psychotic disorder. Understanding these relationships can inform mental health policy, especially as it relates to health insurance coverage and ongoing efforts to contain costs. Knowledge about patient characteristics associated with LOS and COS can also inform mental health treatment providers.

Methods

Data Source

Data from the 2003–2011 Healthcare Cost and Utilization Project (HCUP) Nationwide Inpatient Sample (NIS) (14) were used. The NIS is the largest publicly available database of hospital inpatient stays and is drawn from 46 states, covering 97% of the U.S. population. The NIS provides researchers and policy makers with patient and hospital information to identify and analyze health care utilization, charges, and outcome trends. The sample represents discharge records of inpatient admissions from random samples of 20% of U.S. community hospitals. Approximately 4,093 hospitals were included in the 2003–2011 NIS samples. This period was selected to allow for analysis of a coherent set of variables with the same survey design methods. The data and protocol were reviewed and approved by the University of Maryland, Baltimore, Institutional Review Board and determined to be of minimal risk.

Sample

Tables 1 and 2 present data on admissions and on hospital characteristics, respectively. The sample included 677,684 admissions of patients with a primary diagnosis of schizophrenia or other psychotic disorder. Most patients were male (58.9%) and white (49.1%); the mean±SD age of the sample was 40.86±11.96. Approximately 59% of patients experienced moderate loss of functioning because of illness severity. On the basis of zip code, the largest proportion of patients (42.1%) were in the median household income category of $1–$38,999. In terms of primary payer source, the largest proportion of patients (39.0%) was covered by Medicare.
TABLE 1. Characteristics of patients (N=677,684) with hospital admissions with a primary diagnosis of a psychotic disorder, 2003–2011
VariableN%
Ages (range 18–64) (M±SD)40.86±11.96 
Length of stay (range 0–365) (M±SD)10.88±14.80 
Cost of stay (range $32.92–$4,759,869) (M±SD)$23,008.07±$36,532.08 
Sex  
 Men397,76558.9
 Women277,05541.1
Race  
 White260,99649.0
 Black/African American180,62933.9
 Hispanic56,40510.6
 Asian/Pacific Islander11,9452.2
 Native American2,870.5
 Other20,2293.8
Median household income  
 $1–$38,999242,83742.1
 $39,000–$47,999146,16825.3
 $48,000–$62,999111,37219.3
 ≥$63,00076,45313.3
Primary payer source  
 Medicare263,93539.0
 Medicaid256,73238.0
 Private, including HMO79,78611.8
 Self-pay43,7346.5
 No charge5,001.7
 Other27,0064.0
Loss of functioning due to illness  
 Minor231,61134.6
 Moderate393,53658.7
 Major40,6536.1
 Extreme4,278.6
TABLE 2. Admissions of patients (N=677,684) with a primary diagnosis of a psychotic disorder, by hospital characteristics, 2003–2011
VariableN%
Region  
 Northeast166,90024.6
 Midwest166,38624.6
 South219,85932.4
 West124,53918.4
Location  
 Rural55,0118.2
 Urban619,07091.8
Ownership or control  
 Government128,91819.2
 Private, not for profit445,70566.4
 Private, investor owned96,62414.4
Bed size  
 Small61,0089.1
 Medium176,60026.2
 Large436,47364.8
Teaching status  
 Nonteaching339,70750.4
 Teaching334,37449.6
Most hospitals were located in urban areas (91.8%), and the largest proportion of hospitals were in the South (32.4%). Most hospitals were generally private, not for profit (66.4%), and about half (49.6%) were teaching hospitals. On the basis of number of beds, most (64.8%) were large hospitals.

Measures

Psychiatric diagnosis.

The HCUP NIS used Clinical Classifications Software (CCS) diagnosis group to categorize ICD-9-CM diagnosis and procedure codes into mutually exclusive categories (14). The ICD-9-CM is based on the ICD-9 (15) and was the official system of assigning codes to diagnoses and procedures associated with hospital utilization. Only patients who were classified as having a primary diagnosis of a psychotic disorder, such as schizophrenia and delusional disorder, under the CCS mental disorders code of 659 were included in this study.

Patient characteristics.

Patients’ age, sex, race-ethnicity, LOS, COS, median income, primary payer source, and severity of illness were also assessed. The NIS COS variable was adjusted for inflation to express all costs in 2011 dollars. The median household income for a patient’s zip code included the following categories: $1–$38,999, $39,000–$47,999, $48,000–$62,999, and ≥$63,000. Primary payer source categories included Medicare, Medicaid, private (including HMO), self-pay, no charge, and other. Patients’ severity of illness was measured by 3M Health Information Systems software (14) and included minor, moderate, major, and extreme loss of functioning due to illness.

Hospital characteristics.

Hospital characteristics included geographic region (Northeast, Midwest, West, and South), location (urban and rural), control or ownership (government; private or not for profit; and private, investor owned), teaching status (teaching and nonteaching), and bed size (small, medium, and large) (14).

Data Analysis

Rate estimates.

The complex sampling design of the NIS allows for the calculation of national and regional estimates of diagnoses among hospital admissions per year. Using the weights, primary sampling units, and strata provided in the NIS data and SAS 9.4 Proc Surveyfreq (16), we calculated national and regional estimates of hospitalizations for adult patients (ages 18–64) with admissions for a primary diagnosis of a psychotic disorder. Population denominator data were obtained from the Centers for Disease Control and Prevention’s National Vital Statistics System Web site (17) and were used to calculate population denominators for hospital admission rates adjusted by age, gender, race-ethnicity, and region. Rates between years were then smoothed with a moving average by using the prior and subsequent years weighted once and the current year weighted twice.

Multilevel models.

Multilevel analyses were conducted with Stata, version 14.0 (18). Multilevel analyses were used to examine the effects of patient-level and hospital-level characteristics on LOS and COS among adult patients with a primary diagnosis of a psychotic disorder, with patients nested within hospitals. Nominal variables (race-ethnicity, median income, primary payer source, illness severity, region, ownership and control, and bed size) were dummy coded. Model reference groups were white race, minor loss of functioning, median income of $1–$38,999, Medicare insurance, small bed size, Northeast region, 2003 for year, and government hospital control or ownership. Sampling weights were not used in analyses as recommended by the HCUP (19).
Preliminary analyses revealed a positively skewed distribution of COS data. To meet the assumption of normality and have a more symmetric distribution, a logarithmic transformation of COS was used (20). Because the log transformation of COS is included in model analyses, COS was interpreted as log dollar costs of hospitalizations. Residuals were examined after each model was conducted to assess error term distributions.

LOS and COS models.

Following standard methodology (20), null LOS and COS models were estimated to test for nonzero interclass correlations (ICC). After rejection of the null models, the final LOS model was constructed, which included all patient-level and hospital-level characteristics and the LOS variable. The final COS model included all patient-level and hospital-level characteristics and logarithmic transformation of the COS variable. The patient and hospital characteristics were used as level 1 nested within hospitals as level 2. Given the nonnormality of the models, bootstrapped standard errors with 50 repetitions were used to adjust for violations of normality and homoscedasticity assumptions.

Results

Hospitalization Rates

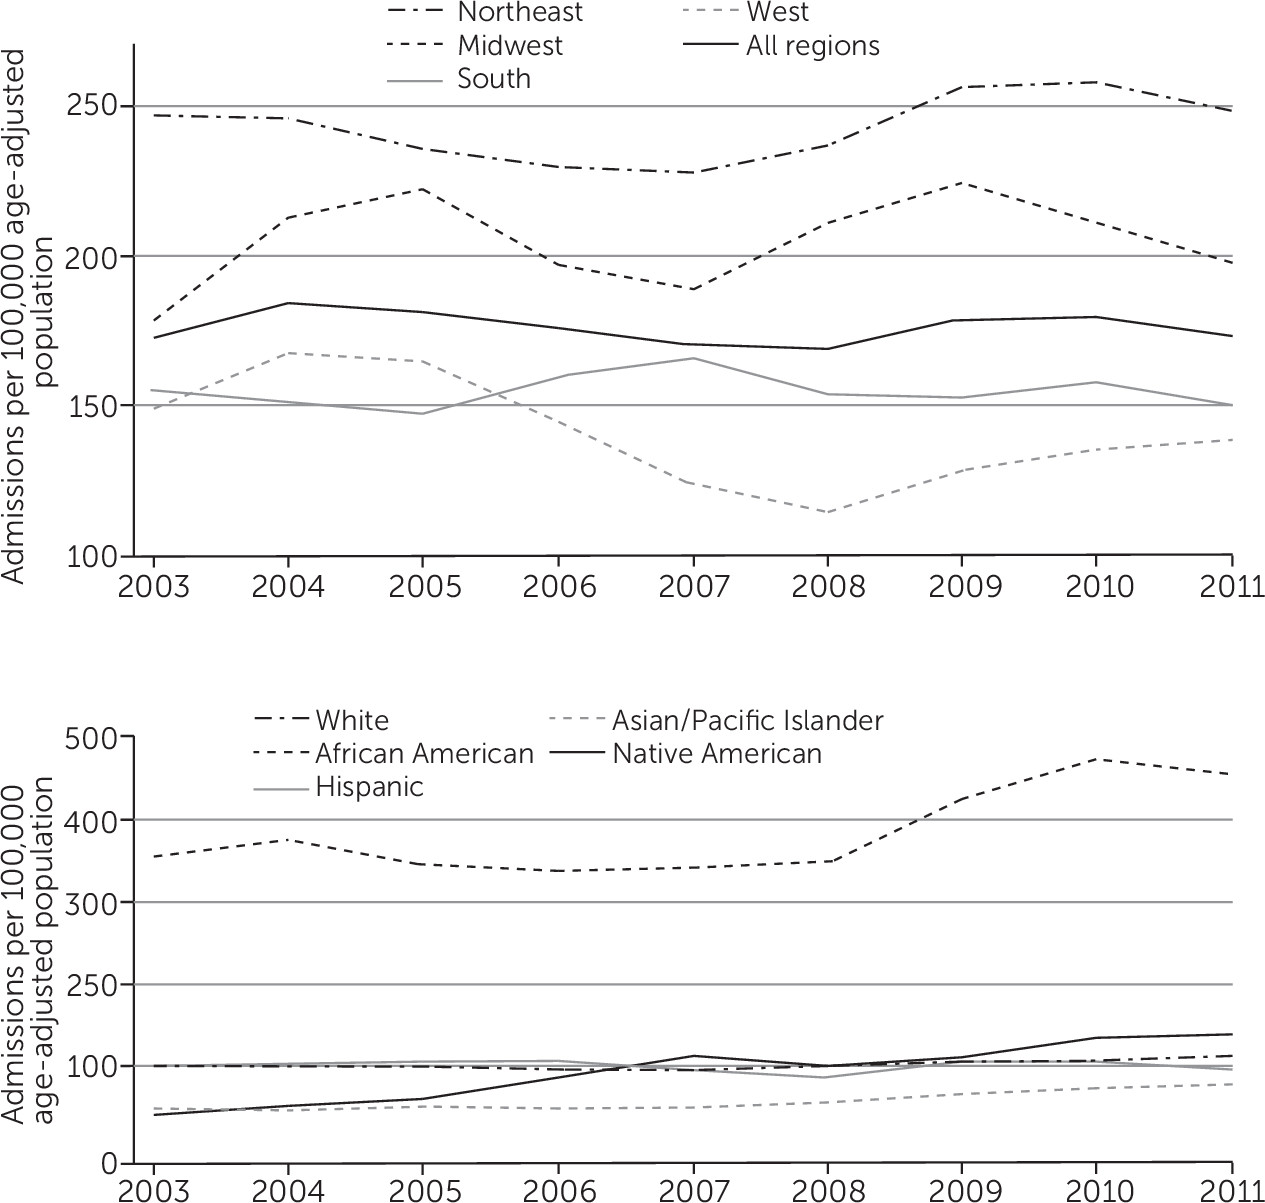
Smoothed rates of hospitalization for psychotic disorders for each geographic region are displayed in Figure 1. Using the unsmoothed rates, the overall mean rate of admission between 2003 and 2011 was 176 per 100,000 age-adjusted populaton, with the lowest rate in 2008 (160 per 100,000) and the highest rate in 2004 (199 per 100,000). The Northeast had the highest mean rate of 243 per 100,000 and the West had the lowest mean rate of 140 per 100,000. Differences between the Northeast and all other regions were statistically significant (p<.001), whereas differences between the South, Midwest, and West were not statistically significant.
FIGURE 1. Smoothed rates of hospital admissions for adults with a primary diagnosis of a psychotic disorder, by U.S. region and by race-ethnicity
Figure 1 also shows the smoothed rates of hospital admissions per 100,000 age-adjusted population for racial and ethnic categories. African Americans had the highest admission rate (mean rate of 381 per 100,000) and Asian/Pacific Islander patients had the lowest admission rate (mean rate of 59 per 100,000) between 2003 and 2011. African-American patients’ rate of admission was significantly higher than all other groups (p<.001), and Asian/Pacific Islander patients’ rate was significantly lower than that of white patients (p=.02).
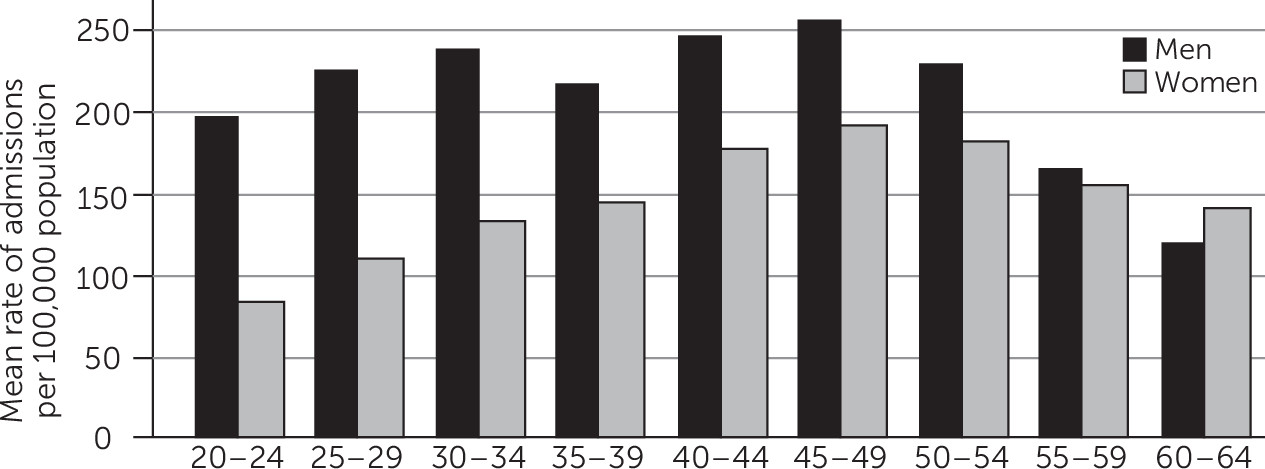
The unsmoothed mean rate of admission for men was 210 per 100,000, and for women it was 147 per 100,000, as illustrated in Figure 2. Men and women ages 45–49 had the highest mean admission rates—256 and 192 per 100,000, respectively. Among men, those ages 60–64 had the lowest mean admission rate (120 per 100,000), and women ages 20–24 years had the lowest mean admission rate (85 per 100,000).
FIGURE 2. Mean rates of hospital admissions for adults with a primary diagnosis of a psychotic disorder, by age category and sex, 2003–2011

Multilevel Results for LOS and COS

Patients’ mean±SD hospital LOS was 10.88±14.80 days, with a median LOS of seven days. Patients’ mean COS was $23,008.07±$36,532.08, with a median COS of $13,600.44. The estimated null model ICC was .09 and .38 for the LOS and COS models, respectively, indicating more variation between hospitals in COS than in LOS, where more of the variation was at the admission level. Adjusted contrasts comparing weighted group means to the weighted means are described below. Results from multilevel analyses are reported in Table 3.
TABLE 3. Multilevel model results for length of stay (LOS) and cost of stay (COS) among 677,684 patients hospitalized with a primary diagnosis of a psychotic disorder, 2003–2011
 LOS modelCOS model
VariableCoeff.SEpCoeff.SEp
Fixed effect      
 Intercept (constant)11.29.24<.0018.96.02<.001
 Age.03.002<.001.003.000<.001
 Women (reference: men).69.04<.001.07.002<.001
 Race-ethnicity (reference: white)      
  Black/African American–.58.05<.001–.04.002<.001
  Hispanic–.46.08<.001–.02.004<.001
  Asian/Pacific Islander1.13.19<.001.10.009<.001
  Native American.68.30.02.02.02.26
  Other.24.18.19.02.007.01
  Median household income (reference: $1–$38,999)      
  $39,000–$47,999.15.05.004.02.003<.001
  $48,000–$62,999.33.07<.001.03.003<.001
  ≥$63,000 or more1.00.09<.001.06.005<.001
 Primary payer source (reference: Medicare)      
  Medicaid–1.08.05<.001–.10.003<.001
  Private including HMO–2.50.07<.001–.18.004<.001
  Self-pay–2.91.07<.001–.25.004<.001
  No-charge–1.11.26<.001–.11.01<.001
  Other–1.50.12<.001–.19.01<.001
 Loss of functioning due to illness (reference: minor)      
  Moderate.86.04<.001.11.003<.001
  Major2.37.10<.001.28.005<.001
  Extreme13.43.43<.0011.02.02<.001
 Region (reference: Northeast)      
  Midwest–5.23.10<.001–.55.01<.001
  South–5.50.09<.001–.43.01<.001
  West–5.13.10<.001–.11.01<.001
 Urban location (reference: rural)1.00.10<.001.38.02<.001
 Ownership or control (reference: government owned)      
  Private, not for profit–1.23.21<.001.08.02<.001
  Private, investor owned–.79.21<.001.23.02<.001
 Bed size (reference: small)      
  Medium.61.13<.001.13.01<.001
  Large1.05.12<.001.17.01<.001
 Teaching (reference: nonteaching).44.10<.001.06.01<.001
 Year (reference: 2003)      
  2004–.07.11.543.02.01.001
  2005–.40.12.001–.01.01.03
  2006–.54.12<.001.02.01.002
  2007–.69.11<.001.08.01<.001
  2008–.99.10<.001.04.01<.001
  2009–1.36.10<.001.10.01<.001
  2010–1.66.11<.001.12.01<.001
  2011–1.13.10<.001.19.01<.001
Random effect      
 Intercept (constant)3.81.05 .45.004 
 Residual13.52.10 .70.001 

LOS model.

LOS was almost two weeks longer among patients with extreme severity of illness compared with those with low severity. Patients’ age was significantly associated with LOS; each decade of life was associated on average with a stay of one-third day longer. Women had .69 more hospitalization days on average than men (p<.001). In the LOS model of group-weighted average patients, African-American and Hispanic patients had .75 and .63 days of hospitalization, respectively, compared with every one day of hospitalization for white patients (p<.001). LOS was one day shorter among patients who lived in areas with the lowest household income, compared with those from higher-income areas (p<.001).
Compared with the mean LOS, the LOS among patients covered by Medicare was 1.52 days longer (p<.001) and the LOS among Medicaid patients was .43 days longer (p<.001). In contrast, the LOS among patients covered by private insurance was shorter than the mean; patients with private insurance had stays that were one day shorter than the mean (p<.001), and self-pay patients had stays nearly 1.4 days shorter than the mean (p<.001). Compared with the LOS in government-owned hospitals, the LOS in private, not-for-profit hospitals was 1.23 days shorter and the LOS in private, investor-owned hospitals was .79 days shorter on average. LOS was longer in teaching hospitals than in nonteaching hospitals. LOS was longer in large hospitals than in small hospitals. Hospital region was associated with large effects on LOS. Hospitals in the Northeast reported LOS more than five days longer compared with hospitals in all other regions (p<.001). LOS in urban hospitals was one day longer than in rural hospitals (p<.001).

COS model.

In the COS model, log-transformed coefficients were interpreted as logged dollars or as percentage change. Individuals with extreme loss of functioning had 102% higher costs compared with individuals with minor loss of functioning (p<.001). Each decade of age was also associated with a .3% (p<.001) increase in cost, when the analysis adjusted for symptom severity.
As with LOS, COS was associated with various nonclinical factors. Costs among women were 7% higher than among men (p<.001). Compared with white patients, African-American and Hispanic patients had 4% and 2% lower costs, respectively (p<.001), and Asian/Pacific Islander patients had approximately 10% higher costs (p<.001). Compared with the adjusted-observation weighted grand mean, COS was 1% lower among white patients, 6% lower among African-American patients, 4% lower among Hispanic patients, and 9% higher among Asian/Pacific Islander patients (p<.001). In addition, compared with patients living in areas with lowest household incomes, those in areas with the highest incomes had 6% higher COS (p<.001).
Among the payer groups, Medicare patients had the highest COS, followed by Medicaid patients; self-pay patients had the lowest COS. COS was 6% higher in teaching hospitals than in nonteaching hospitals (p<.001), and COS was 17% higher in large hospitals than in small hospitals (p<.001). Hospital region was associated with relatively large effects on COS. COS was 11% to 55% higher in hospitals in the Northeast compared with hospitals in other regions (p<.001). COS was 38% higher in urban hospitals than in rural hospitals (p<.001).

Discussion and Conclusions

In this analysis of national data, we found that the rate of admissions for patients with primary diagnoses of psychotic disorders was 175 per 100,000 U.S. population ages 18–64, with a range of 160–199 per 100,000 over the nine years (2003–2011) of the study. Substantial variability in rates of admissions, LOS, and COS was related to region of the country. Furthermore, race and ethnicity appeared to play a critical role in predicting both LOS and COS, as did other nonclinical characteristics.
The highest rate of admission for each study year was in the Northeast (overall mean rate of 242 per 100,000), and the lowest rate was generally in the West (overall mean rate of 140 per 100,000). Patients hospitalized in the Midwest, South, and West experienced shorter hospital stays than those hospitalized in the Northeast. The longer LOS and the higher COS in the Northeast were striking, particularly with the higher admission rate. These differences in use of inpatient care across the United States beg questions about the appropriateness of care and the use of scarce mental health resources (21).
Because many states in the Northeast, particularly New York and Massachusetts, have high rates of spending on both inpatient and outpatient care, our findings suggest that utilization rates are evidence not of a trade-off between use of outpatient and inpatient services but of relatively well-funded mental health systems. However, understanding how these geographic differences affect outcomes and determining whether use of inpatient or outpatient care leads to improved outcomes for identifiable subgroups of adults are important avenues for future research.
Racial-ethnic differences were noted in rates of admission as well as in LOS and COS. On average, African-American patients had 381 admissions per 100,000 race-adjusted population compared with 102 per 100,000 for white patients and 59 per 100,000 for Asian/Pacific Islander patients. Compared with LOS among white patients, LOS among African-American patients was a half-day shorter and COS was 4% lower. Conversely, LOS was one day longer among Asian/Pacific Islander patients compared with white patients, and COS was 10% higher than among white patients. These differences in LOS and COS have been well documented in other samples (22) and speak to an interplay of increased reliance on acute care for African Americans, accompanied by a lower per capita hospital resource allocation. It is possible that these findings are related to population differences in symptom expression between African Americans and other groups or bias in the interpretation of behavior (23). Results suggest that African Americans are admitted to inpatient facilities when admission is not clinically necessary or when their symptoms are less severe than whites, lending further support to findings that acute psychiatric services are overutilized for some African Americans who could potentially be better served in outpatient treatment (2325). After the analysis adjusted for severity, our finding of differences in hospital care by race-ethnicity also reflects disparities in care, which is consistent with other findings (23,26). A better understanding of this dynamic could improve services by improving the cultural responsiveness of health care providers or by increasing the availability and acceptability of needed outpatient treatment (27,28).
Of note, we found that clinical severity was a driving force for both LOS and COS. The largest difference in LOS, almost two weeks, was found for those with extreme loss of functioning. The results also support a dose-response effect for loss of functioning, with each increase in functioning impairment associated with a longer hospital stay.
In addition, household income, as indicated by patients’ zip code, and primary payment source were significantly associated with LOS and COS. Individuals who lived in areas with lower incomes had shorter LOS and lower COS than those living in higher-income areas. It is difficult to believe that unmeasured severity of illness increases with household income; however, the mechanisms of this income-based disparity are unclear. A possible explanation for the disparity in LOS by household income and for the other findings is the well-documented shortage of psychiatric beds (4,29,30). These shortages may be differentially distributed across communities by income, and hospitals that serve lower-income areas may be forced to reduce LOS to increase access for those in need.
Not surprisingly, payer source was related to LOS and COS, which likely reflects differences in reimbursement rates, managed care efforts, and other payer characteristics. Patients who used Medicare or Medicaid had longer LOS and higher COS than patients who used private insurance. Unlike race-ethnicity or income, these mechanisms are better understood. Unmeasured severity is a likely explanation, because patients with the most severe schizophrenia are covered by public insurance rather than private insurance (31). Furthermore, even though legislation has increased parity in recent years, some evidence suggests that private insurers continue to restrict mental health services relative to general medical services (31). Also, patients hospitalized in private, nonprofit hospitals or in private, investor-owned hospitals experienced shorter LOS and higher COS than patients in government-owned hospitals, which is likely indicative of more patient turnover in private facilities.
Although the use of longitudinal NIS data over nine years was a strength of this study in assessing hospitalization rates and predictors of LOS and COS, the data were limited in that only a few patient and hospital characteristics were included in the NIS, which in turn limited the conclusions that can be drawn. The reliance on ICD-9-CM codes for both the sampling and the severity measures, without a clinical assessment for research purposes, has limitations related to the accuracy of the coding process. Evidence suggests that these codes are reliable for psychiatric diagnoses, but the evidence is limited (32). The NIS also captures events that occur only during hospitalization and does not provide information on readmissions. However, the differences found among patient-level characteristics suggest that use of inpatient clinical care plays a role in mental health disparities and warrants further investigation of the mechanisms by which patients’ demographic backgrounds have differential effects on care.

Acknowledgments

The authors thank Dan Ciccarone, M.D., M.P.H. (primary investigator, RO1DA037820), for support in funding data acquisition and for general encouragement.

Footnote

The funders had no role in the design and conduct of the study; collection, management, analysis, and interpretation of the data; preparation, review, or approval of the manuscript; and decision to submit the manuscript for publication.

References

1.
Penn DL, Waldheter EJ, Perkins DO, et al: Psychosocial treatment for first-episode psychosis: a research update. American Journal of Psychiatry 162:2220–2232, 2005
2.
Rüsch N, Müller M, Lay B, et al: Emotional reactions to involuntary psychiatric hospitalization and stigma-related stress among people with mental illness. European Archives of Psychiatry and Clinical Neuroscience 264:35–43, 2014
3.
Rössler W, Salize HJ, van Os J, et al: Size of burden of schizophrenia and psychotic disorders. European Neuropsychopharmacology 15:399–409, 2005
4.
Sharfstein SS, Dickerson FB: Hospital psychiatry for the twenty-first century. Health Affairs 28:685–688, 2009
5.
Tulloch AD, Fearon P, David AS: Length of stay of general psychiatric inpatients in the United States: systematic review. Administration and Policy in Mental Health and Mental Health Services Research 38:155–168, 2011
6.
Dougherty RH: Reducing disparity in behavioral health services: a report from the American College of Mental Health Administration. Administration and Policy in Mental Health and Mental Health Services Research 31:253–263, 2004
7.
Neighbors HW, Trierweiler SJ, Ford BC, et al: Racial differences in DSM diagnosis using a semi-structured instrument: the importance of clinical judgment in the diagnosis of African Americans. Journal of Health and Social Behavior 44:237–256, 2003
8.
Barnes A: Race and hospital diagnoses of schizophrenia and mood disorders. Social Work 53:77–83, 2008
9.
Barnes A: Race and schizophrenia diagnoses in four types of hospitals. Journal of Black Studies 44:665–681, 2013
10.
Delphin-Rittmon ME, Flanagan EH, Andres-Hyman R, et al: Racial-ethnic differences in access, diagnosis, and outcomes in public-sector inpatient mental health treatment. Psychological Services 12:158–166, 2015
11.
Choi MR, Eun HJ, Yoo TP, et al: The effects of sociodemographic factors on psychiatric diagnosis. Psychiatry Investigation 9:199–208, 2012
12.
Coleman KJ, Stewart C, Waitzfelder BE, et al: Racial-ethnic differences in psychiatric diagnoses and treatment across 11 health care systems in the Mental Health Research Network. Psychiatric Services 67:749–757, 2016
13.
Durbin A, Rudoler D, Durbin J, et al: Examining patient race and area predictors of inpatient admission for schizophrenia among hospital users in California. Journal of Immigrant and Minority Health 16:1025–1034, 2014
14.
Healthcare Cost and Utilization Project (HCIP). Rockville, Md, Agency for Healthcare Research and Quality, 2016. http://www.hcup-us.ahrq.gov
15.
International Statistical Classification of Disease and Related Health Problems, Tenth Revision (ICD-10). Geneva, World Health Organization, 1978
16.
Base SAS 9.4 Procedures Guide, 5th ed. Cary, NC, SAS Institute Inc, 2015
17.
US Census Populations With Bridged Race Categories. Atlanta, Centers for Disease Control and Prevention, National Center for Health Statistics. http://www.cdc.gov/nchs/nvss/bridged_race.htm. Accessed Nov 12, 2015
18.
Stata Statistical Software: Release 14. College Station, Tex, StataCorp LP, 2014
19.
Houchens R, Chu B, Steine C: Hierarchical Modeling Using HCUP Data. HCUP Methods Series Report 2007-01. Rockville, Md, Agency for Healthcare Research and Quality, 2007. http://www.hcup-us.ahrq.gov/reports/methods.jsp
20.
Rabe-Hesketh S, Skrondal A: Multilevel and Longitudinal Modeling Using Stata. College Station, Tex, Stata Press, 2005
21.
Ayers SL, Kronenfeld JJ, Kim SS, et al: Geographic disparities in adult mental health utilization and need for service; in Inequalities and Disparities in Health Care and Health: Concerns of Patients, Providers and Insurers. Edited by Kronenfeld JJ. Bingly, United Kingdom, Emerald Group Publishing Limited, 2007
22.
Sentell T, Unick GJ, Ahn HJ, et al: Illness severity and psychiatric hospitalization rates among Asian Americans and Pacific Islanders. Psychiatric Services 64:1095–1102, 2013
23.
Snowden LR, Catalano R, Shumway M: Disproportionate use of psychiatric emergency services by African Americans. Psychiatric Services 60:1664–1671, 2009
24.
Snowden LR, Cheung FK: Use of inpatient mental health services by members of ethnic minority groups. American Psychologist 45:347–355, 1990
25.
Snowden LR, Hastings JF, Alvidrez J: Overrepresentation of black Americans in psychiatric inpatient care. Psychiatric Services 60:779–785, 2009
26.
Cheung FK, Snowden LR: Community mental health and ethnic minority populations. Community Mental Health Journal 26:277–291, 1990
27.
Whaley AL, Geller PA: Toward a cognitive process model of ethnic/racial biases in clinical judgment. Review of General Psychology 11:75–96, 2007
28.
Yamada AM, Barrio C, Morrison SW, et al: Cross-ethnic evaluation of psychotic symptom content in hospitalized middle-aged and older adults. General Hospital Psychiatry 28:161–168, 2006
29.
Shumway M, Alvidrez J, Leary M, et al: Impact of capacity reductions in acute public-sector inpatient psychiatric services. Psychiatric Services 63:135–141, 2012
30.
Slade EP, Goldman HH: The dynamics of psychiatric bed use in general hospitals. Administration and Policy in Mental Health and Mental Health Services Research 42:139–146, 2015
31.
Mechanic D, McAlpine DD, Rochefort DA: Mental Health and Social Policy: Beyond Managed Care. Boston, Pearson Higher Ed, 2013
32.
Bender M, Smith T, Nejati F: Administrative coding and clinician documentation of mental health issues for hospitalized heart failure patients: is there agreement? Journal of Cardiac Failure 20:S45, 2014

Information & Authors

Information

Published In
Go to Psychiatric Services

Cover: Ripening Pears, by Joseph Decker, circa 1884. Oil on canvas. Gift of Ann and Mark Kington/The Kington Foundation Avalon Fund. National Gallery of Art, Washington, D.C.

Psychiatric Services
Pages: 559 - 565
PubMed: 28142382

History

Received: 6 July 2016
Revision received: 30 September 2016
Accepted: 4 November 2016
Published online: 1 February 2017
Published in print: June 01, 2017

Keywords

  1. Length of stay
  2. Community psychiatry
  3. Schizophrenia
  4. Hospitalization
  5. Psychotic disorders

Authors

Details

Melissa L. Bessaha, Ph.D., L.M.S.W.
Dr. Bessaha is with the School of Social Welfare, Stony Brook University, Stony Brook, New York (e-mail: [email protected]). Dr. Shumway is with the Department of Psychiatry, University of California, San Francisco. Dr. Smith, Dr. Bright, and Dr. Unick are with the School of Social Work, University of Maryland, Baltimore.
Martha Shumway, Ph.D.
Dr. Bessaha is with the School of Social Welfare, Stony Brook University, Stony Brook, New York (e-mail: [email protected]). Dr. Shumway is with the Department of Psychiatry, University of California, San Francisco. Dr. Smith, Dr. Bright, and Dr. Unick are with the School of Social Work, University of Maryland, Baltimore.
Melissa Edmondson Smith, Ph.D., M.S.W.
Dr. Bessaha is with the School of Social Welfare, Stony Brook University, Stony Brook, New York (e-mail: [email protected]). Dr. Shumway is with the Department of Psychiatry, University of California, San Francisco. Dr. Smith, Dr. Bright, and Dr. Unick are with the School of Social Work, University of Maryland, Baltimore.
Charlotte L. Bright, Ph.D., M.S.W.
Dr. Bessaha is with the School of Social Welfare, Stony Brook University, Stony Brook, New York (e-mail: [email protected]). Dr. Shumway is with the Department of Psychiatry, University of California, San Francisco. Dr. Smith, Dr. Bright, and Dr. Unick are with the School of Social Work, University of Maryland, Baltimore.
George J. Unick, Ph.D., M.S.W.
Dr. Bessaha is with the School of Social Welfare, Stony Brook University, Stony Brook, New York (e-mail: [email protected]). Dr. Shumway is with the Department of Psychiatry, University of California, San Francisco. Dr. Smith, Dr. Bright, and Dr. Unick are with the School of Social Work, University of Maryland, Baltimore.

Competing Interests

The authors report no financial relationships with commercial interests.

Funding Information

NIDA-NIAID: RO1DA037820
This work was supported by grant RO1DA037820 from the National Institute on Drug Abuse and the National Institute of Allergy and Infectious Disease.

Metrics & Citations

Metrics

Citations

Export Citations

If you have the appropriate software installed, you can download article citation data to the citation manager of your choice. Simply select your manager software from the list below and click Download.

For more information or tips please see 'Downloading to a citation manager' in the Help menu.

Format
Citation style
Style
Copy to clipboard

View Options

View options

PDF/EPUB

View PDF/EPUB

Login options

Already a subscriber? Access your subscription through your login credentials or your institution for full access to this article.

Personal login Institutional Login Open Athens login
Purchase Options

Purchase this article to access the full text.

PPV Articles - Psychiatric Services

PPV Articles - Psychiatric Services

Not a subscriber?

Subscribe Now / Learn More

PsychiatryOnline subscription options offer access to the DSM-5-TR® library, books, journals, CME, and patient resources. This all-in-one virtual library provides psychiatrists and mental health professionals with key resources for diagnosis, treatment, research, and professional development.

Need more help? PsychiatryOnline Customer Service may be reached by emailing [email protected] or by calling 800-368-5777 (in the U.S.) or 703-907-7322 (outside the U.S.).
Media

Figures

Other

Tables

Share

Share

Share article link

Share