Racial-Ethnic Differences in Patterns of Discontinuous Medication Treatment Among Medicaid-Insured Youths With ADHD
Abstract
Objective:
Methods:
Results:
Conclusions:
Methods
Data
Study Sample
Measures
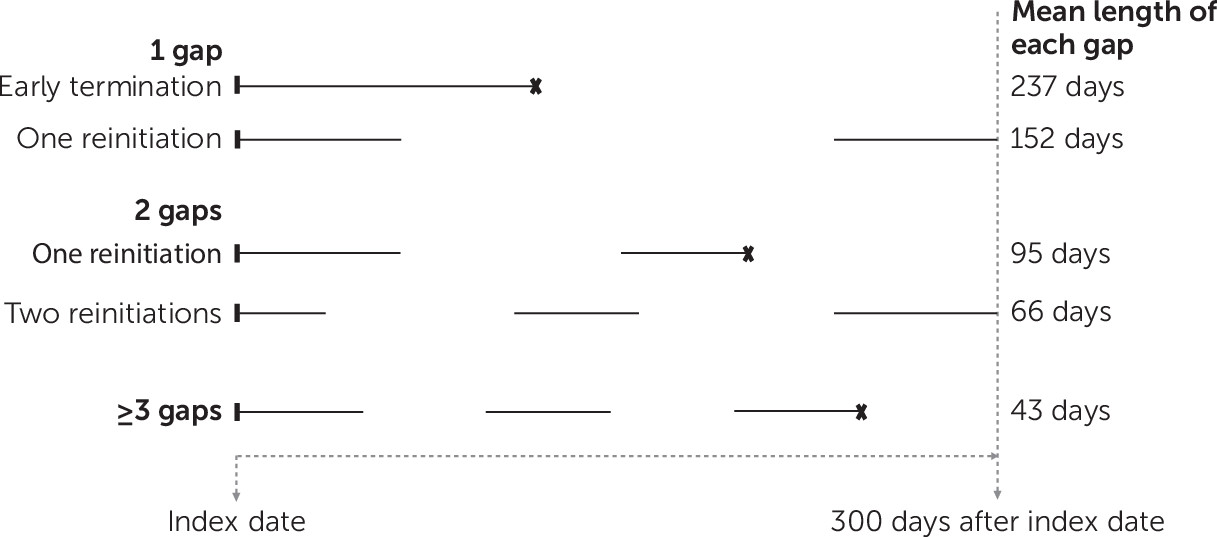
Patterns of medication treatment.
Race-ethnicity.
Covariates.
Analysis
Results
Sample Characteristics
| Total sample (N=102,669) | Non-Hispanic white (N=49,046) | Non-Hispanic black (N=32,929) | Hispanic (N=14,035) | Non-Hispanic otherb (N=837) | Unknown (N=5,822) | |||||||
|---|---|---|---|---|---|---|---|---|---|---|---|---|
| Characteristic | N | % | N | % | N | % | N | % | N | % | N | % |
| Medication treatment | ||||||||||||
| Continuous | 40,129 | 39.1 | 24,317 | 49.6 | 8,894 | 27.0*** | 4,381 | 31.2*** | 283 | 33.8*** | 2,254 | 38.7*** |
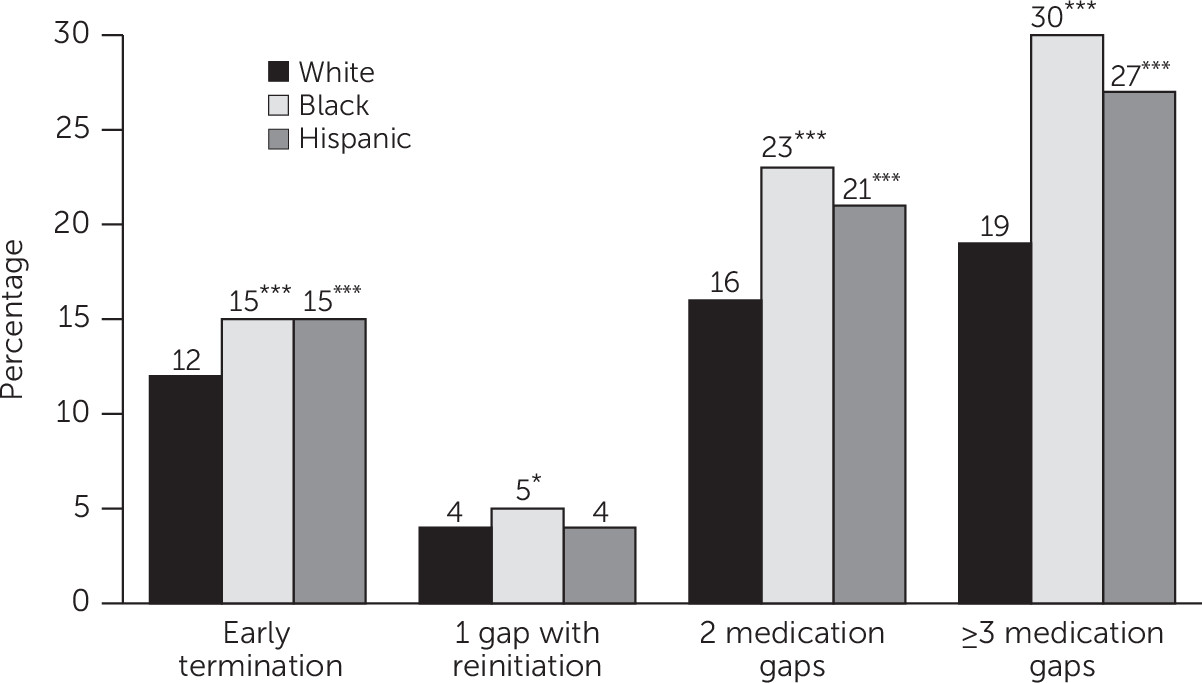
| Early termination | 13,527 | 13.2 | 5,690 | 11.6 | 4,818 | 14.6*** | 2,151 | 15.3*** | 141 | 16.9*** | 727 | 12.5 |
| 1 gap with reinitiation | 4,384 | 4.3 | 2,106 | 4.3 | 1,365 | 4.2 | 600 | 4.3 | 42 | 5.0 | 271 | 4.7 |
| 2 gaps | 19,391 | 18.9 | 7,661 | 15.6 | 7,326 | 22.3*** | 3,105 | 22.1*** | 176 | 21.0*** | 1,123 | 19.3*** |
| ≥3 gaps | 25,238 | 24.6 | 9,272 | 18.9 | 10,526 | 32.0*** | 3,798 | 27.1*** | 195 | 23.3** | 1,447 | 24.9*** |
| Age (M±SD) | 8.0±1.8 | 7.9±1.8 | 8.1±1.8*** | 8.1±1.8 | *** | 8.1±1.9** | 7.9±1.8 | |||||
| Female | 32,866 | 32.0 | 17,086 | 34.8 | 9,941 | 30.2*** | 3,943 | 28.1*** | 258 | 30.8* | 1,638 | 28.1*** |
| Plan type | ||||||||||||
| Fee-for-service only | 7,264 | 7.1 | 3,477 | 7.1 | 1,894 | 5.8*** | 998 | 7.1 | 65 | 7.8 | 830 | 14.3*** |
| Any behavioral health care carve-out plan | 9,940 | 9.7 | 6,429 | 13.1 | 2,613 | 7.9*** | 527 | 3.8*** | 57 | 6.8*** | 314 | 5.4*** |
| Comprehensive managed care plan (no carve-out plan) | 42,108 | 41.0 | 20,766 | 42.3 | 14,759 | 44.8*** | 3,923 | 28.0*** | 246 | 29.4*** | 2,414 | 41.5 |
| Primary care case management (no carve-out plan) | 20,371 | 19.8 | 9,361 | 19.1 | 6,931 | 22.1*** | 2,896 | 20.6*** | 189 | 22.6* | 994 | 17.1*** |
| More than 1 type of plan | 22,986 | 22.4 | 9,013 | 18.4 | 6,732 | 20.4*** | 5,691 | 40.6*** | 280 | 33.5*** | 1,270 | 21.8*** |
| Medicaid eligibility category | ||||||||||||
| Blind or disabled | 10,811 | 10.5 | 1,749 | 3.6 | 3,527 | 10.7*** | 1,658 | 11.8*** | 76 | 9.1*** | 3,801 | 65.3*** |
| Foster care | 7,164 | 7.0 | 3,361 | 6.9 | 2,486 | 7.6*** | 1,103 | 7.9*** | 55 | 6.6 | 159 | 2.7*** |
| Otherc | 84,694 | 82.5 | 43,936 | 89.6 | 26,916 | 81.7*** | 11,274 | 80.3*** | 706 | 84.4*** | 1,862 | 32.0*** |
| General medical comorbidity | ||||||||||||
| Asthma | 18,013 | 17.5 | 7,404 | 15.1 | 6,580 | 20.0*** | 2,604 | 18.6*** | 158 | 18.9** | 1,267 | 21.8*** |
| Any other chronic conditiond | 4,079 | 4.0 | 1,785 | 3.6 | 999 | 3.0*** | 670 | 4.8*** | 41 | 4.9 | 584 | 10.0*** |
| Mental comorbidity | ||||||||||||
| Depressive disorder | 7,802 | 7.6 | 3,492 | 7.1 | 2,584 | 7.9*** | 1,328 | 9.5*** | 54 | 6.5 | 344 | 5.9*** |
| Conduct disorder or oppositional defiant disorder | 23,448 | 22.8 | 9,815 | 20.0 | 8,965 | 27.2*** | 3,060 | 21.8*** | 267 | 31.9*** | 1,341 | 23.0*** |
| Anxiety disorder | 6,610 | 6.4 | 3,600 | 7.3 | 1,660 | 5.0*** | 925 | 6.6** | 39 | 4.7*** | 386 | 6.6* |
| Bipolar disorder | 9,347 | 9.1 | 4,351 | 8.9 | 2,870 | 8.7 | 1,362 | 9.7** | 66 | 7.9 | 698 | 12.0*** |
| Schizophrenia or other psychotic disorder | 1,029 | 1.0 | 341 | .7 | 442 | 1.3*** | 148 | 1.1*** | 8 | 1.0 | 90 | 1.6*** |
| Other | 35,430 | 34.5 | 16,823 | 34.3 | 10,247 | 31.1*** | 5,406 | 38.5*** | 344 | 41.1*** | 2,610 | 44.8*** |
| Received any psychotherapy service in treatment period | 34,016 | 33.1 | 15,206 | 31.0 | 10,866 | 33.0*** | 5,521 | 39.3*** | 233 | 27.8* | 2,190 | 37.6*** |
| Received any new medication in treatment period | 27,701 | 27.0 | 14,213 | 29.0 | 8,746 | 26.6*** | 3,107 | 22.1*** | 211 | 25.2* | 1,424 | 24.5*** |
| Switched medication in treatment period | 41,722 | 40.6 | 21,709 | 44.3 | 11,836 | 35.9*** | 5,324 | 37.9*** | 314 | 37.5*** | 2,539 | 43.6 |
| County level characteristic (M±SD) | ||||||||||||
| % living in urban area | 65.6±29.8 | 54.4±29.3 | 73.7±27.3*** | 85.2±18.8*** | 59.6±29.7*** | 68.2±29.0*** | ||||||
| % living in poverty | 17.0±6.0 | 16.0±5.1 | 17.0±5.2*** | 20.8±8.4*** | 19.0±7.9*** | 16.8±5.7*** | ||||||
| Outpatient mental health facilities per 100,000 residents | 1.3±2.0 | 1.6±2.2 | 1.2±1.8*** | .6±1.3*** | 1.0±1.4*** | 1.3±2.0*** | ||||||
| Community health centers per 100,000 residentse | 3.7±6.6 | 4.4±7.6 | 3.0±5.4*** | 3.2±5.8*** | 5.2±6.0*** | 3.1±5.7*** | ||||||
| Primary care physicians per 100,000 residents | 60.0±27.7 | 56.2±28.6 | 67.6±28.0*** | 54.5±19.6*** | 58.2±28.3* | 61.7±26.9*** | ||||||
| Psychologists per 100,000 residents | 15.8±17.0 | 13.5±15.9 | 20.3±18.8*** | 12.5±12.6*** | 14.5±20.4 | 17.9±17.7*** | ||||||

Racial-Ethnic Differences in Medication Patterns
| Variable | Continuous treatment | Early termination | 1 gap with reinitiation | 2 gaps | ≥3 gaps | |||||
|---|---|---|---|---|---|---|---|---|---|---|
| MEb | SE | MEb | SE | MEb | SE | MEb | SE | MEb | SE | |
| Non-Hispanic black | –24.1*** | .6 | 4.1*** | .3 | .4* | .2 | 7.4*** | .2 | 12.2*** | .3 |
| Hispanic | –19.2*** | 1.3 | 4.1*** | .7 | .3 | .2 | 6.6*** | .6 | 8.2*** | .4 |
| Non-Hispanic other | –16.3*** | 3.0 | 5.0** | 1.7 | .9 | .6 | 5.5*** | 1.0 | 5.0*** | 1.4 |
| Unknown | –11.0*** | .9 | 1.2* | .5 | .5 | .3 | 3.7*** | .5 | 5.7*** | .6 |
| Interceptc | 49.6 | 11.6 | 4.3 | 15.6 | 18.9 | |||||
| Variable | Continuous treatment | Early termination | 1 gap with reinitiation | 2 gaps | ≥3 gaps | |||||
|---|---|---|---|---|---|---|---|---|---|---|
| MEb | SE | MEb | SE | MEb | SE | MEb | SE | MEb | SE | |
| Race-ethnicity (reference: non-Hispanic white) | ||||||||||
| Non-Hispanic black | –20.9*** | .5 | 3.0*** | .3 | .4* | .2 | 6.6*** | .2 | 10.8*** | .3 |
| Hispanic | –15.4*** | .7 | 2.6*** | .5 | .1 | .2 | 4.7*** | .4 | 7.8*** | .5 |
| Non-Hispanic other | –13.1*** | 2.1 | 3.4** | 1.2 | 1.2 | .6 | 4.7*** | 1.1 | 3.8** | 1.3 |
| Unknown | –10.1*** | .9 | .7 | .5 | .2 | .3 | 3.1*** | .5 | 6.1*** | .7 |
| Age | –2.7*** | .1 | .5*** | .1 | .03 | .03 | 1.0*** | .1 | 1.1*** | .1 |
| Female (reference: male) | –.6 | .3 | .9*** | .2 | .01 | .1 | .003 | .2 | –.4 | .2 |
| Plan type (reference: fee-for-service only) | ||||||||||
| Any behavioral health care carve-out plan | .5 | 1.7 | .3 | .9 | –.4 | .5 | –.5 | .9 | .05 | 1.1 |
| Comprehensive managed care plan (no carve-out plan) | .7 | 1.1 | –.4 | .6 | .05 | .3 | –.6 | .6 | .3 | .8 |
| Primary care case management (no carve-out plan) | .02 | 1.2 | .3 | .6 | .4 | .4 | –.2 | .7 | –.5 | .7 |
| More than one type of plan | –4.4*** | 1.1 | 1.0* | .5 | .8* | .3 | 1.7** | .6 | .9 | .7 |
| Medicaid eligibility category (reference: blind or disabled) | ||||||||||
| Foster care | 19.1*** | .8 | –3.2*** | .5 | –.8* | .3 | –7.4*** | .6 | –7.8*** | .7 |
| Other | –2.0** | .7 | –.03 | .4 | .1 | .3 | .5 | .4 | 1.5** | .5 |
| General medical comorbidity (reference: no indicated condition) | ||||||||||
| Asthma | .2 | .4 | –.5 | .3 | .4** | .2 | –.5 | .3 | .3 | .3 |
| Any other chronic condition | 1.8* | .9 | –.3 | .5 | .3 | .3 | .1 | .6 | –2.0** | .6 |
| Mental comorbidity (reference: no indicated disorder) | ||||||||||
| Depressive disorder | .9 | .7 | 1.3*** | .4 | –.02 | .2 | –.02 | .5 | –2.1*** | .5 |
| Conduct or oppositional defiant disorder | 1.3** | .4 | 1.2*** | .3 | –.2 | .2 | –.3 | .3 | –2.0*** | .3 |
| Anxiety disorder | .9 | .7 | 1.1** | .4 | .4 | .3 | –.7 | .4 | –1.7** | .5 |
| Bipolar disorder | 2.5*** | .6 | 1.6*** | .4 | .6** | .2 | –.5 | .4 | –4.1*** | .4 |
| Schizophrenia or other psychotic disorder | 2.5 | 1.6 | .1 | 1.0 | .9 | .5 | –1.5 | 1.2 | –2.1 | 1.2 |
| Other | 1.5*** | .4 | 1.1*** | .2 | –.2 | .1 | –.8** | .3 | –1.6*** | .3 |
| Received any psychotherapy service in treatment period (reference: no) | 6.3*** | .4 | –2.5*** | .3 | –.2 | .1 | –1.2*** | .3 | –2.5*** | .3 |
| Received any new medication in treatment period (reference: no) | 11.9*** | .4 | –6.9*** | .3 | –.1 | .1 | –3.3*** | .3 | –1.6*** | .3 |
| Switched medication in treatment period (reference: no) | 13.0*** | .4 | –11.8*** | .4 | 2.2*** | .1 | .4 | .2 | –3.9*** | .3 |
| County level characteristicc | ||||||||||
| % living in urban area | –.8* | .3 | .2 | .2 | .01 | .1 | .1 | .2 | .4 | .2 |
| % living in poverty | –1.9*** | .3 | .6** | .2 | .1 | .1 | .9*** | .1 | .3 | .2 |
| Outpatient mental health clinics per 100,000 residents | .03 | .2 | .04 | .1 | –.1 | .1 | .04 | .1 | –.001 | .2 |
| Community health centers per 100,000 residents | –.1 | .2 | –.01 | .1 | .02 | .1 | –.2 | .1 | .3 | .2 |
| Primary care physicians per 100,000 residents | –.01 | .3 | –.2 | .2 | .02 | .1 | –.3 | .2 | .4 | .2 |
| Psychologists per 100,000 residents | –.2 | .3 | –.1 | .2 | –.1 | .1 | .3* | .2 | .1 | .2 |
| Interceptd | 47.9 | 12.2 | 4.3 | 16.2 | 19.4 | |||||

Other Factors Associated With Medication Patterns
Supplemental Analyses
Discussion
Conclusions
Supplementary Material
- View/Download
- 60.51 KB
References
Information & Authors
Information
Published In

Cover: Flying Geese, by Felix Bracquemond, 19th century. Black chalk, brush, and watercolor, highlighted with white gouache. Museum purchase, Davis Museum, Welleseley College. Photo credit: Davis Museum/Art Resource, New York City.
History
Keywords
Authors
Competing Interests
Funding Information
Metrics & Citations
Metrics
Citations
Export Citations
If you have the appropriate software installed, you can download article citation data to the citation manager of your choice. Simply select your manager software from the list below and click Download.
For more information or tips please see 'Downloading to a citation manager' in the Help menu.
View Options
View options
PDF/EPUB
View PDF/EPUBLogin options
Already a subscriber? Access your subscription through your login credentials or your institution for full access to this article.
Personal login Institutional Login Open Athens loginNot a subscriber?
PsychiatryOnline subscription options offer access to the DSM-5-TR® library, books, journals, CME, and patient resources. This all-in-one virtual library provides psychiatrists and mental health professionals with key resources for diagnosis, treatment, research, and professional development.
Need more help? PsychiatryOnline Customer Service may be reached by emailing [email protected] or by calling 800-368-5777 (in the U.S.) or 703-907-7322 (outside the U.S.).
